



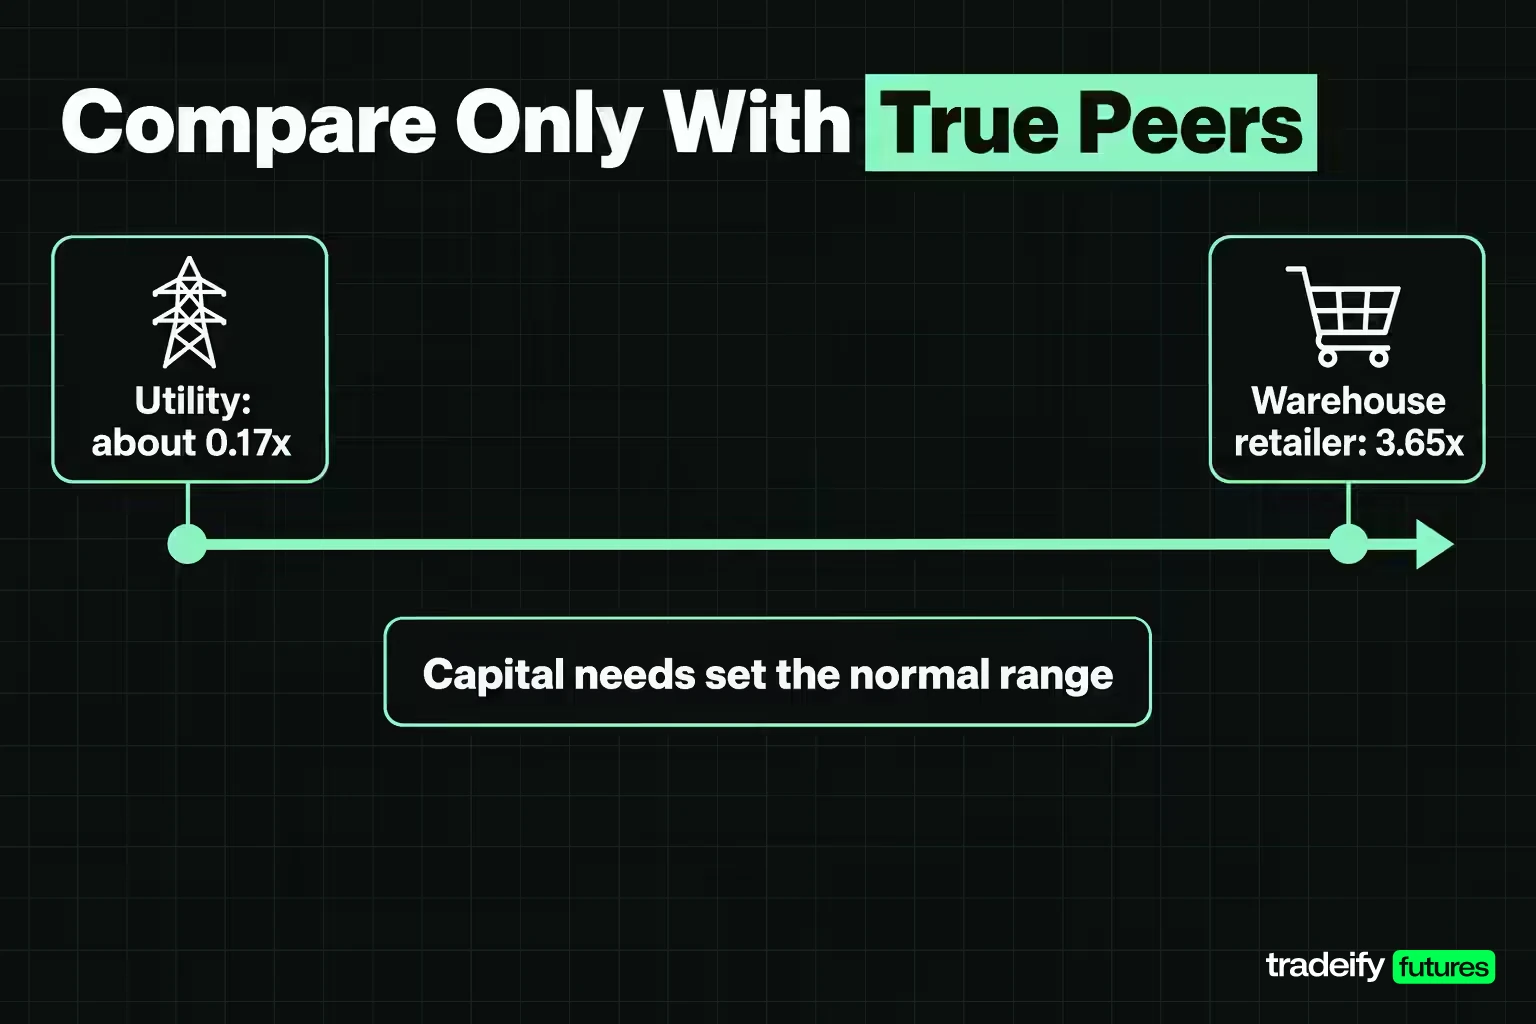
TL;DR: Asset turnover is net sales divided by average total assets, showing how much revenue a company produces from what it owns. A 2.5x ratio means $2.50 of sales per $1 of assets; it is a multiple, not a percentage. Ratios run from about 0.17x for a utility to 3.65x for a warehouse retailer, so compare only with true peers. Pair it with profit margin, since return on assets equals margin times turnover.
Asset turnover answers one narrow question: how many dollars of sales did a company produce for each dollar of assets it carried during the period?
The calculation takes a minute. The interpretation is where people get caught. A grocery chain, a chipmaker and an electric utility need wildly different asset bases to do business, so the same ratio can mean "excellent" for one and "something is wrong" for another. Even two direct competitors can report different numbers because one leases its stores and the other owns them.
The temptation is to rank companies by the number and move on. Resist it. This guide covers the formula, real calculations from five companies' latest annual reports, how to read a high or low result, what counts as good, and how asset turnover fits with profit margin and return on assets, so you can tell a genuinely efficient business from one that just looks efficient on a screen.
What Is Asset Turnover
Asset turnover is an efficiency ratio that compares a company's net sales with its average total assets. The OpenStax Principles of Finance textbook describes it as a measure of a company's ability to use its assets to generate revenue: the fewer assets needed for a given level of sales, the higher the ratio.
The result is a multiple, written like 0.5x, 1.0x or 2.5x. An asset turnover of 2.5x means the company generated $2.50 of net sales for every $1.00 of average assets during the period. It is not a percentage, even though some data services display it as one.
Three things the ratio does not tell you:
- Profit. The numerator is sales. A business can lift sales and asset turnover by cutting prices while its profit shrinks.
- Cash. Revenue booked is not cash collected.
- Risk. A company running with almost no spare capacity can post strong asset turnover and still be fragile when demand jumps or a supplier fails.
Analysts also call it total asset turnover, to separate it from fixed asset turnover, and some textbooks use "asset utilization ratio" for the same idea. Whatever the label, it is an activity measure. It shows how intensively the reported asset base was put to work, and that is the starting point of an analysis, not the conclusion.
Asset Turnover Formula and How to Calculate It

The standard asset turnover formula is:
Asset turnover = Net sales ÷ Average total assets
Average total assets = (Beginning total assets + Ending total assets) ÷ 2
The average matters because the two inputs come from different statements. The SEC's Beginners' Guide to Financial Statements explains that an income statement shows what a company made and spent over a period of time, while a balance sheet is a snapshot at the end of the reporting period. Sales accumulate across the whole year; total assets are measured on one day. Averaging the opening and closing balance gives a fairer measure of the assets that were actually available while the sales were being made. The beginning balance is simply the prior year's ending balance.
Asset turnover calculation step by step
- Find net sales (or total revenue, if the company does not report a separate net sales line) on the income statement for the period.
- Find total assets on the balance sheet at the start and end of the same period.
- Add the two asset balances and divide by two.
- Divide net sales by that average.
- Note the fiscal year, the revenue line you used and any big acquisitions or disposals before comparing the result with anything else.
Here is an illustrative company with round numbers: $500 million of net sales, $280 million of total assets at the start of the year and $320 million at the end.
- Average total assets = ($280 million + $320 million) ÷ 2 = $300 million
- Asset turnover = $500 million ÷ $300 million = 1.67x
The company produced about $1.67 of sales for each $1.00 of average assets. The arithmetic is done. Whether 1.67x is strong depends on the industry, the company's own history and its margins.
Why average assets beat ending assets in the asset turnover formula
Using only the year-end balance is the most common shortcut, and it biases the answer whenever the balance sheet moved during the year.
Walmart is a clean real example. For its fiscal year ended January 31, 2026, Walmart reported net sales of $706.4 billion. Its total assets were $260.8 billion at the start of the year and $284.7 billion at the end, an average of $272.75 billion.
- Using the average: $706.4 billion ÷ $272.75 billion = 2.59x
- Using ending assets only: $706.4 billion ÷ $284.7 billion = 2.48x
Same company, same year, and the shortcut knocks a tenth of a turn off the result. If you then compared that 2.48x with a peer calculated on averages, you would be measuring your method, not the businesses. When a company makes a large acquisition or capital investment mid-year, the gap gets bigger, and quarterly averages can be worth the extra work.
Asset Turnover Ratio Examples From Company Filings
The fastest way to build intuition is to run the asset turnover formula on real companies with very different business models. The figures below come from each company's most recent annual report (Form 10-K) filed with the SEC, as reported in the SEC's EDGAR financial data. The ratios are calculated from those filed figures.
| Company and fiscal year | Sales used | Beginning total assets | Ending total assets | Average total assets | Asset turnover |
|---|---|---|---|---|---|
| Costco, year ended Aug 30, 2026 | $303.2 billion total revenue | $77.1 billion | $89.0 billion | $83.1 billion | 3.65x |
| Walmart, year ended Jan 31, 2026 | $706.4 billion net sales | $260.8 billion | $284.7 billion | $272.75 billion | 2.59x |
| Caterpillar, calendar 2025 | $67.6 billion revenues | $87.8 billion | $98.6 billion | $93.2 billion | 0.73x |
| Microsoft, year ended June 30, 2026 | $331.8 billion revenue | $619.0 billion | $758.4 billion | $688.7 billion | 0.48x |
| Duke Energy, calendar 2025 | $32.2 billion operating revenues | $186.3 billion | $195.7 billion | $191.0 billion | 0.17x |
Each row follows the same three steps. For Costco: ($77.1 billion + $89.0 billion) ÷ 2 = $83.1 billion, and $303.2 billion ÷ $83.1 billion = 3.65x. For Duke Energy: ($186.3 billion + $195.7 billion) ÷ 2 = $191.0 billion, and $32.2 billion ÷ $191.0 billion = 0.17x.
Why asset turnover differs across these companies
The asset turnover spread in the table comes from business models, not management quality:
- Costco and Walmart sell huge volumes of goods at low prices through stores that turn inventory quickly. Every dollar of shelves, warehouses and stock cycles through several dollars of sales a year.
- Caterpillar builds heavy equipment, which takes plants, inventory and long production cycles. It also lends to customers who buy that equipment: financing receivables of $24.9 billion sat on its balance sheet at the end of 2025, about a quarter of total assets. Those loans earn interest, not equipment sales, so they pull the ratio down.
- Microsoft carries enormous data-center investment, plus cash, investments and goodwill from acquisitions. Its sales per dollar of assets are low even though its profits are very high.
- Duke Energy owns power plants, transmission lines and pipes that last decades. A regulated utility turning its assets over about once every six years is normal for the industry, not a red flag.
The point is not that Costco is "21 times better" than Duke Energy. The two companies are not solving the same problem. That is why an asset turnover number means almost nothing until you know what kind of business produced it.
How to Read an Asset Turnover Ratio
Start with the plain reading of the number:
- Below 1.0x: the company generated less than $1 of sales per $1 of average assets. A ratio of 0.5x means 50 cents of sales per dollar of assets. Common for asset-heavy businesses such as utilities, telecoms, real estate, and software or cloud companies with large data centers or acquisition goodwill.
- Around 1.0x: sales roughly equal the asset base over the year.
- Above 1.0x: each dollar of assets produced more than $1 of sales. At 2.0x, it produced $2. Common for retailers, distributors, restaurants and staffing firms.
A ratio of 1 or above is not automatically good, and a ratio below 1 is not automatically bad. One number is an observation, not a conclusion. The useful reading comes from three comparisons, and the conclusion only holds if all three point the same way.
Trend comparison of asset turnover
Calculate asset turnover for the same company over at least three years with the same method. One year tells you very little. A steady drift tells you something about how the business is changing.
Microsoft shows how a trend can carry the story. Its asset turnover was 0.53x in fiscal 2024, 0.50x in fiscal 2025 and 0.48x in fiscal 2026. Revenue grew 17.8% in fiscal 2026, so demand was not the problem. Average assets grew faster, about 21.8%, as the company poured money into data-center capacity. The falling ratio is the visible cost of building ahead of demand. If later years' revenue catches up, the ratio should stabilize or turn higher; if it keeps sliding while spending continues, the build-out case gets weaker. That is the kind of condition a trend line lets you test.
Peer comparison of asset turnover
Compare companies with similar economics: same industry, similar business mix, similar fiscal calendars and similar choices about owning versus leasing. Walmart against Costco is a fair test. Walmart against Duke Energy is not.
Splitting an asset turnover change into sales and assets
Split any change into its two parts. Did sales move, did assets move, or both? Asset turnover can rise because sales grew on a steady asset base, which usually signals better use of existing capacity. It can also rise because the company sold a division, delayed replacing old equipment or wrote down assets. The ratio moves the same way in every case. The meaning does not.
High vs Low Asset Turnover
High and low asset turnover each have a healthy version and a worrying version. Your job is to work out which one you are looking at.
What high asset turnover can mean
The healthy reading: the company keeps inventory moving, collects from customers quickly, runs its stores, plants or servers near full use and does not tie up money in idle assets. Discount retailers built their entire model around this.
The less healthy readings:
- Thin margins. Turnover can be high precisely because prices are low. The company is moving a lot of product without keeping much of each sale.
- Underinvestment. Old, heavily depreciated equipment has a small book value, so the ratio looks great while the company postpones spending it will eventually have to make.
- No room for growth. A business at full capacity cannot take on a surge in orders without building first.
- Accounting effects. Write-downs and asset sales shrink the denominator without any operational improvement.
What low asset turnover can mean
The worrying reading: sales are weak relative to the assets on the books. Typical causes include excess inventory, slow collections, idle plants or stores, falling demand, or an acquisition that has not produced the revenue it was bought for.
The less worrying readings:
- Capital-heavy by nature. Utilities, pipelines, railways and telecoms will always show low asset turnover.
- Investment ahead of demand. New capacity sits on the balance sheet before it produces sales. Ask when the assets went into service and what management expects them to deliver.
- Cash and investments. A company sitting on a large cash pile has a bigger denominator, which drags the ratio down without saying anything about operations.
- Other kinds of assets. Finance receivables, investments in other companies and goodwill all count as assets but do not produce product sales directly.
A practical rule: whenever asset turnover moves meaningfully, write one sentence explaining why, with a line from the financial statements or the notes to back it up. If you cannot write that sentence, you do not understand the move yet, and any conclusion you draw is a guess dressed up as analysis.
What Is a Good Asset Turnover Ratio
There is no universal good asset turnover ratio. A good ratio is one that is in line with or better than genuinely comparable peers and stable or improving against the company's own history, with margins that hold up at the same time.
The five companies in the 10-K table run from 0.17x to 3.65x, and every one of them is a large, established business. That spread is the honest answer to "what is a good number": it depends on how much capital the industry needs to deliver each dollar of sales.
Asset turnover by industry
Rough patterns, not hard thresholds:
| Business type | Typical asset turnover profile | Why |
|---|---|---|
| Discount retail and grocery | Usually high | High volume, fast inventory, low prices |
| Restaurants, distributors and staffing | Moderate to high | Modest fixed assets relative to sales |
| Industrial manufacturers | Moderate to low | Plants, inventory and long production cycles |
| Software and cloud platforms | Usually low | Data centers, cash balances and acquisition goodwill |
| Utilities, telecoms and real estate | Very low | Long-lived infrastructure with regulated or rental returns |
Treat this table as a guide to where to look, not a pass/fail line. The more different two business models are, the less a direct comparison means.
How to build an asset turnover peer benchmark
- Pick three to five peers with the same core business and similar ownership of assets (own versus lease).
- Use the same sales line and the average-assets method for every company.
- Line the fiscal years up as closely as possible.
- Calculate at least three years for each company and compare the trend, not just the latest figure.
- Look at margins alongside the ratio before calling anyone efficient.
Is Walmart's asset turnover good
Walmart's 2.59x in fiscal 2026 shows how a benchmark changes the answer. Against Duke Energy's 0.17x it looks spectacular. Against Costco's 3.65x it looks slow. Neither comparison settles anything, because neither company runs Walmart's mix of supercenters, e-commerce and international stores.
The more useful test is Walmart against itself. In fiscal 2025 its net sales were $674.5 billion on average total assets of $256.6 billion, an asset turnover of 2.63x. So the ratio dipped slightly in fiscal 2026. The driver split explains why: net sales grew 4.7%, while total assets rose 9.1% over the year (from $260.8 billion to $284.7 billion), much of it in property and equipment. A small dip while the company is investing is not a warning on its own. Several years of decline with flat margins would be.
So a good asset turnover ratio passes three checks: it sits near or above true peers, it holds steady or improves over several years, and margins are not being sacrificed to get it.
Factors That Change Asset Turnover
Anything that moves sales or the asset base moves asset turnover. The common drivers fall into two groups.
Operating factors behind asset turnover
- Sales volume and pricing. More units sold on the same assets raises the ratio. So do price increases, as long as volume holds.
- Inventory management. Inventory is an asset. Excess stock inflates the denominator; faster turns shrink it.
- Receivables collection. Slow-paying customers leave money sitting in accounts receivable, which is also an asset.
- Capacity use. A plant or data center running at 60% capacity carries the same asset cost as one running at 95%.
- Asset age. Older assets are more depreciated and carry lower book values, which raises the ratio mechanically, even if the equipment is less productive.
Accounting choices that shift asset turnover
- Leasing versus owning. Lease accounting now puts most leases on the balance sheet, but the amounts can still differ from what owning the same assets would show, so a lease-heavy retailer and an owner-operator are not perfectly comparable.
- Acquisitions. Buying a company adds its assets and goodwill immediately, while its sales only count from the closing date.
- Write-downs and impairments. These cut the denominator without changing operations.
- Cash and investments. Large cash balances make the asset base bigger without generating sales.
- Finance arms. Manufacturers that lend to their customers, like Caterpillar with $24.9 billion of financing receivables at the end of 2025, carry loans that dilute the ratio.
- Seasonality. A retailer with a January fiscal year-end measures its balance sheet after the holiday inventory has sold, which makes its year-end assets lower than a mid-year snapshot would show.
Asset Turnover and Profit Margin in Return on Assets
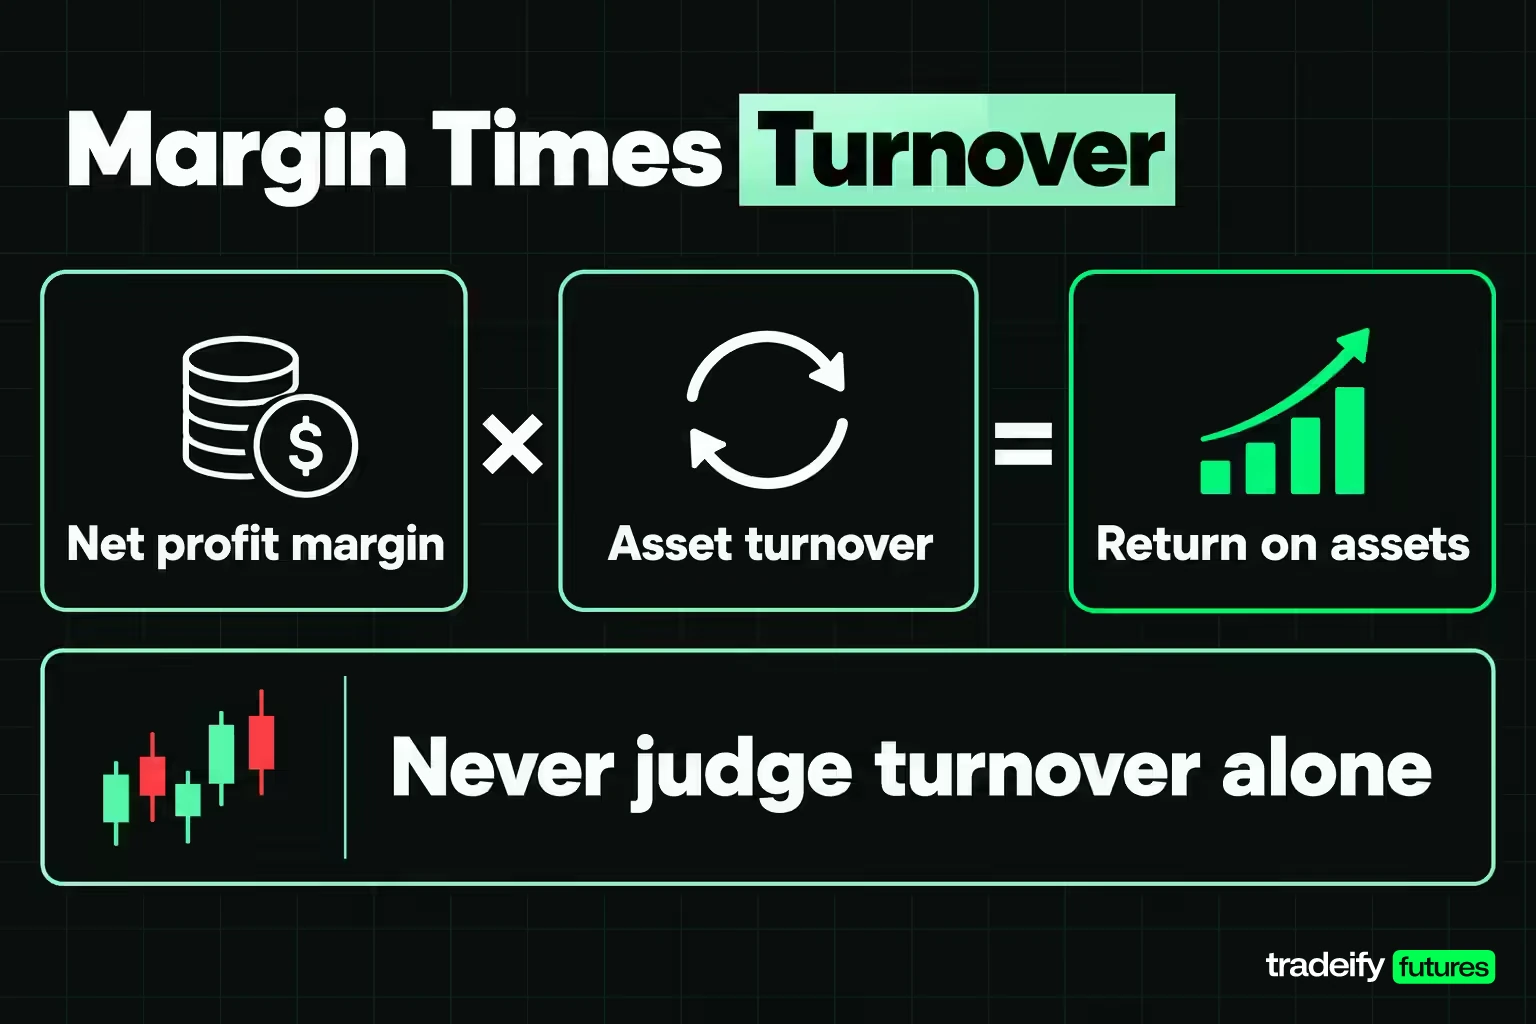
Asset turnover tells you how much a company sells per dollar of assets. Profit margin tells you how much it keeps per dollar of sales. Multiply the two and you get return on assets:
Return on assets = Net profit margin × Asset turnover
This is the core of the DuPont method, which OpenStax traces back to 1919, when the DuPont company began using it internally. The full version adds an equity multiplier to reach return on equity, but the first two terms already show why asset turnover cannot be judged alone.
An illustrative asset turnover and margin comparison
Two illustrative companies in the same industry for the same year, figures in millions:
| Measure | Company A | Company B |
|---|---|---|
| Net sales | $250 | $300 |
| Beginning total assets | $80 | $180 |
| Ending total assets | $120 | $220 |
| Average total assets | $100 | $200 |
| Net income | $12.5 | $24 |
| Asset turnover | 2.5x | 1.5x |
| Net profit margin | 5.0% | 8.0% |
| Return on assets | 12.5% | 12.0% |
If you stopped at asset turnover, Company A looks far stronger. That is the trap. Company B keeps more of every sale. Run the multiplication: 5.0% × 2.5 = 12.5% for A, and 8.0% × 1.5 = 12.0% for B. Their returns on assets are almost identical. They simply got there by different routes, one fast and lean, one slower with richer margins. The better question is which model holds up when costs rise or demand slips.
Walmart vs Microsoft on asset turnover and margin
The same logic on the 10-K figures makes the contrast sharper:
- Walmart, fiscal 2026: net income of $21.9 billion on $706.4 billion of net sales is a 3.1% margin. Times 2.59x asset turnover, that is an 8.0% return on assets.
- Microsoft, fiscal 2026: net income of $133.7 billion on $331.8 billion of revenue is a 40.3% margin. Times 0.48x asset turnover, that is a 19.4% return on assets.
Microsoft's asset turnover is less than a fifth of Walmart's, yet its return on assets is more than double. A screen that ranks companies by asset turnover alone would get this exactly backwards.
Fixed Asset Turnover vs Total Asset Turnover
Total asset turnover uses every asset on the balance sheet: cash, receivables, inventory, property, goodwill and everything else. Fixed asset turnover narrows the denominator to fixed assets, usually net property, plant and equipment (PP&E). The SEC's guide describes fixed assets as the assets used to operate the business rather than to sell, such as trucks, office furniture and other property.
Fixed asset turnover = Net sales ÷ Average net PP&E
| Measure | Total asset turnover | Fixed asset turnover |
|---|---|---|
| Denominator | Average total assets | Average net property, plant and equipment |
| Question it answers | How hard is the whole balance sheet working? | How hard are the plants, stores and equipment working? |
| Best for | Overall efficiency and DuPont analysis | Capital-heavy businesses and capex decisions |
| Blind spot | Cash, goodwill and receivables can distort it | Ignores inventory, receivables and intangible assets |
Walmart's average net PP&E in fiscal 2026 was $128.0 billion (from $120.0 billion to $136.1 billion), so its fixed asset turnover was $706.4 billion ÷ $128.0 billion = 5.52x, against total asset turnover of 2.59x.
Microsoft's fixed asset turnover shows the data-center build-out even more clearly than its total ratio. Net PP&E climbed from $95.6 billion in mid-2023 to $135.6 billion, $205.0 billion and then $313.1 billion by June 30, 2026. Fixed asset turnover fell from 2.12x in fiscal 2024 to 1.65x in fiscal 2025 and 1.28x in fiscal 2026. The total asset version only slipped from 0.53x to 0.48x over the same years, because cash, investments and goodwill dilute the effect. If the question is "is the new capacity earning its keep yet?", the fixed asset version is the sharper tool.
Label which version you are using every time. Mixing a fixed asset turnover figure from one source with a total asset turnover figure from another produces a meaningless comparison.
How Companies Improve Asset Turnover
There are two ways to raise asset turnover: produce more sales from the same assets, or carry fewer assets for the same sales. The honest levers:
- Sell more through existing capacity. Longer opening hours, better store layouts, new channels such as online orders filled from existing stores, or more shifts on an existing production line.
- Cut inventory. Better demand forecasting, fewer slow-moving products and faster replenishment free up money tied up in stock.
- Collect faster. Tighter credit terms, prompt invoicing and active follow-up shrink receivables.
- Sell or close underused assets. Idle plants, vacant stores and non-core divisions inflate the asset base.
- Use assets more intensively. Shared equipment, better maintenance scheduling and less downtime raise output per asset.
- Lease or outsource selectively. Contract manufacturing or third-party logistics can move assets off the company's books, though lease accounting means many leases still appear on the balance sheet.
And the levers that raise the ratio without improving the business:
- Postponing necessary equipment replacement.
- Writing down assets after a failed project.
- Cutting prices so deeply that sales rise but profit falls.
- Paying out cash that the business may need later.
When asset turnover improves, check which list the improvement came from before giving management credit. Margins, capital spending and the cash-flow statement will usually tell you. Rising turnover with steady margins and normal capital spending points to the first list; rising turnover with shrinking capital spending and a write-down in the notes points to the second.
Common Asset Turnover Mistakes
The most common asset turnover errors are method errors, not math errors.
Asset turnover input mistakes
- Using ending assets instead of the average. Walmart's fiscal 2026 asset turnover is 2.59x on average assets but 2.48x on ending assets alone. After a big acquisition, the gap can be much larger.
- Comparing unrelated businesses. A utility and a software company should never sit on the same asset turnover leaderboard.
- Treating sales as profit. High asset turnover with collapsing margins is not efficiency. Always check net margin and return on assets alongside it.
- Mismatched periods and revenue lines. Mixing a trailing-twelve-month sales figure with a fiscal-year balance sheet, or net sales for one company and total revenue for another, quietly breaks the comparison.
- Mixing total and fixed asset turnover. They answer different questions and produce very different numbers for the same company.
Asset turnover mistakes around deals and write-downs
Acquisitions and write-downs move the denominator suddenly, so they produce the biggest misreadings of asset turnover.
- Ignoring acquisitions. Here is an illustrative case. A company with $100 million of sales on $100 million of average assets runs at 1.0x. Near year end it buys a business, lifting total assets to $160 million but adding only $5 million of sales before the year closes. Average assets become $130 million, sales $105 million, and asset turnover drops to about 0.81x without any change in how the original business performs.
- Missing write-downs. Illustratively, a company with $400 million of sales and $250 million of average assets runs at 1.6x. If a $50 million write-down taken before the year began leaves average assets at $200 million, the same $400 million of sales produces 2.0x. Nothing about the operations improved.
Asset Turnover for Traders and Earnings Season
Asset turnover is an investor's ratio first, but it can still sharpen a trader's read of earnings season. Annual and quarterly reports land with revenue and balance-sheet figures at the same time, and a sharp change in asset turnover often sits behind the questions analysts ask on the call: why inventory is building, why receivables grew faster than sales, or when new capacity will start producing revenue.
A few practical uses:
- Separate growth from build-out. A company growing sales while its asset turnover falls is investing ahead of demand. The market may reward it or punish it depending on whether revenue catches up, which makes the next report's sales line the number to watch.
- Spot inventory stress early. Asset turnover dropping alongside rising inventory in a retailer or manufacturer can point to discounting ahead.
- Read megacap results in index context. The largest companies in the S&P 500 and Nasdaq-100 carry heavy weight in those indexes, so how investors react to their capital spending and returns can move the broad index, and index futures with it, on report days.
None of this is a trade signal. It is context that can explain why a report moved a stock or an index the way it did.
On our accounts, traders trade CME futures such as ES and NQ, not individual stocks, so a company's asset turnover never becomes a position on a Tradeify account. It can still shape the session when a big index component reports. News trading is allowed on our accounts at the trader's own risk, and every position has to be closed by 4:45 PM ET, so a reaction to an after-the-bell report is traded within a session and never held overnight.
Asset Turnover FAQ
Is asset turnover a percentage?
No. Asset turnover is a multiple, such as 0.8x or 2.5x, showing dollars of sales per dollar of average assets. Some data services print it as a percentage (250% instead of 2.5x), but the meaning is the same.
How is turnover ratio calculated?
Most turnover ratios divide a flow from the income statement by an average balance from the balance sheet. Asset turnover is net sales ÷ average total assets. Inventory turnover is cost of sales ÷ average inventory, and accounts receivable turnover is credit sales ÷ average accounts receivable.
What does the asset utilization ratio measure?
The asset utilization ratio measures how much revenue a company generates from each dollar of assets, and it is usually another name for asset turnover. Some analysts use the term more broadly for a family of ratios that includes inventory and receivables turnover, so check the formula behind any figure you see.
What does the capital turnover ratio measure?
Capital turnover compares sales with the capital invested in the business rather than with total assets. Definitions vary: some use shareholders' equity, others use capital employed (total assets minus current liabilities). It shows how much revenue each dollar of invested capital supports, so always confirm which denominator a source uses.
What is the formula for calculating assets?
The accounting equation states that assets = liabilities + shareholders' equity. For asset turnover, you do not need to rebuild total assets yourself. Read the total assets line from the balance sheet at the start and end of the period and average the two.
Is asset turnover the same as inventory turnover?
No. Asset turnover compares sales with all assets. Inventory turnover compares cost of sales with average inventory and shows how many times stock was sold and replaced during the period. A company can have fast inventory turns and still low asset turnover if it owns a lot of property or holds large cash balances.
Can asset turnover be negative?
In practice, no, because sales and total assets are both normally positive. If a data service shows a negative figure, check its source fields for a data error.
Asset turnover and every example in this article are for education only and are not investment advice or a recommendation to buy or sell any security or futures contract. Financial ratios describe past reporting periods and can change quickly. Futures trading uses leverage, and losses can exceed what you expect. Evaluation and funded trading accounts are simulated, and past results do not guarantee future performance.


