



TL;DR: Bond prices vs yields is a seesaw: when the yield buyers require goes up, an existing bond's price falls, and the reverse. The coupon stays fixed, so price is the only thing that can adjust. How far price moves depends on maturity, coupon and duration. In a 4% coupon example, a 1-point yield rise cuts a 10-year bond 7.79% and a 30-year 15.45%. Credit, inflation and supply can move yields even when the policy rate stays put.
A hot data release hits, Treasury yields jump, and the bond futures chart drops in the same second. It is tempting to read that as two signals confirming each other. It is one repricing, seen from both sides.
The direction is easy to memorize. Where traders get caught is everything around it: which yield is on the screen, why one bond barely moves while another drops hard, and whether the move came from rate expectations, inflation, credit risk or plain supply and demand. Get those wrong and you can be right about direction and still misjudge the trade.
Why Bond Prices and Yields Move in Opposite Directions
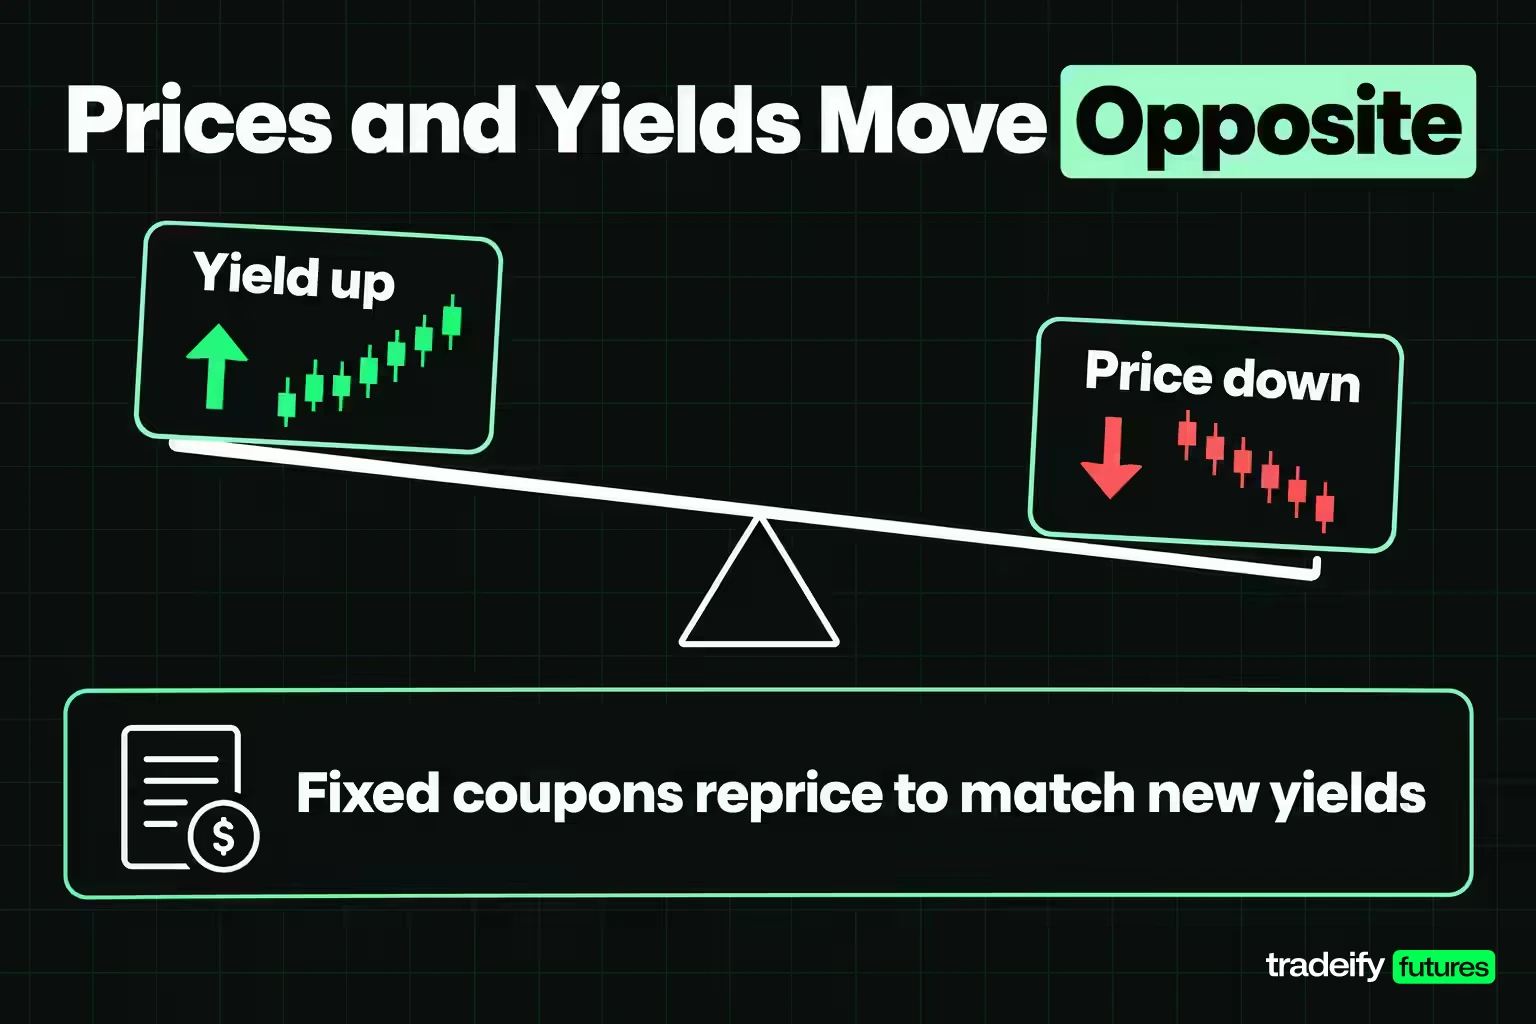
A conventional fixed-rate bond promises a set stream of cash: coupon payments on a schedule and the principal back at maturity. Those dollar amounts are written into the bond. They do not grow when market interest rates rise.
So when new bonds with similar maturity and credit start paying more, nobody pays full price for an older bond that pays less. Why would they? Its market price drops until a buyer at the new price earns roughly what a new bond would pay. When new bonds pay less, the older bond's fixed payments look better, and buyers bid its price up. FINRA puts it in one line: price and yield are inversely related.
The SEC's investor bulletin on interest rate risk uses a clean example. A Treasury bond with a 3% coupon, paid semi-annually, $1,000 face value and 10 years to maturity trades at $1,000 when market rates are 3%. One year later, with 9 years remaining:
| Market rate one year later | Bond price | Yield to maturity for a new buyer |
|---|---|---|
| Falls to 2% | $1,082 | 2% |
| Stays at 3% | $1,000 | 3% |
| Rises to 4% | $925 | 4% |
The coupon never changed. The price did all the work. That is the whole mechanism behind bond prices vs yields, and it applies to Treasuries too: the SEC notes that a U.S. government guarantee covers interest and principal payments, not the market price if you sell before maturity.
When yields go up, bond prices go down. When yields go down, bond prices go up. Direction is the easy part; size and cause are where the real decisions sit.
What a Bond Price Represents
A bond price is what the market will pay today for the bond's remaining cash flows. In finance terms it is the present value of every coupon still to come plus the principal at maturity, each discounted at the yield buyers currently require for that kind of risk.
Bond prices are usually quoted as a percentage of face value rather than in dollars. FINRA's example: a $1,000 bond bought at par is described as "trading at 100." If it later trades at 103, the price is $1,030. Treasury auction results are quoted the same way, often to several decimals. TreasuryDirect shows a 20-year bond auctioned at a 1.850% yield with a 1.750% interest rate, which priced at 98.336995, a little under par.
Get comfortable with that quoting style before you look at a bond chart. A move from 100 to 99 on a $1,000 bond is $10, and on a larger face amount the same one-point move scales up with it.
Face Value, Par Value and a Bond's Market Price
Face value and par value mean the same thing: the principal the issuer promises to repay at maturity. Investor.gov defines principal as "also known as face value or par value." For most individual bonds that is $1,000 per bond, and it does not change over the bond's life.
Market value is different. It is whatever the bond trades for today, and it can sit above or below face value:
- Premium: the price is above par because the bond's coupon is higher than the yield the market now requires.
- Par: the price equals face value because the coupon and required yield match.
- Discount: the price is below par because the coupon is lower than the yield the market now requires.
TreasuryDirect lays the rule out for Treasury notes and bonds. If the yield to maturity is greater than the interest rate, the price is less than par. If they are equal, the price is par. If the yield is lower, the price is above par.
Pull to Par as a Bond Approaches Maturity
A bond's market price drifts toward face value as maturity gets closer, because the final principal payment is a fixed amount and fewer discounted coupons remain. Take an illustrative 5-year bond with a $1,000 face value and a 4% annual coupon, bought when the market requires 5%. If that required yield never changes, the price climbs on its own:
| Years left to maturity | Price at a constant 5% yield |
|---|---|
| 5 | $956.71 |
| 4 | $964.54 |
| 3 | $972.77 |
| 2 | $981.41 |
| 1 | $990.48 |
| 0 | $1,000 |
This is why a bond held to maturity, with no default, ends at face value no matter where the price wandered in between. It is also why a discount bond's yield to maturity is higher than its coupon: part of the return comes from that climb back to par.
What Bond Yield Means
Bond yield is the return a buyer can expect from a bond at today's price. The Reserve Bank of Australia describes it as the return an investor expects each year over the bond's remaining term, accounting for the interest payments and principal still to come relative to the price paid.
The same number has a second meaning for the borrower. A government or company issuing a new bond pays roughly the current yield on similar bonds, so the bond yield is also the annual cost of borrowing in the bond market.
"Yield" is a family name, though, not a single measure. FINRA lists several that get quoted:
- Coupon yield (the coupon rate)
- Current yield
- Yield to maturity
- Yield to call
- Yield to worst
When someone says a bond "yields 5%," ask which of these they mean before you compare it with anything. Most market headlines about Treasury yields refer to yield to maturity on a benchmark security.
Coupon Rate vs. Yield on a Bond
The coupon rate and the yield answer two different questions. The coupon rate tells you how much interest the bond pays relative to its face value. The yield tells you what you earn relative to the price you actually pay.
Coupon Rate
The coupon rate is set when the bond is issued and does not change for the life of a fixed-rate bond. A 4% coupon on $1,000 of face value pays $40 a year whether the bond trades at $900 or $1,100.
Current Yield
Current yield divides the annual coupon by the current market price:
Current yield = annual coupon ÷ market price
FINRA's example: a $1,000 bond paying $45 a year has a 4.5% coupon yield. If the price rises to $1,030, the current yield falls to 4.37%. With a $40 coupon, a price of $950 gives a current yield of 4.21%, and a price of $1,050 gives 3.81%.
Current yield is quick, but it ignores the gain or loss between the price you pay and the face value you get back at maturity.
Yield to Maturity
Yield to maturity (YTM) is the discount rate that makes the present value of all remaining coupons and principal equal the bond's price. It captures income and the pull toward par in one number, which is why it is the standard way bond yields are quoted.
FINRA is clear that YTM is an estimate. It assumes payments arrive on time, it generally assumes coupons are reinvested at the same rate, and it ignores taxes and brokerage costs. Your realized return can differ if you sell early, reinvest at a different rate or the issuer defaults.
Yield to Call and Yield to Worst
Some bonds can be repaid early by the issuer. Yield to call runs the same calculation to the first call date and call price. Yield to worst is the lower of YTM and yield to call, and FINRA suggests checking it on every callable bond, because an issuer usually calls when rates have fallen, cutting off the price gain you would otherwise get.
Bond Price vs. Yield Worked Example
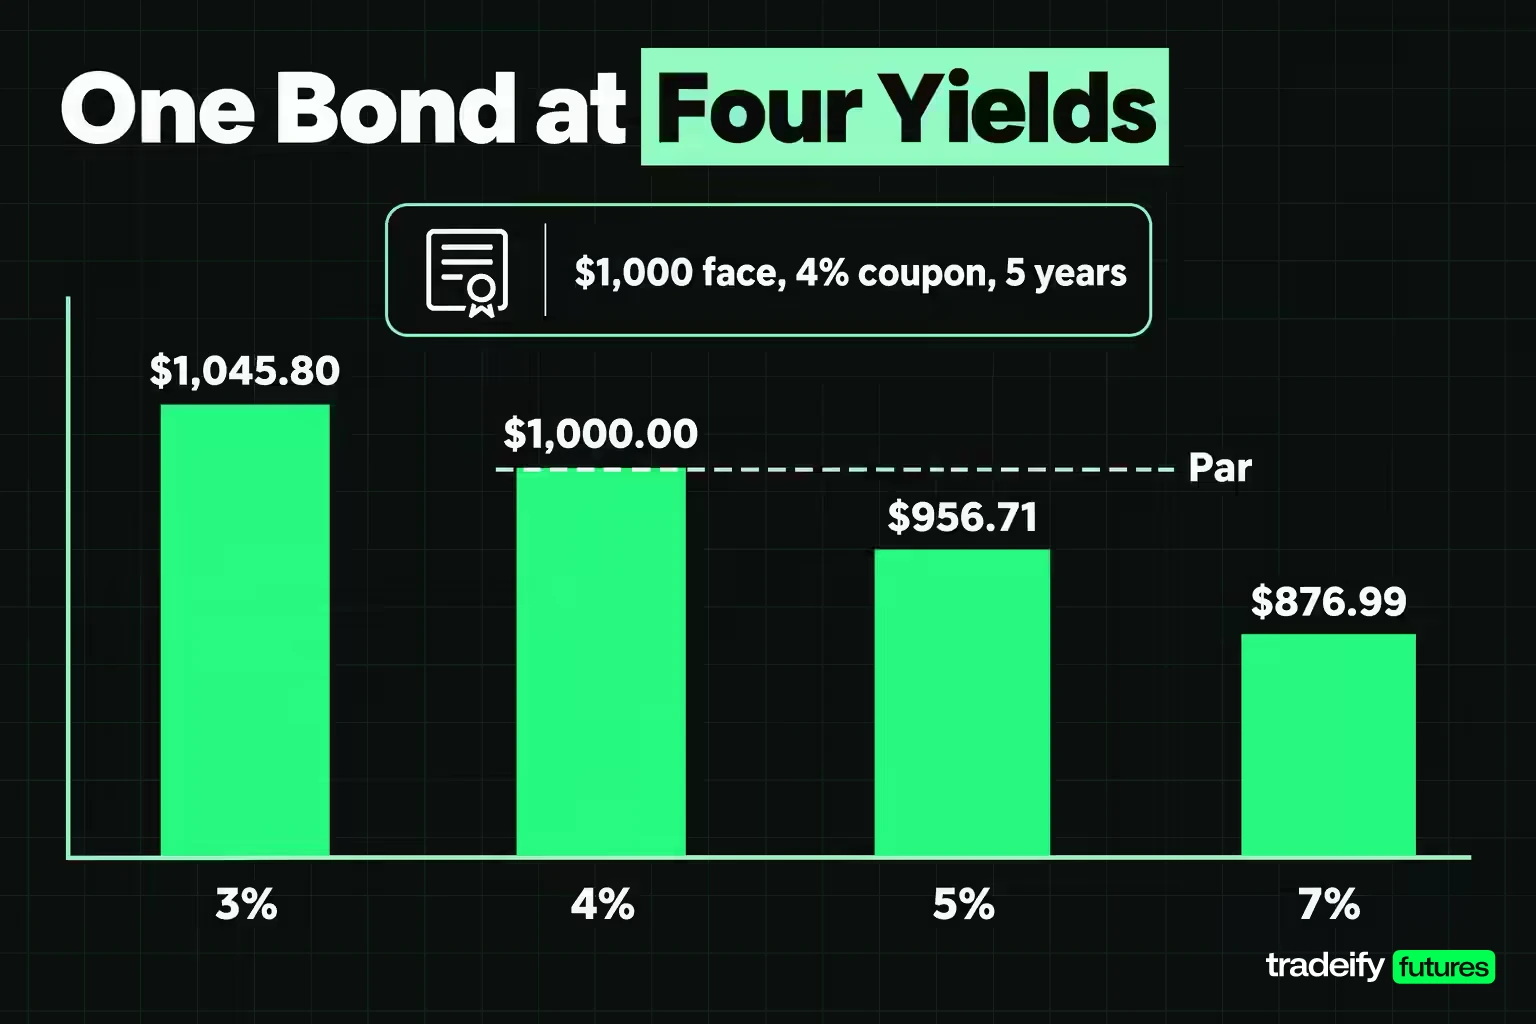
Here is one illustrative bond priced at four different required yields:
- $1,000 face value
- 4% annual coupon, so $40 once a year
- 5 years to maturity
- No call feature and no default assumed
Its price is the sum of five $40 coupons and the $1,000 principal, each discounted at the required yield:
Price = sum of [coupon ÷ (1 + yield)^t] for each year t, plus [face value ÷ (1 + yield)^n]
| Required yield | Price | Current yield at that price | Trades at |
|---|---|---|---|
| 3% | $1,045.80 | 3.82% | Premium |
| 4% | $1,000.00 | 4.00% | Par |
| 5% | $956.71 | 4.18% | Discount |
| 7% | $876.99 | 4.56% | Deeper discount |
Watch what stays fixed and what moves. The $40 coupon never changes. The market moves the price until the full cash-flow stream delivers the required yield.
Notice also that current yield moves in the same direction as YTM but lags it. At a 7% required yield, the current yield is only 4.56%, because current yield ignores the $123.01 the buyer collects as the price climbs back to $1,000 at maturity. That gap is the reason "a 4% bond" does not yield 4% to anyone buying it today unless it trades at par.
How Maturity and Coupon Change Bond Price Sensitivity
Every fixed-rate bond moves opposite to its yield, but not by the same amount. Maturity and coupon decide how hard the price reacts.
Longer Maturity Means Bigger Bond Price Moves
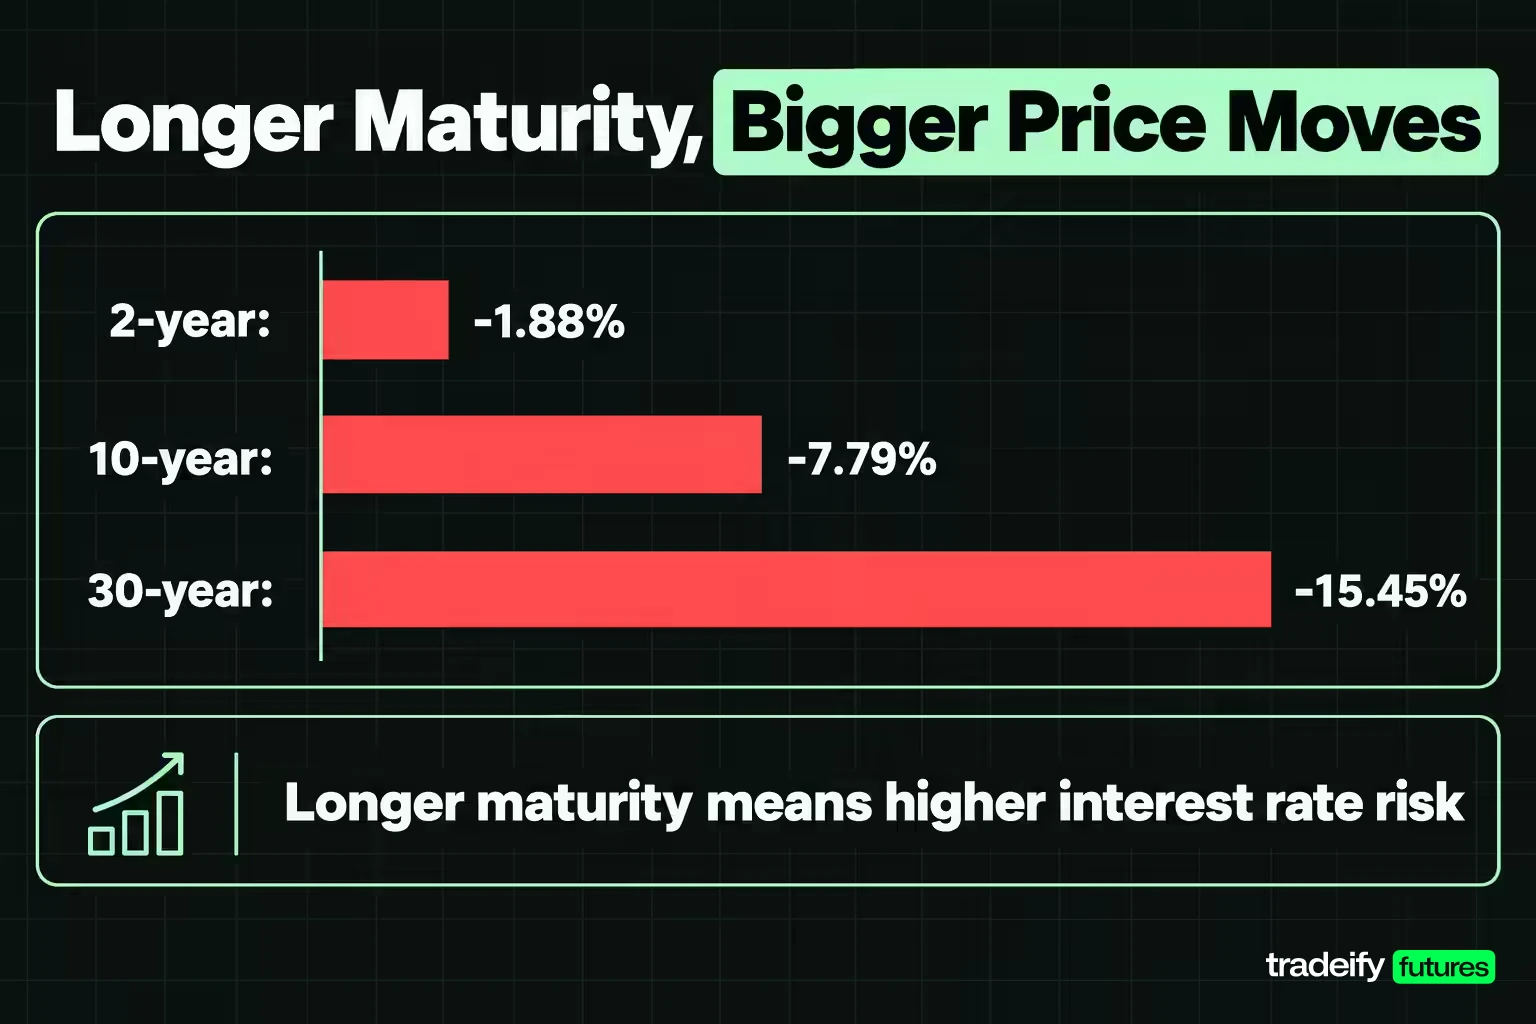
Take three illustrative bonds, each with a $1,000 face value and a 4% coupon paid semi-annually, all priced at par when the market requires 4%. Shift the required yield one point either way:
| Maturity | Price at 3% | Price at 5% | Change for a 1-point rise | Change for a 1-point fall |
|---|---|---|---|---|
| 2-year | $1,019.27 | $981.19 | -1.88% | +1.93% |
| 10-year | $1,085.84 | $922.05 | -7.79% | +8.58% |
| 30-year | $1,196.90 | $845.46 | -15.45% | +19.69% |
Same coupon, same yield change, very different damage. The 30-year bond's cash flows sit further in the future, so a change in the discount rate compounds over many more years. The SEC bulletin states the general rule: longer maturity means higher interest rate risk.
Even small yield changes show the gap. A 0.25-point rise from 4% moves those three bonds by about -0.47%, -2.02% and -4.22%. A quarter point is an ordinary week in the rates market, not a crisis.
Lower Coupons Mean Bigger Bond Price Moves
Coupon size matters too. For an illustrative 10-year bond whose required yield rises from 4% to 5%:
- A 2% coupon bond falls 8.41%.
- A 6% coupon bond falls 7.35%.
- A zero-coupon bond falls 9.32%.
A lower coupon pushes more of the bond's value into the final principal payment, which is the most rate-sensitive cash flow. The SEC bulletin says the same: lower coupon, higher interest rate risk.
Duration and Convexity in Bond Pricing
Duration rolls maturity and coupon into one sensitivity number. Modified duration estimates the percentage price change for a 1-point change in yield. For illustrative $1,000 bonds with a 4% semi-annual coupon priced at par, modified duration works out to 1.90 (2-year), 8.18 (10-year) and 17.38 (30-year). That lines up with their actual moves for a 1-point yield rise: -1.88%, -7.79% and -15.45%.
Duration is a straight-line estimate of a curved relationship. For that 10-year bond, duration predicts a 24.53% drop for a 3-point yield rise, but the actual drop is 21.32%. A 3-point fall produces a 28.48% gain, more than the straight-line estimate. That curvature is called convexity, and it means a plain fixed-rate bond tends to gain more when yields fall than it loses when yields rise by the same amount.
How Interest Rate Changes Affect Bond Prices
When market interest rates rise, new bonds come to market with higher coupons, and existing lower-coupon bonds reprice down to compete. When rates fall, existing bonds with higher coupons become worth more. Investor.gov describes the practical result: to sell an older bond with a lower rate after rates rise, "you might have to sell it at a discount."
Central bank policy is the anchor for the short end of that process. As of November 4, 2026, the Federal Reserve's target range for the federal funds rate is 3.75%-4.00%, after a quarter-point increase on September 16, 2026 and a hold on October 28, 2026. Changes or expected changes in that range tend to move short-term yields most directly. Longer-term yields also reflect where investors expect the policy rate to go over many years and how uncertain they are about it.
The market usually moves before the decision. If traders come to expect a hike at the next meeting, short-term yields can rise and bond prices fall weeks before the announcement. On the day itself, the reaction depends on the surprise relative to expectations. A hike that everyone priced in can barely move bonds, and that catches traders who expected fireworks.
Holding a Bond to Maturity vs. Selling Early
Interest rate changes hit a bond's market value right away, but whether that becomes a realized loss depends on what you do with the bond. Investor.gov notes that if you hold to maturity you receive face value plus interest, assuming the issuer pays. If you sell before maturity, the price may be above or below face value.
That does not make a price drop meaningless for a holder. Money locked in a 3% bond while new bonds pay 4% is earning less than it could, and inflation can erode the purchasing power of fixed payments. The loss on paper is the market's estimate of that opportunity cost.
Bond Yield vs. Interest Rate
People use "interest rate" and "yield" as if they were the same thing. They overlap, but they are not identical.
- An interest rate is a broad term: the price of borrowing money. It can mean a central bank's policy rate, a mortgage rate, a savings rate or a bond's coupon rate.
- A bond's coupon rate is the fixed interest rate the issuer pays on face value. For Treasuries it is set at auction and then stays put.
- A bond's yield is the return implied by the bond's current price. It changes every time the price changes.
The two connect through the market. The policy rate anchors short-term yields, and bond yields feed into other borrowing costs. FINRA notes that U.S. mortgage rates typically follow the 10-year Treasury yield closely. When someone says "rates went up today," they almost always mean market yields on Treasuries rose, not that any central bank acted.
What Moves Bond Yields
A rising yield tells you the bond repriced. It does not tell you why. These are the usual drivers, and more than one can be at work at once.
Policy Rate Expectations
Expected changes in the policy rate shift the yield curve up or down, most strongly at the short end. A hawkish surprise can push 2-year yields up more than 30-year yields in the same session.
Inflation and Growth
Fixed coupons lose purchasing power when inflation runs hot, so investors demand higher yields to hold them. Strong growth data can push yields up both through inflation expectations and through expectations of tighter policy.
Supply and Demand for Bonds
The RBA frames bond prices with a supply-and-demand view. More demand for a bond raises its price and lowers its yield. More supply, such as a government borrowing more, lowers the price and raises the yield. If extra issuance is concentrated in one maturity, say 10-year bonds, that part of the curve can rise relative to the rest.
Credit Ratings and Default Risk
A corporate bond's yield includes compensation for the chance the issuer does not pay. Investor.gov notes that high-yield bonds carry lower credit ratings and therefore offer higher interest rates for the extra risk. If an issuer is downgraded, buyers demand a higher yield and the bond's price falls, even if Treasury yields have not moved.
Liquidity
Bonds that are harder to trade usually need a higher yield to attract buyers. Investor.gov lists liquidity risk as the risk that you cannot find a market for a bond when you want to sell.
Bond Yields and Currencies
Bond yields and exchange rates often move together. Higher yields in one country, compared with others, can attract foreign capital and support that currency. The RBA describes the reverse: a reduction in interest rates compared with the rest of the world typically results in a lower exchange rate. That is why currency futures traders watch yield spreads between countries, though plenty of other forces move currencies too.
Treasury Yields and the Bond Yield Curve
U.S. Treasury yields are the benchmark for the dollar bond market. Treasuries carry the full faith and credit of the U.S. government, so their yields act as the base rate that other bonds price off, with extra yield added for credit and liquidity risk.
Treasury notes mature in 2, 3, 5, 7 or 10 years and Treasury bonds in 20 or 30 years, and both pay interest every six months. Treasury bills mature in a year or less and are sold at a discount to face value instead of paying a coupon.
The yield curve plots Treasury yields across those maturities on a single day. As of November 4, 2026, the U.S. Treasury's daily par yield curve showed:
| Treasury maturity | Yield as of November 4, 2026 |
|---|---|
| 3-month | 4.21% |
| 2-year | 4.58% |
| 10-year | 4.90% |
| 30-year | 5.28% |
That is an upward-sloping, or "normal," curve: longer maturities yield more. The gap between the 10-year and 2-year yields was 0.32 percentage points that day.
Yield Curve Shapes and Steepening
The RBA describes three basic shapes:
- Normal: longer maturities yield more, often seen in expansions when investors expect rates to rise.
- Inverted: short maturities yield more than long ones, which in the U.S. has historically tended to come before economic contractions.
- Flat: short and long yields are similar, often during a transition between the other two.
A steepening yield curve means the gap between long-term and short-term yields is widening. That can happen because long yields rise faster than short yields (often tied to inflation worries or heavy long-term issuance) or because short yields fall faster than long yields (often tied to expected rate cuts). A flattening curve is the opposite. Either way, the slope tells you the move was not the same across maturities, which matters if you are watching a specific point on the curve.
Reading Bond Yield Moves on a Futures Chart
Bond futures are quoted in price, not yield, so the inverse rule shows up directly on the chart. When yields rise, bond futures prices fall. When yields fall, bond futures prices rise. Euro-Bund futures, for example, are priced off a notional German government bond with a 6% coupon and a contract value of EUR 100,000, and they trade in price terms just like the bonds behind them.
The translation from yield to futures price is not one-for-one. Each contract tracks a basket of deliverable bonds, so the cheapest-to-deliver bond, conversion factors and delivery timing all affect how the futures price responds. Longer-maturity contracts move more for the same yield change, for the same duration reasons that apply to cash bonds.
Rate moves also spill into other futures. Equity index and gold futures can react sharply when yields jump, because yields feed into discount rates, borrowing costs and the dollar. The reaction is not fixed, though, so a trader needs the reason for the yield move, not just its direction.
A Checklist for Reading a Bond Price and Yield Move
- Name the instrument: an individual Treasury, a corporate bond, a bond fund or a futures contract. They do not share the same cash flows or risks.
- Identify the yield: current yield, YTM, yield to worst or a benchmark Treasury yield.
- Match the maturity: a 2-year yield and a 30-year bond price answer different questions.
- Check the direction: a rising required yield should go with a falling price for the same fixed-rate bond.
- Estimate the size with duration, then allow for convexity and call features.
- Name the driver: policy expectations, inflation, supply, credit or liquidity.
- Check the curve: did yields move together, or did the curve steepen or flatten?
The list exists because "rates are up" sounds like analysis and is not. Which rate moved, at what maturity, and why investors changed the yield they require is what turns a headline into context.
Treasury vs. EUREX Bond Futures on Prop Accounts
On our accounts, U.S. Treasury futures and other CME and CBOT interest-rate futures are not on the supported product list. The rate futures we do list are the EUREX German government bond futures (Euro-Bund FGBL, Bobl FGBM, Schatz FGBS and Buxl FGBX), available on Tradovate accounts only with an extra EUREX data subscription bought from Tradovate. Every position is closed by 4:45 PM ET on regular days, so any bond futures trade on our accounts is intraday, and funded accounts are simulated.
Common Mistakes With Bond Prices and Yields
Treating the Coupon Rate as the Bond's Yield
The coupon is fixed by contract. The yield depends on the price you pay. They match only when the bond trades at par.
Ignoring Maturity and Duration
Two bonds can see the same yield change and very different price moves. With an illustrative 4% coupon and a 1-point yield rise, a 2-year bond drops under 2% while a 30-year bond drops more than 15%. Check maturity and duration before judging what a yield move means for a position.
Assuming Yield to Maturity Is a Guaranteed Return
YTM assumes on-time payments, reinvestment at the same rate and holding to maturity. Sell early, reinvest at a different rate or face a default, and your return will differ.
Believing Government Bonds Cannot Lose Value
A government guarantee covers interest and principal, not the market price. The SEC bulletin calls this a common misconception: Treasuries carry interest rate risk like any fixed-rate bond.
Assuming a Higher Yield Is Always Better
A higher yield can be compensation for a longer maturity, weaker credit, poor liquidity or a call feature. Compare yields only across bonds with similar risk and maturity.
Treating a Bond Fund Like a Single Bond
An individual bond held to maturity returns face value if the issuer pays. A bond fund keeps rolling its holdings and has no maturity date, so it does not pull back to a fixed price the way a single bond does.
Reading Every Yield Move as a Central Bank Decision
Policy expectations matter, but inflation, supply, credit and liquidity move yields too. The price change tells you a repricing happened. It does not tell you why.
Bond Prices vs. Yields FAQ
When yields go up, what happens to bond prices?
Prices of existing fixed-rate bonds go down. Their coupons are fixed, so the price has to fall until a new buyer earns the higher yield. Longer-maturity and lower-coupon bonds fall the most.
What is the difference between a coupon rate and a yield to maturity?
The coupon rate is the fixed annual interest the bond pays as a percentage of face value. Yield to maturity is the total annual return implied by today's price, including coupons and any gain or loss back to face value. They are equal only when the bond trades at par.
What is the difference between a bond's face value and its market value?
Face value is the principal the issuer repays at maturity, commonly $1,000 per bond. Market value is what the bond trades for today. It sits above face value when the coupon beats current yields and below it when the coupon falls short.
What is a steepening yield curve?
A steepening yield curve means long-term yields are rising relative to short-term yields, so the gap between them widens. It can come from long yields rising faster or from short yields falling faster.
Can a bond lose value if you hold it to maturity?
Yes, its market price can fall at any point before maturity. If the issuer makes every payment, a plain bond held to maturity still repays face value. Inflation and the higher returns available elsewhere can still make it a weaker investment than it looked at purchase.
Why do bond prices rise when yields fall?
An existing bond's fixed coupon becomes more attractive when new bonds pay less. Buyers bid its price up until its yield matches the lower market yield.
This guide is for education only and is not investment or trading advice; bond prices can fall, issuers can default, and yield to maturity and duration rest on assumptions that may not hold. Bond and other futures use leverage, so losses can build quickly and exceed what you expect, and funded and evaluation accounts are simulated, so results can differ from live trading.


