




TL;DR: How to research a stock comes down to one decision: reject the idea, watch it, or research further. Read the 10-K's Items 1, 1A, 7 and 8 and the latest 10-Q before any commentary. Check growth, margins, cash flow, debt and dilution per share. Test P/E, PEG and EV/EBITDA against the growth the price already assumes. Finish with a one-page brief that names the evidence that would prove you wrong.
Most people researching a stock start with a ticker someone mentioned and a question that sounds simple: is this a good buy? Learning how to research a stock means replacing that question with a process that can return "no" or "not yet" just as easily as "yes."
This guide walks through that process from the first filing to a written decision. It covers where reliable information lives, how to read a 10-K, which numbers matter, how valuation ratios work, how to judge management and competitive strength, and how to turn all of it into a one-page brief. A fictional company is carried through the full process so you can see the arithmetic and the judgment calls together.
What Stock Research Is Meant to Answer
Stock research is not the hunt for a persuasive reason to buy. It is a way of answering five harder questions about one company and its stock:
- What does the company do, and how does it make money?
- Is the business improving, weakening, or simply riding an industry cycle?
- What financial risks could limit its choices?
- What expectations are already built into the stock price?
- What new evidence would change your conclusion?
The last question is the one people skip. Conviction turns into attachment quickly, usually around the time you start checking the price every hour. If your notes contain only evidence for the idea, you have written a sales pitch, not research.
Your time horizon changes which evidence matters most. Someone holding a stock for several years cares most about competitive position, reinvestment, cash generation and valuation. A shorter-term trader leans harder on earnings dates, guidance, market expectations, price behavior and liquidity. Both still need to understand the business underneath the ticker. The difference is how fast the thesis has to play out and how much a single quarter can move it.
How to Research a Stock Step by Step
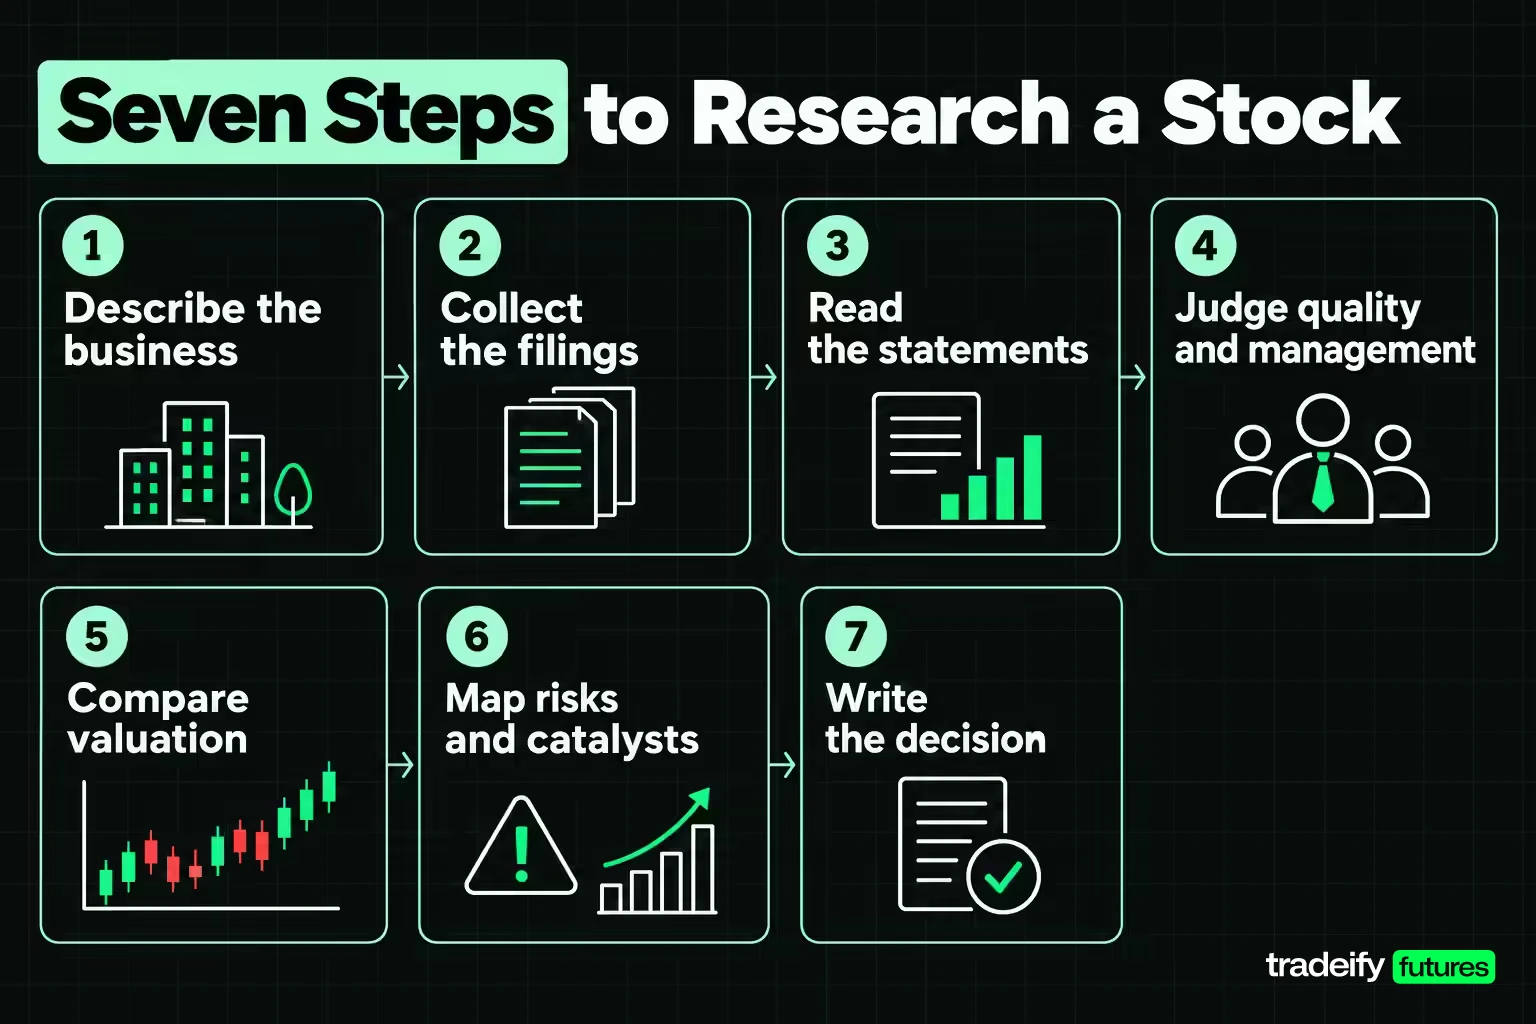
A repeatable stock research process keeps you from skipping the uncomfortable steps when you already like the idea. The seven steps below run from first look to written decision. Each one produces something you can write down.
- Describe the business in plain English. Write two sentences on what the company sells, who pays for it, and what makes demand rise or fall. If you cannot do this after reading the 10-K's Item 1 "Business" section, stop here. A ticker is not a business model.
- Collect the primary filings. Pull the latest 10-K, the most recent 10-Q, the latest earnings release, the proxy statement and any recent 8-K reports. Commentary comes later.
- Read the financial statements as one system. Track three to five years of revenue, margins, operating cash flow, capital spending, debt and diluted share count.
- Judge business quality and management. Look for measurable signs of a competitive advantage, check how management has spent capital, and read what executives are paid to achieve.
- Compare valuation with expectations. Work out what growth and profitability the current price assumes, then decide whether the evidence supports it.
- Map risks, catalysts and the chart. List the risks that could break the thesis, the dated events that could test it, and the trading conditions that affect execution.
- Write the decision. Produce a one-page brief that ends in reject, watchlist or research further, with an invalidation condition and a review date.
How long a first stock research pass takes
A first pass on a company you already know might take an hour or two. An unfamiliar business, a bank, or a company with complex segments can take far longer. Time spent is not the quality measure. A first pass is finished when you can explain the business, name the key financial trend and the biggest risk, say what the price assumes, and decide whether more work is justified.
Where to Find Stock Research Information
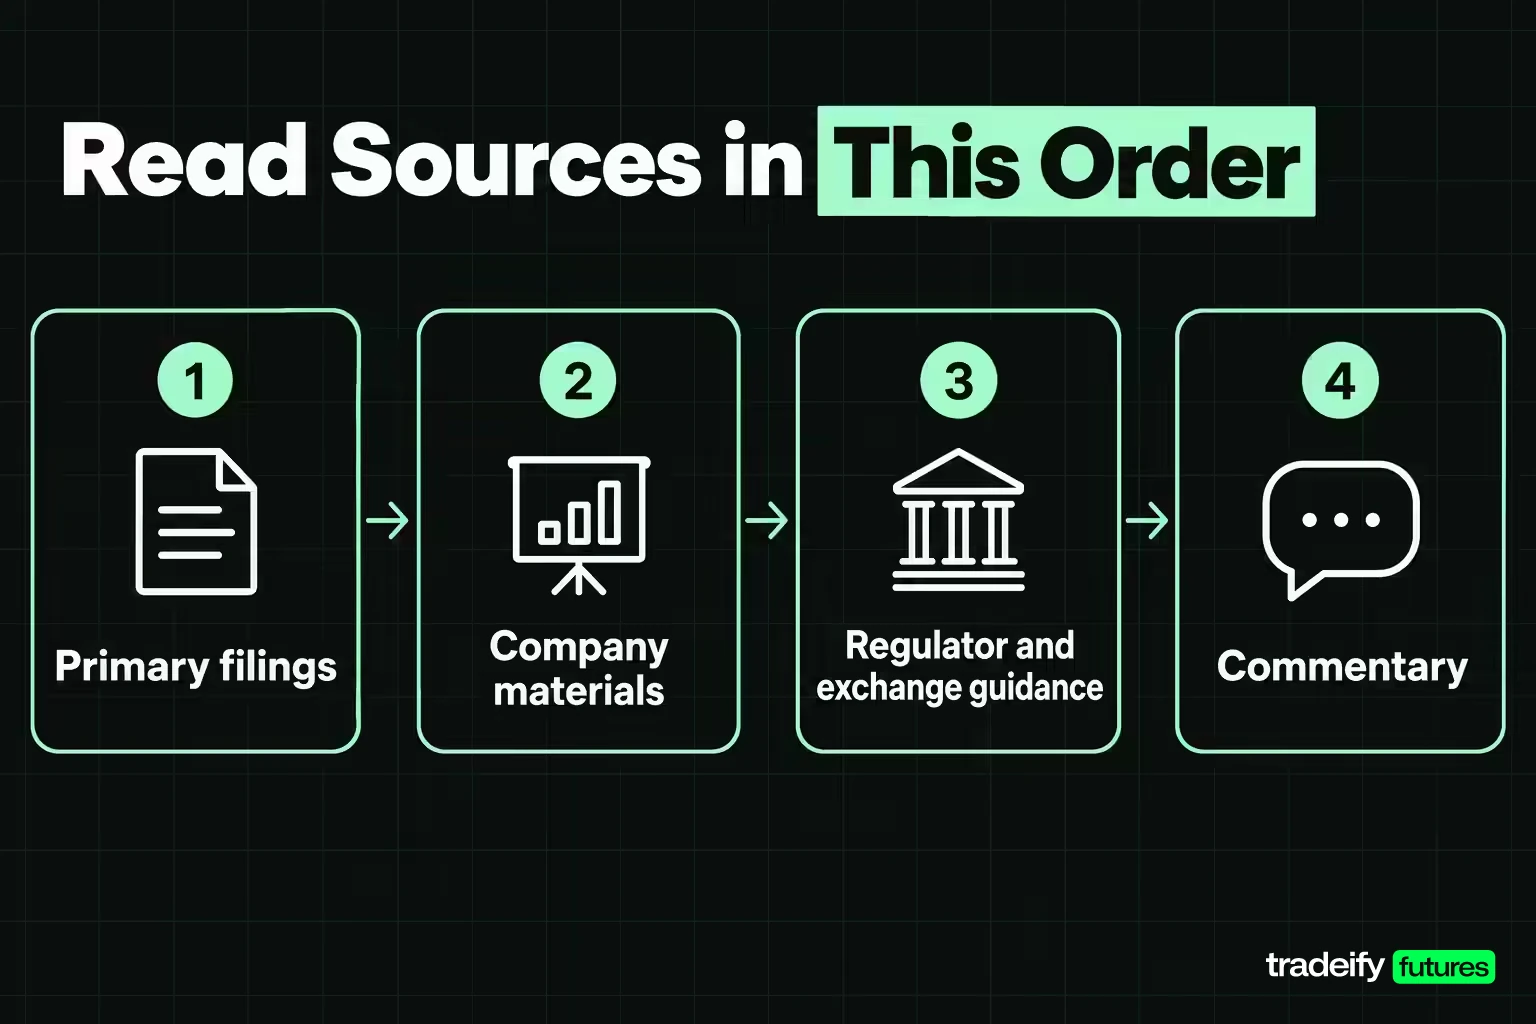
Stock research sources are not equal, so it helps to read them in a fixed order: primary filings first, company materials second, regulator and exchange guidance next, and commentary last. Commentary can point you toward a question. A filing should settle what the company actually reported.
SEC filings on EDGAR
Every 10-K and 10-Q filed with the SEC is public on the SEC's EDGAR database, and most companies also post them on their own investor relations pages. EDGAR's full-text search covers the text of electronic filings since 2001, including exhibits, and lets you search by keyword, ticker, company name or CIK number. That makes it useful for questions like "when did this company first mention a supply problem?"
| Filing | What it tells you | When it arrives |
|---|---|---|
| Form 10-K | Annual business description, risk factors, MD&A and audited financial statements | 60, 75 or 90 days after fiscal year end, depending on filer size |
| Form 10-Q | Unaudited quarterly financials and updates | 40 or 45 days after each of the first three fiscal quarters |
| Form 8-K | Current report on major events such as deals, leadership changes or earnings releases | Generally within four business days of the event |
| Proxy statement | Executive pay, board, ownership and shareholder votes | Ahead of the annual meeting |
| Form 4 | Insider purchases and sales | Before the end of the second business day after the trade |
| Form 13F | Quarterly holdings of managers with $100 million or more in covered securities | Within 45 days after quarter end |
Insiders, in the SEC's definition, are officers, directors and holders of more than 10% of a class of the company's securities. Their Form 4 filings show when people who know the business best bought or sold. A 13F tells you what large institutions held at quarter end, which is useful context but already weeks old when it is published.
Company materials and earnings calls
The investor relations page usually carries the earnings release, slide presentations and a replay or transcript of the earnings call. The release gives you the quickest snapshot. The call is where analysts push on the numbers, and the questions management answers vaguely are often more informative than the prepared remarks. Treat the slides as the company's own framing of its results, not as a neutral summary.
Analyst research, financial press and social media
Brokerage firms, especially full-service firms, publish analyst research, and independent research and consensus estimates are available too, some free and some paid. FINRA requires research from registered broker-dealers to disclose conflicts of interest clearly. Analysis posted on social media or forums carries no such protection, and FINRA warns that posts can be used to spread false information to move a stock's price, especially small and micro-cap names.
Financial press is good for learning what the market is talking about. It is a weak source for the numbers themselves, so check any material figure against the filing before it goes in your notes.
How to Read a Company's 10-K and Financial Statements
The 10-K is the single most useful document in stock research because SEC rules require it to follow a set order of topics, and its financial statements are audited. The 10-Q is shorter and unaudited, filed after the first, second and third fiscal quarters. One caution from the SEC itself: it does not vouch for the accuracy of a 10-K. The company's CEO and CFO certify it, and the SEC staff reviews filings, but the reader still has to think.
Which 10-K sections to read first
You do not need to read a 10-K front to back on the first pass. These items carry most of the research value:
- Item 1, Business. Products, services, markets, competition, regulation and seasonality. The SEC's own guide calls it a good place to start.
- Item 1A, Risk Factors. The most significant risks, generally listed in order of importance. Compare this year's list with last year's. A risk copied word for word is often boilerplate; a new paragraph about a customer, lender or regulator deserves attention.
- Item 7, MD&A. Management's explanation of results, liquidity, capital resources, known trends and critical accounting judgments. Compare what management promised a year ago with what it now reports.
- Item 7A, Market Risk. Exposure to interest rates, currencies, commodity prices and equity prices.
- Item 8, Financial Statements. The audited income statement, balance sheet, cash flow statement and statement of stockholders' equity, plus the notes and the auditor's report.
- Item 9, Changes in and Disagreements with Accountants. Many investors treat any disclosure here as a red flag.
Executive pay sits in Item 11, but most companies provide it in the separate proxy statement and incorporate it by reference.
Auditor opinions and non-GAAP numbers
Most auditor's reports give an "unqualified opinion" that the statements fairly present the company's position under GAAP. A "qualified opinion" or a "disclaimer of opinion" means something stopped the auditor from saying that, and you should find out what. Disclosed material weaknesses in internal controls deserve the same scrutiny.
Companies may also report non-GAAP measures such as adjusted earnings or EBITDA. They are allowed, but the filing must show how each one differs from the closest GAAP figure. Read that reconciliation. If the adjustments remove a cost that shows up every single year, the "adjusted" number is flattering the business.
How the three financial statements connect
The income statement shows sales and expenses over a period. The balance sheet shows assets, liabilities and equity at one point in time. The cash flow statement explains how cash actually moved. The practical work is connecting them.
A company can report rising profit while operating cash flow falls, because customers are paying slowly, inventory is piling up, or profit includes items that never become cash. When profit and cash disagree for several periods in a row, the balance sheet usually shows why: receivables or inventory growing faster than sales.
Fundamental Analysis of the Stock's Business
Fundamental analysis of a stock means judging the business's financial health and earning power from its reported numbers. Start with a three-to-five-year table and record:
- revenue growth;
- gross and operating margins;
- operating income and net income;
- cash from operations;
- capital spending and free cash flow;
- cash, total debt and near-term maturities; and
- diluted share count.
Ask what produced the growth
Percentage growth on its own says little. Revenue can rise because the company sold more units, raised prices, bought another business, or benefited from currency moves. Those paths do not carry the same durability. A price increase that sticks says something about pricing power. Growth bought through acquisitions says more about the balance sheet than about demand.
Margins need the same treatment. Falling margins may reflect a planned product launch or a temporary change in sales mix. They may also show a company that can no longer pass on its costs. Your job is to separate a temporary cost from a structural change, then write down what future result would confirm which one it is.
Cash flow, debt and dilution
Cash flow is where an optimistic story meets its funding needs. A profitable company can still burn cash if capital spending climbs or working capital swells. Look at when debt matures relative to when the company expects big investments to pay off. A maturity that lands before the payoff forces a refinancing on whatever terms the market offers that year.
Dilution is the number people tend to miss. When the diluted share count grows, each existing share owns a smaller slice of the company. If a business grows revenue 25% over three years while the share count rises 9%, revenue per share grew only about 14.7% (1.25 divided by 1.09, minus one). The company got bigger faster than each shareholder's claim did.
One quarter rarely settles anything. Look for the direction, the reason, and the next data point that would confirm or contradict your reading.
Judging a Company's Quality, Moat and Management
Company quality is what decides whether good past numbers can continue. Financial statements tell you what happened. Quality factors tell you how hard it would be for a competitor to take it away.
Evidence of a competitive moat
Do not award a company a moat because management uses the word in its slides. Look for the measurable consequence of one:
- margins that hold up through a weak year;
- customers who renew or repurchase at high rates;
- the ability to raise prices without losing volume;
- lower customer acquisition costs than rivals; or
- returns on invested capital that stay high over several years.
Sources of an advantage include switching costs, cost advantages from scale, trusted brands, patents, regulatory approvals, distribution reach and network effects. Each one should show up somewhere in the numbers. If it does not, treat it as a claim.
Capital allocation and incentives
Management quality is easiest to judge by what executives did with the company's money over several years. Did they reinvest in projects that earned good returns, buy businesses at sensible prices, pay down debt, repurchase shares at reasonable valuations, or issue new shares again and again? None of those choices is always right. The question is whether each one improved the business per share.
The proxy statement shows what executives are rewarded for. A bonus tied only to revenue can encourage growth at any cost. A plan built on several measures, including per-share results and returns on capital, usually lines up better with shareholders, but read the definitions and exclusions before you give it credit.
Reading insider transactions
Form 4 filings show insider buying and selling within two business days. Selling is common and often routine: executives diversify, pay taxes, or sell under pre-planned schedules. Open-market buying with personal money is rarer and tells you more. Even then, treat insider activity as one clue, not a verdict.
Stock Valuation Metrics That Matter
Valuation is the bridge between the business you researched and the stock price on the screen today. A strong company can be a poor purchase at an extreme price, and a low multiple can be a warning rather than a bargain.
These are the stock valuation metrics most research starts with:
- Market capitalization: share price multiplied by shares outstanding. It is the market's current price tag on the equity.
- Earnings per share (EPS): earnings divided by shares outstanding, which lets you compare companies of different sizes.
- Price-to-earnings (P/E): share price divided by EPS. FINRA's plain version: a company with a P/E of 25 costs more per dollar of earnings than one with a P/E of 20.
- PEG ratio: P/E divided by the expected earnings growth rate. Published PEGs differ because sources use one-year, three-year or five-year growth estimates.
- Price-to-sales (P/S): market capitalization divided by revenue. It works for companies without profits, but ignores margins completely.
- EV/EBITDA: enterprise value (market cap plus debt minus cash) divided by earnings before interest, taxes, depreciation and amortization. EBITDA is not a GAAP measure and leaves out capital costs, so it can make capital-heavy companies look cheaper than they are.
- Free cash flow yield: free cash flow divided by market capitalization.
- Debt-to-equity (D/E): total liabilities divided by shareholder equity.
Valuation metrics in a worked example
The table uses round illustrative numbers for a fictional company: a $20 share price, 100 million shares, $1 billion of revenue, $80 million of net income, $120 million of operating income, $40 million of depreciation and amortization, $500 million of debt, $100 million of cash, $90 million of free cash flow, and expected EPS growth of 15%.
| Metric | Calculation | Result |
|---|---|---|
| Market cap | $20 x 100 million shares | $2 billion |
| EPS | $80 million / 100 million shares | $0.80 |
| P/E | $20 / $0.80 | 25 |
| PEG | 25 / 15 | 1.7 |
| P/S | $2 billion / $1 billion | 2.0 |
| EV/EBITDA | $2.4 billion / $160 million | 15 |
| Free cash flow yield | $90 million / $2 billion | 4.5% |
What a stock's price assumes about growth
The most useful valuation question is not "is a P/E of 25 high?" It is "what has to happen for 25 to be reasonable?" At 15% expected earnings growth, the PEG is about 1.7. If growth comes in at 8% instead, the same price produces a PEG of about 3.1. Nothing changed in the stock price. The assumption under it did.
Compare a company's valuation three ways: against its own history, against genuinely comparable companies, and against the growth and profitability needed to justify the price. FINRA notes that average ratios vary widely by industry, so a bank, a young software company and a cyclical manufacturer should not be judged on one identical ratio. If small changes in growth or margin assumptions flip your conclusion, the idea has very little room for error.
Industry and Market Trends Around a Stock
Industry and market conditions can move a stock regardless of what the company reports. A strong company in a shrinking industry is fighting the current. An average company in a sector with rising demand can look better than it is for a while.
Three checks keep this short. First, where is the industry in its cycle: are prices, volumes and margins across competitors rising or falling? Second, is competition intensifying, through new entrants, price cuts or substitutes? Third, which macro forces hit this business directly? The 10-K's Item 7A lists the company's own exposure to interest rates, currencies, commodities and equity prices, which tells you which headlines matter for this particular stock.
Using a Stock Chart After the Fundamentals
A stock chart answers a different question from the filings. The filings ask what the business is worth. The chart shows how the market is currently pricing and trading it. Technical analysis is most useful here as timing and risk context, not as the thesis.
Look at the trend over the time frame you plan to hold, the price areas where buying or selling has repeatedly shown up (support and resistance), and whether volume confirms a move or fades. Check liquidity too: thinly traded stocks can have wide spreads and gap hard on news. Earnings dates matter, because a stock can open far from the prior close after a report, past any stop order you placed.
The trap is reading the chart first and then collecting facts that agree with it. A stock that has already run makes every bullish detail in the filing look more convincing than it is. A rising chart does not make a business better, and a falling one does not make it worse. The business and the stock are connected, but they move on different clocks.
Screening Stocks and Building a Watchlist
A stock screener narrows thousands of listed companies to a short list you can actually research. The useful filters come from your own criteria: industry, market capitalization, profitability, revenue growth, debt levels, valuation ranges or dividend history. A screen built from criteria you understand gives you candidates. A screen built from someone else's "best stocks" list gives you their biases.
Treat a screen result as a starting point, not a conclusion. Every ratio a screener shows comes from a data provider's calculation, and those can differ from the filing. Before a stock moves from screen to watchlist, confirm the key numbers in the 10-K.
A watchlist works best when each entry carries three notes: why the stock is there, what would make you act, and when you will review it. Without those, a watchlist becomes a list of tickers you once found interesting.
A Worked Stock Research Example
This stock research example follows a fictional company, Northstar Components, through the process. The figures are illustrative and chosen for clean arithmetic.
At first glance Northstar looks like a strong business. Revenue grew from $800 million to $1 billion over three years, operating margin rose from 10% to 12%, and annual free cash flow reached $90 million.
The next layer changes the conclusion. One customer now makes up 38% of revenue. Diluted shares rose 9% over the same three years. And $300 million of debt matures within two years, while management plans a new factory that will absorb most of next year's expected operating cash flow.
| Finding | Reading |
|---|---|
| Revenue growth of 25% | Real growth, but per-share revenue grew only about 14.7% after dilution |
| Margin up two percentage points | An improvement of two points, not a 20% jump |
| Free cash flow of $90 million | Positive, but needed for both the factory and the debt |
| One customer at 38% of revenue | A single renewal can swing the whole thesis |
| $300 million maturing within two years | Refinancing lands before the factory pays off |
The arithmetic matters because true numbers can still mislead. Revenue growth of 25% comes from $1 billion divided by $800 million, minus one. The margin change from 10% to 12% is two percentage points. Describing it as a 20% margin improvement would be technically defensible and practically misleading.
Writing the Northstar stock research brief
The brief for Northstar should separate the evidence instead of compressing it into "strong growth":
- Supporting facts: revenue up 25% over three years, operating margin up two points, positive free cash flow.
- Counterevidence: high customer concentration, dilution that cut per-share growth, debt maturing before the expansion pays off.
- Key assumption: the large customer renews and the factory contributes before refinancing gets expensive.
- Invalidation: loss of the customer, more material dilution, or project delays that leave cash generation short of the debt.
- Decision: watchlist until the customer renewal and the financing plan are clear.
No single ratio settles Northstar. Growth, margins, cash flow, concentration, dilution and debt interact, and the decision comes from how they fit together.
Deciding Whether a Stock Is Worth Buying

Deciding whether a stock is worth buying is the point where all the research has to fit on one page. If the conclusion needs twenty pages, the decision has not been made yet.
The one-page stock research brief
Use the same headings every time so you cannot quietly skip the uncomfortable ones:
- Business in two sentences
- Three facts supporting the thesis
- Three facts against the thesis
- Financial trend
- Balance-sheet constraint
- Valuation range and key assumptions
- Near-term catalysts with dates
- Biggest unknown
- Invalidation condition
- Next evidence and review date
- Decision: reject, watchlist or research further
"Buy" is not one of the automatic outputs. The first round of research earns the right to do more work. A reject decision is a good result when it keeps your attention and capital away from a stock you cannot explain or value.
Stock research red flags
A red flag is a prompt to investigate, not an automatic verdict. The useful ones are specific enough to check:
- Reported profit rises while operating cash flow falls for several periods.
- Growth comes mainly from acquisitions but is presented as organic demand.
- The diluted share count rises faster than business value per share.
- Adjusted measures exclude the same "one-time" costs every year.
- One customer, supplier, lender or market dominates results.
- Debt matures before a major investment is expected to pay off.
- The auditor issued a qualified opinion, or the company changed accountants after a disagreement.
- Guidance gets cut repeatedly after confident early forecasts.
- The valuation needs growth well above the company's history and its peers.
- The thesis has no written condition that would prove it wrong.
Writing the invalidation condition
An invalidation condition is a specific, observable event that would make you drop the idea: "the top customer does not renew," "free cash flow stays negative for four more quarters," "the company issues shares to fund the factory." Write it before you act. Once money is on the line, explaining away bad news gets much easier than admitting the thesis broke, and a condition written in advance takes that argument off the table.
Matching Stock Research to Your Strategy
Stock research only tells you about the company. Whether that stock belongs in your portfolio depends on your goals, time horizon and tolerance for losses. FINRA makes the same point: evaluate each stock as part of your overall portfolio and asset allocation, not on its own.
A few questions connect the research to the decision:
- Time horizon. If you need the money in two years, a thesis that depends on a factory paying off in four does not fit, however good the company is.
- Position size. How much of your portfolio would this stock be, and what happens to the whole portfolio if it falls by half? Concentration risk applies to your holdings just as it applies to a company's customer list.
- Overlap. If you already own several companies exposed to the same industry or the same economic driver, another one adds less diversification than it seems.
- Style. Income-focused, growth-focused and value-focused investors weight the same research differently. A dividend investor cares most about payout coverage and balance-sheet strength. A growth investor cares more about reinvestment returns and market size.
A good company can still be the wrong stock for you. That is a strategy decision, not a research failure.
Common Stock Research Mistakes
Stock research mistakes tend to repeat, and most of them come from letting the conclusion arrive before the evidence.
- Starting with the chart. Reading price action first and then collecting business facts to justify an opinion you already hold. Reverse the order: business, expectations, then the chart for timing.
- Comparing false peers. Two companies with the same industry label can have very different customers, contract lengths, capital needs and stock-based pay. A peer group only works when the economics match.
- Treating a forecast as a fact. Keep reported numbers, management guidance, analyst estimates and your own assumptions in separate columns. When they blur, confidence rises faster than evidence.
- Confusing more information with better research. Ten summaries of the same earnings call do not equal one reading of the filing.
- Never scheduling a review. A thesis written once and never revisited goes stale. Set the next review around the evidence that matters: an earnings report, a refinancing, a contract renewal or a regulatory decision.
Free Stock Research Tools, Books and Practice
Stock research gets faster with practice, and most of the best resources are free primary sources.
- SEC and Investor.gov. Investor.gov's "How to Read a 10-K/10-Q" bulletin explains every 10-K item in plain language. EDGAR company search and full-text search give you every filing.
- FINRA. FINRA's "Evaluating Stocks" page covers the key questions and ratios, and its Market Data and Investments Explorer shows company profiles, key ratios and valuation information for free.
- Company materials. Earnings call transcripts and investor presentations show how management explains results. Reading two or three years of them for one company teaches you more than skimming fifty.
- Books. Benjamin Graham's "The Intelligent Investor" remains a standard introduction to valuation discipline and margin of safety. Reading a company's 10-K alongside any book turns theory into practice.
- A practice routine. Pick one company you already know as a customer, write the one-page brief, then reread it after the next 10-Q and mark every fact or assumption that changed.
How stock research carries over to index futures
Many traders who research stocks also follow equity index futures, and the skills transfer. Earnings season, guidance from the largest index members and sector trends all feed into how the S&P 500, Nasdaq-100, Dow and Russell 2000 trade. The research tells you why the index is moving; it does not replace a trading plan or risk limits on the futures side.
At Tradeify, we don't offer cash stocks, options or single stock futures. Our accounts trade equity index futures such as ES, NQ, YM and RTY and their micros (MES, MNQ, MYM and M2K), and every position has to be closed by 4:45 PM ET, so earnings research shows up as context for the session rather than a stock you hold. Our funded accounts are simulated.
Stock Research FAQ
How long does it take to research a stock?
A first pass on a familiar company can take an hour or two, while a complex or unfamiliar business can take days. The finish line is not a time limit. You are done with the first pass when you can explain the business, its main risk and what the price assumes.
Should I research the company or the stock chart first?
Research the company first when you are judging the business. Use the chart afterward for entry, exit and risk planning. They answer different questions, so neither replaces the other.
Who owns 88% of the stock market?
As of the second quarter of 2026, the latest Federal Reserve Distributional Financial Accounts data, the wealthiest 10% of US households held 88.1% of household-held corporate equities and mutual fund shares. The top 1% alone held 50.9%, and the bottom half of households held 0.6%. The figure covers household holdings and excludes stocks held through defined contribution pensions.
How much dividend stock do I need to make $3,000 a month?
You would need about $900,000 at a 4% dividend yield, because $3,000 a month is $36,000 a year. At a 3% yield the figure rises to about $1,200,000, and at 6% it falls to about $600,000. Those are pre-tax figures, dividends can be cut, and very high yields often signal that the market doubts the payout.
What is the 10/5/3 rule of investment?
The 10/5/3 rule is a rule of thumb that stocks return about 10% a year over the long run, bonds about 5% and cash about 3%. NYU Stern's Damodaran data for 1928 to 2025 shows compound annual returns of about 10.0% for the S&P 500 with dividends, 4.5% for 10-year Treasury bonds and 3.4% for 3-month Treasury bills. Those are long-run averages, and any single decade can look very different.
What are the 7 types of stocks?
The seven types most often listed are common stock, preferred stock, growth stocks, value stocks, dividend or income stocks, blue-chip stocks and penny stocks, though no official list exists. Stocks are also grouped by company size (large, mid and small cap) and by how they behave in the economic cycle (cyclical or defensive). One stock can belong to several categories at once.
Can stock research prevent losses?
No. Research can reduce avoidable mistakes and define what would invalidate a thesis, but it cannot remove market risk, surprise events, price gaps or the chance that a reasonable conclusion is wrong.
Stocks can lose value, past returns do not guarantee future results, and the company examples in this guide are fictional and illustrative. Futures and leveraged products can lose money faster than expected, funded prop accounts are simulated, and this guide is general education, not investment, legal or tax advice.


