




TL;DR: Option gamma measures how much an option's delta changes for a $1 move in the underlying. A 0.06 gamma lifts a 0.50 delta to about 0.56 after a $1 rally. Option gamma peaks at the money and near expiry, from 0.055 at 30 days to 0.305 on the last day. Long options are long gamma; short options are short gamma, so their exposure grows against the move.
Option gamma is the Greek that explains why the delta you saw at entry rarely stays put. Delta tells you how much an option's price may move when the underlying moves. Gamma tells you how quickly that delta itself will shift.
That matters most when price is sitting near a strike and expiration is close. A position that looked like modest directional exposure in the morning can behave like a much larger one by the afternoon, without a single new order being placed. Nothing about the contract changed. Its sensitivity did.
Below is what option gamma measures, how it is calculated, where it peaks, how long and short gamma behave, and how traders keep it from surprising them. Every number comes from an illustrative example you can reproduce in any standard pricing model, so you can check the work instead of taking it on trust.
What Is Option Gamma
Option gamma is the expected change in an option's delta for a one-unit move in the underlying, with every other pricing input held constant. For a stock option, that unit is $1. The Options Industry Council (OIC) puts it simply: how delta is expected to change given a $1 move in the underlying is called gamma.
In OIC's own example, a gamma of 0.150 means delta rises or falls by about 0.150 when the underlying moves up or down $1. The council adds that results will usually not be exact, which is worth remembering every time you use the number.
Mathematically, delta is the first derivative of the option's value with respect to the underlying price. Gamma is the second derivative. If delta is the speed of the option's price, gamma is the acceleration.
In plain terms:
- Delta describes how directional the option is right now.
- Gamma describes how unstable that directional reading is.
- Higher gamma means delta can change quickly as price moves.
- Lower gamma means delta stays close to where it is.
Two more points finish the definition, and both come up constantly in practice. Long calls and long puts always carry positive gamma, while short calls and short puts carry negative gamma. And shares of the underlying stock have no gamma at all, because their delta is fixed at 1.00 for a long position or -1.00 for a short one.
How Gamma Changes an Option's Delta
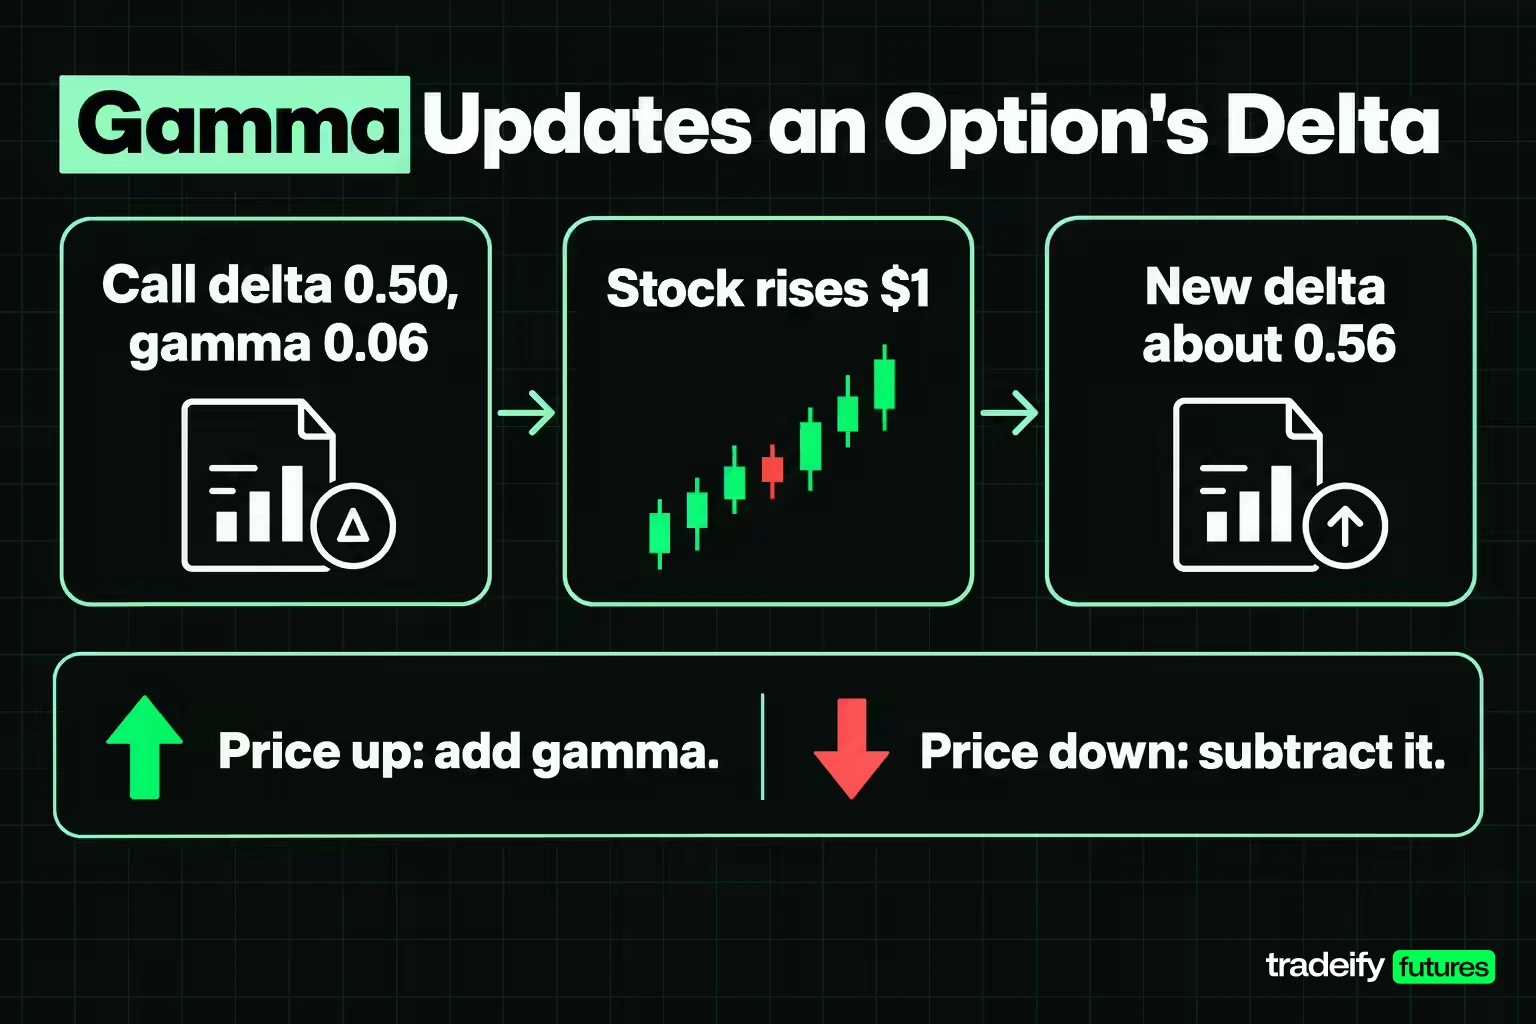
Option gamma's job is to update delta. The rule is mechanical: when the underlying rises $1, add gamma to a call's delta; when it falls $1, subtract it.
The OIC works through a hypothetical $50 stock. A $50 call trades at $2, with a delta of 0.50 and a gamma of 0.06. If the stock rises to $51, delta suggests the call should be worth about $2.50. Gamma suggests the new delta is about 0.56 (0.50 + 0.06).
Two more of the council's examples show the same arithmetic in both directions:
- A call with a delta of 0.54 and a gamma of 0.04. The stock rises $1, and the new delta is about 0.58.
- A call with a delta of 0.75 and a gamma of 0.03. The stock falls $1, and the new delta is about 0.72.
Why delta moves toward 1.00 or 0
Delta has hard limits. Call deltas run from 0 to 1.00, and put deltas run from 0 to -1.00. Option gamma is what carries delta toward those limits.
As a call goes deeper in the money, its delta approaches 1.00, because the option is behaving more and more like the stock itself. As it moves further out of the money, delta drifts toward 0. Gamma shrinks at both ends because delta has nowhere left to go.
Here is the practical reading. Gamma tells you which way your exposure will drift if price keeps going, and how fast it gets there. For a long call, rising prices make you more long. Falling prices make you less long. The option adjusts in your favor on both sides, which is the whole appeal of owning gamma.
Why Option Gamma Matters to Traders
Option gamma matters because it turns a static risk number into a moving one. Three practical problems follow from that.
Your position size changes without an order
Delta is often read as share-equivalent exposure. A call with a delta of 0.53 on a 100-share contract behaves like about 53 shares for small moves. With gamma of 0.055, a $3 rally lifts that delta toward 0.69, so the same contract now behaves like roughly 69 shares.
You never added to the trade. The market did it for you. On a long option that is welcome. On a short option it means exposure grows against you just as the move is hurting.
Hedges go stale
A trader who hedged delta at entry is only hedged for that moment, because option gamma keeps moving the target. Once price moves, gamma changes delta, and the hedge stops matching. The bigger the gamma, the sooner the hedge needs attention.
This is where traders get caught near expiration. The OIC notes that gamma can become extremely high with the underlying at the strike and expiration approaching, because delta may swing from 1.00 toward 0, or the reverse, as price crosses the strike.
Losses can accelerate on short options
For an option seller, negative gamma means each further move in the wrong direction costs more than the last. Ten short at-the-money calls on an illustrative $100 stock, each with a gamma of 0.055 and a 100-share multiplier, carry about -55 shares of exposure change for every $1 the stock rallies. The loss curve bends the wrong way.
None of this makes gamma a signal. It tells you nothing about direction. It tells you how much your exposure will change once direction shows up, which is a different question and an easy one to blur when a chain lights up.
How Option Gamma Is Calculated
Option gamma is calculated by a pricing model. Most option chains use a version of the Black-Scholes model, which Fischer Black, Myron Scholes and Robert Merton published in 1973. Its inputs are the underlying price, strike price, time to expiration, implied volatility, interest rates and dividends.
For a non-dividend-paying underlying, the Black-Scholes gamma is:
- Gamma = N′(d1) ÷ (S × σ × √T)
- d1 = [ln(S ÷ K) + (r + σ² ÷ 2) × T] ÷ (σ × √T)
Here S is the underlying price, K the strike, σ the implied volatility, T the time to expiration in years, r the risk-free rate, and N′ the standard normal density.
Three things fall straight out of the formula:
- Calls and puts with the same strike and expiration have the same gamma.
- Gamma has S × σ × √T underneath it, so short time and low volatility push it up.
- N′(d1) is largest when d1 is near zero, which happens close to the money.
Gamma calculation example
Take an illustrative $100 stock, a $100 strike, 30 days to expiration, 25% implied volatility and a 4% rate. The formula gives the call a value of about $3.02, a delta of 0.53 and a gamma of 0.0555. The matching put has a delta of -0.47 and the same 0.0555 gamma.
You can check any chain's gamma the same way a model does it. Reprice the option a cent above and a cent below the current underlying price, take the change in the two slopes, and divide by the step. For this option, that finite-difference estimate also comes out at 0.0555.
Why chains show different gamma values
The OIC notes that Black-Scholes is not the only method. American-style equity options are typically priced with a binomial model because of the early-exercise feature. Different brokers also use different volatility inputs and day counts.
So two platforms can show slightly different option gamma for the same contract. The differences are usually small, but they are a reminder that gamma is a model output, not a market price.
Option Gamma by Strike Price
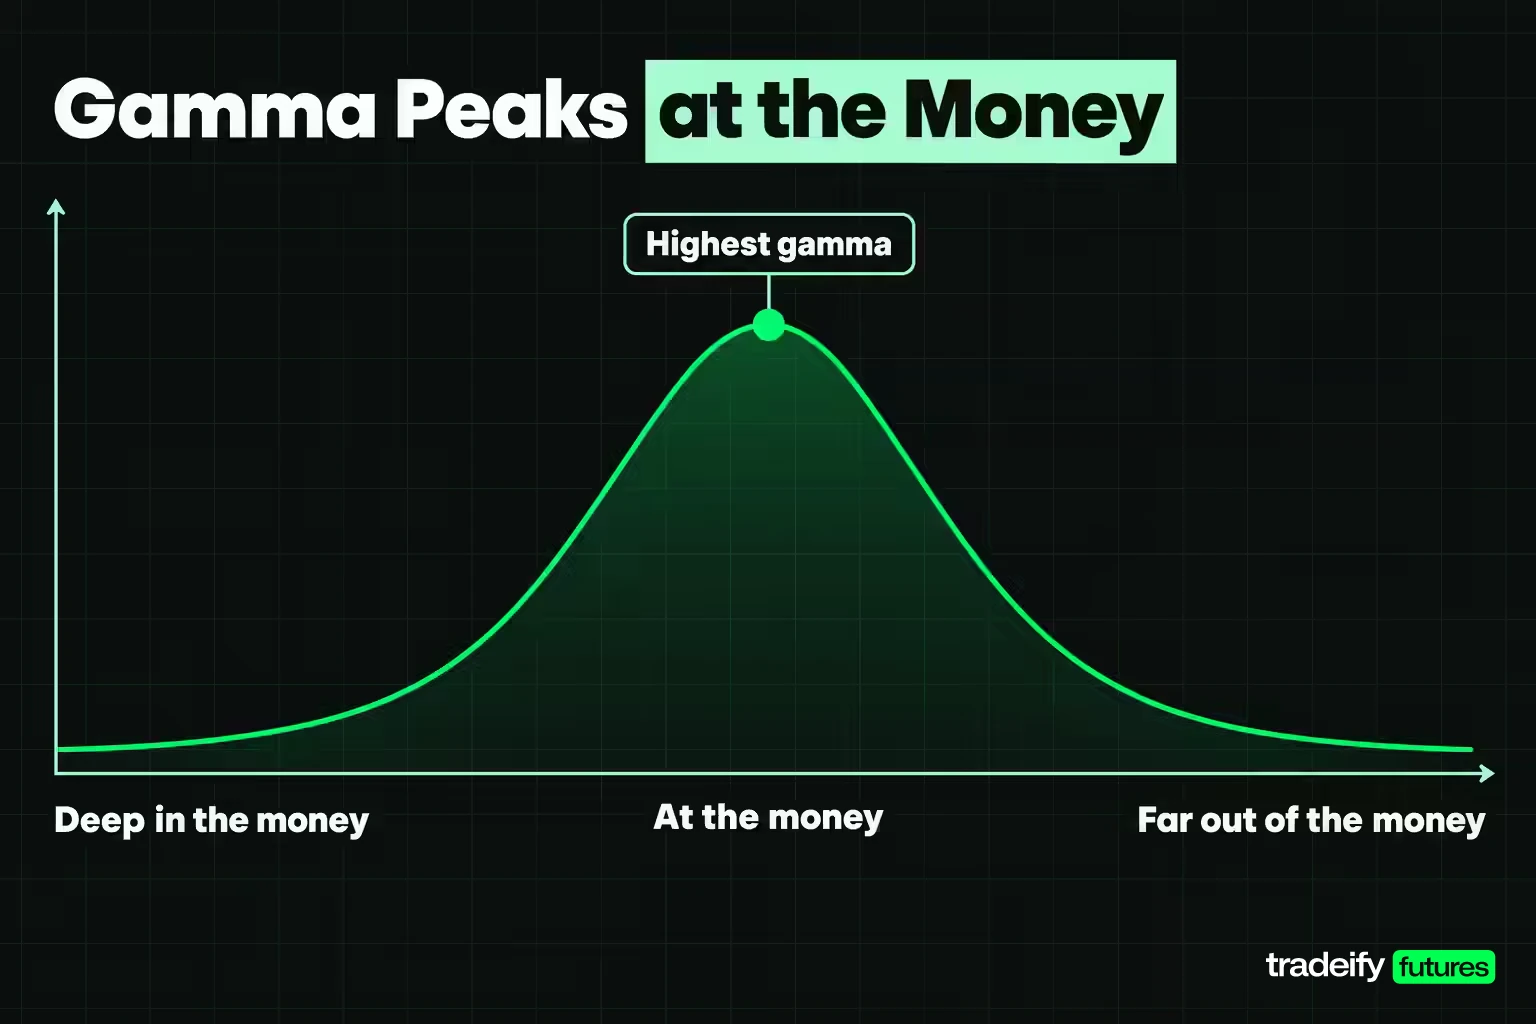
Option gamma is highest for at-the-money options and falls away for strikes deeper in or further out of the money. The strike table shows why, using the same illustrative $100 stock with 30 days to expiration and 25% implied volatility.
| Call strike | Moneyness | Delta | Gamma |
|---|---|---|---|
| $85 | Deep in the money | 0.99 | 0.004 |
| $90 | In the money | 0.94 | 0.017 |
| $95 | Slightly in the money | 0.79 | 0.041 |
| $100 | At the money | 0.53 | 0.055 |
| $105 | Slightly out of the money | 0.27 | 0.047 |
| $110 | Out of the money | 0.11 | 0.026 |
| $115 | Far out of the money | 0.03 | 0.010 |
Why at-the-money options have the highest gamma
An at-the-money option sits on the line between finishing in the money and finishing worthless. A small move in either direction changes the odds a lot, so delta responds sharply. The OIC puts the peak where delta sits roughly between 0.40 and 0.60.
The deep in-the-money $85 call already has a delta of 0.99. It cannot get much more stock-like, so gamma is close to zero. The far out-of-the-money $115 call has so little chance of finishing in the money that a $1 move barely changes it.
Gamma rises as price approaches a strike
Option gamma is not tied to the contract. It is tied to where price sits relative to the strike, so it changes as the underlying moves.
The OIC's example: with a stock at $30, a $25 call has a delta of about 0.85 and a gamma of 0.03. If the stock slides toward $25, that call drifts toward at the money and its gamma rises, to around 0.09 in the council's estimate. A trader who sized off the original 0.03 gamma would underestimate how fast delta changes on the way down.
That is the real decision in strike selection. An at-the-money strike buys or sells the most gamma the chain offers. A strike further away buys or sells less of it. Pick the strike for the exposure you want to carry, not only for the premium.
Key Characteristics of Option Gamma
Option gamma follows a consistent set of rules across underlyings. Knowing them lets you predict roughly what a chain will show before you look.
- Long options, calls and puts alike, have positive gamma. Short options have negative gamma.
- A call and a put with the same strike and expiration have the same gamma.
- Gamma peaks near the money and shrinks toward zero for deep in-the-money and far out-of-the-money strikes.
- At-the-money gamma rises as expiration approaches.
- Lower implied volatility concentrates gamma near the strike; higher implied volatility spreads it out.
- Stock and futures positions have no gamma, because their delta does not change.
Gamma near expiration
At-the-money option gamma climbs steeply as expiration approaches, while gamma on strikes away from the money collapses. The time table uses the same illustrative $100 stock and 25% implied volatility.
| Days to expiration | $100 call delta | $100 call gamma | $105 call gamma | $100 call theta per day |
|---|---|---|---|---|
| 180 | 0.58 | 0.022 | 0.023 | -$0.025 |
| 90 | 0.56 | 0.032 | 0.031 | -$0.033 |
| 30 | 0.53 | 0.055 | 0.047 | -$0.053 |
| 7 | 0.52 | 0.115 | 0.045 | -$0.104 |
| 1 | 0.51 | 0.305 | 0.0003 | -$0.266 |
Read the at-the-money column from top to bottom. Gamma rises from 0.022 with 180 days left to 0.305 with one day left, nearly 14 times higher. A $1 move one day before expiration shifts delta by about 0.30, enough to turn a coin-flip option into a near-certain one in a few dollars.
Now read the $105 column. With one day left and price $5 away, gamma is effectively zero because the option will almost certainly expire worthless. The OIC makes the same point about LEAPS: a front-month at-the-money option has more gamma than a long-dated option on the same strike, because the near-term delta has to resolve toward 0 or 1.00 soon.
The theta column is the cost of that gamma. The at-the-money option that carries 0.305 gamma on its last day also loses about $0.27 a day to time decay.
Gamma and implied volatility
Implied volatility changes the shape of option gamma across strikes. The OIC notes that as implied volatility falls, at-the-money gamma increases. Low volatility means the market expects small moves, so delta has to switch quickly when price does reach the strike.
| Implied volatility | $90 call gamma | $100 call gamma | $110 call gamma |
|---|---|---|---|
| 15% | 0.004 | 0.092 | 0.010 |
| 25% | 0.017 | 0.055 | 0.026 |
| 50% | 0.020 | 0.028 | 0.024 |
At 15% implied volatility, at-the-money gamma is 0.092 and the $10 wings barely register. At 50%, at-the-money gamma drops to 0.028 and the curve flattens out, so the in-the-money and out-of-the-money strikes carry nearly as much. Higher volatility spreads gamma across more strikes. A volatility drop after a news event can therefore raise your at-the-money gamma even if price never moves.
Option Gamma Among the Greeks
Option gamma is one of five Greeks most chains display. Each measures sensitivity to a different input, and the OIC defines them this way:
| Greek | Measures sensitivity to | Typical quote |
|---|---|---|
| Delta | Underlying price | Change in premium per $1 move |
| Gamma | Change in delta | Change in delta per $1 move |
| Theta | Time | Change in premium per day |
| Vega | Implied volatility | Change in premium per 1% change in implied volatility |
| Rho | Interest rates | Change in premium per 1% change in rates |
Option gamma is the only one in that table that measures a change in another Greek rather than in the option's price. That makes it the Greek that tells you how reliable your delta reading is.
The gamma and theta tradeoff
Gamma and theta are two sides of the same position. Long options have positive gamma and usually negative theta. Short options collect theta and carry negative gamma.
The Black-Scholes pricing equation makes that link exact for a delta-hedged option: theta plus one half of σ² × S² × gamma, plus the interest-rate terms, sums to zero. For the illustrative $100 call with 30 days left, the gamma term is worth about $0.047 a day against a theta of -$0.053. The gap is the interest-rate terms.
Put plainly, the buyer pays theta every day for the chance to benefit from movement. The seller is paid theta to accept that movement can hurt. Neither side gets gamma for free, and a strategy that seems to is usually hiding the bill somewhere.
Gamma, vega and delta together
Vega and gamma interact as well. The OIC notes that changes in implied volatility can change delta and gamma, not just the premium. A trader can read direction correctly, collect the delta, and still lose if volatility drops at the same time.
Related lesson: How the option Greeks work together
A Worked Option Gamma Example
The worked example shows how far option gamma improves a delta-only estimate, and where it starts to break. It uses the illustrative $100 call from earlier: 30 days to expiration, 25% implied volatility, a 4% rate, a premium of about $3.02, a delta of 0.533 and a gamma of 0.0555. A standard equity option covers 100 shares, so per-contract dollars are 100 times the per-share figures.
There are two estimates:
- Delta only: change in option price ≈ delta × move.
- Delta plus gamma: change in option price ≈ delta × move + 0.5 × gamma × move².
The third column reprices the option in the full model at the new stock price, which is the closest thing to the answer.
| Stock move | Delta-only estimate | Delta plus gamma estimate | Full model change | Full model change per contract |
|---|---|---|---|---|
| +$1 | $0.53 | $0.56 | $0.56 | $56 |
| +$3 | $1.60 | $1.85 | $1.84 | $184 |
| +$5 | $2.67 | $3.36 | $3.31 | $331 |
| +$10 | $5.33 | $8.11 | $7.60 | $760 |
| -$3 | -$1.60 | -$1.35 | -$1.35 | -$135 |
| -$5 | -$2.67 | -$1.97 | -$1.97 | -$197 |
Delta-only vs gamma-adjusted estimates
For a $3 rally, delta alone says the call gains $1.60 per share. Gamma adds $0.25, and the full model says $1.84. The delta-only estimate misses about $24 per contract, and the gamma term recovers nearly all of it.
The downside shows the same curvature working for the owner. A $3 drop costs $1.35 per share, not the $1.60 delta implies, because delta shrinks as the stock falls. Gains run faster than losses for the same size of move. That asymmetry is positive gamma.
Where the gamma estimate breaks down
On a $10 move, the delta-plus-gamma estimate overshoots: $8.11 per share against a model value of $7.60. The new-delta estimate tells the same story. Adding 10 × 0.0555 to 0.533 gives 1.09, which is impossible for a call. The model says delta is actually 0.92.
The reason is that gamma is not constant. By the time the stock reaches $110, this option's gamma has fallen from 0.055 to about 0.019. The local estimate assumes gamma stays at its starting value the whole way.
The working rule is simple. Use delta plus gamma for small moves. For anything large, reprice in a model or read the chain again.
Long Gamma vs Short Gamma
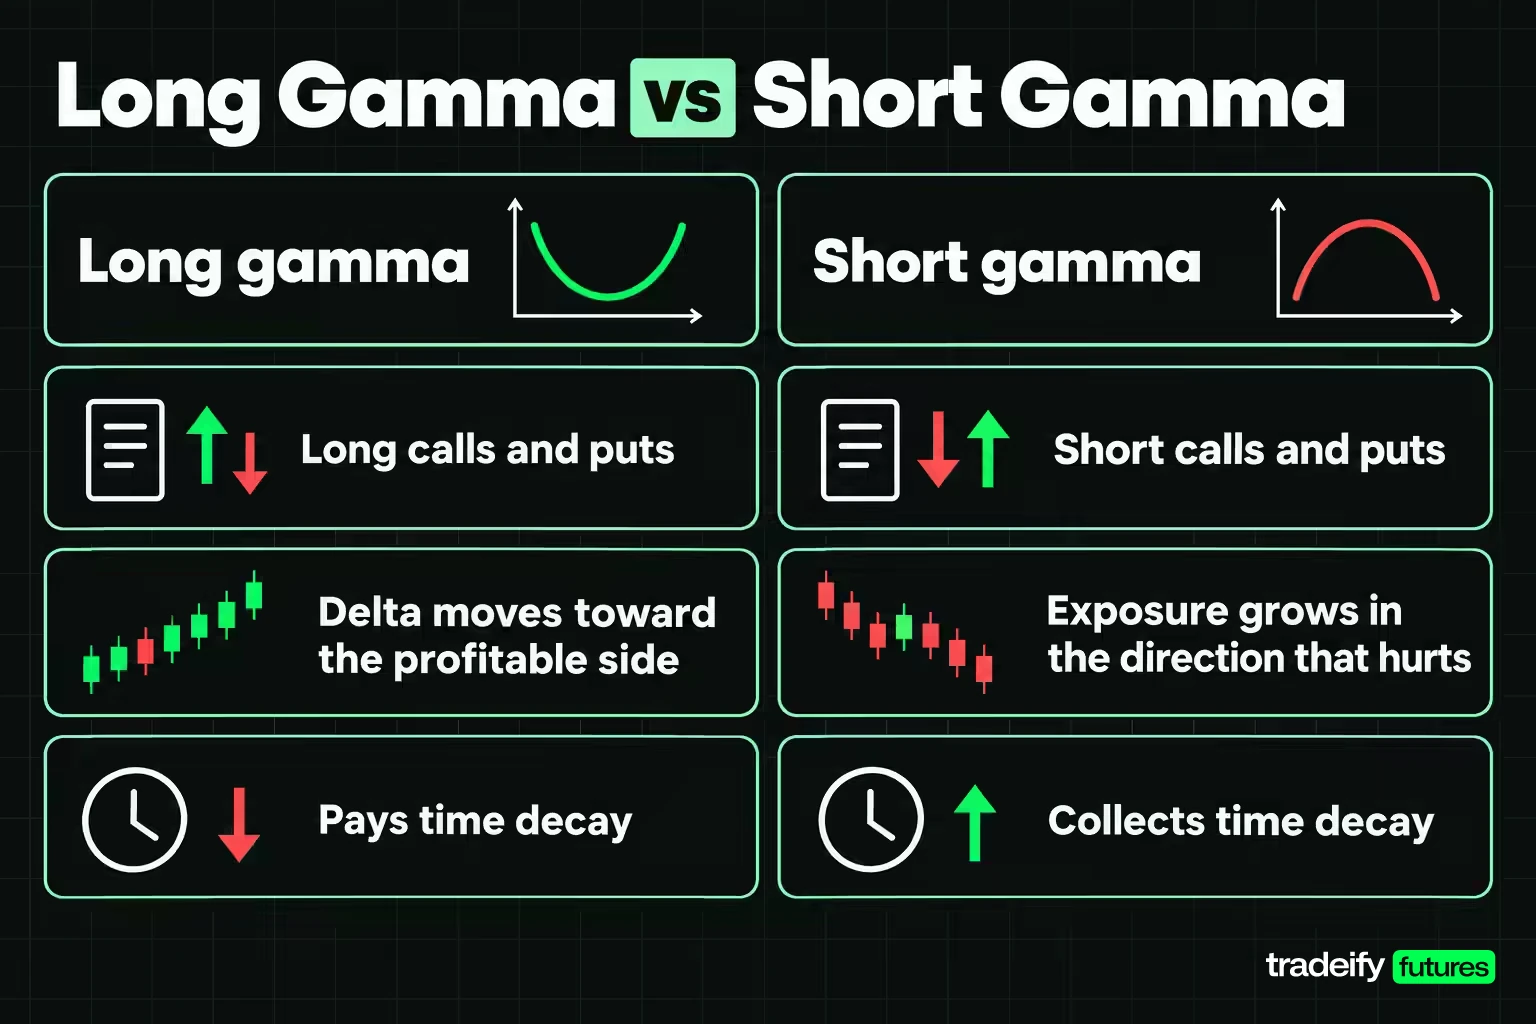
Long gamma and short gamma are mirror images. Which side you hold decides whether price movement helps or hurts your exposure.
| Position | Gamma sign | Delta as price rises | Delta as price falls |
|---|---|---|---|
| Long call | Positive | Rises toward 1.00 | Falls toward 0 |
| Long put | Positive | Moves toward 0 | Moves toward -1.00 |
| Short call | Negative | Becomes more negative | Becomes less negative |
| Short put | Negative | Becomes less positive | Becomes more positive |
How long gamma behaves
A long gamma position gets longer as price rises and shorter as price falls. The OIC describes it this way for long calls and long puts: delta moves toward the side that profits from the move.
The cost is premium and time decay. A long option needs the underlying to move enough, soon enough, to beat theta. A quiet market with a big gamma position is usually a slow loss.
How short gamma behaves
A short gamma position does the opposite. The OIC notes that for a short call, delta becomes more negative as the stock rises and less negative as it drops. Exposure grows in the direction that hurts.
The reward is theta. Short options collect time decay every day the market sits still. The failure mode is a large, fast move, especially near expiration, when gamma is highest. The OIC also notes that a short call's potential loss is theoretically unlimited.
Long or short gamma is not a question of better or worse. Ask what the position needs the market to do, what you paid or collected for that view, and how much exposure can change before you are able to react.
Gamma Hedging and Delta Rebalancing
Gamma hedging means managing option gamma itself: how fast delta changes, not just where delta sits today. A delta hedge alone only covers the next small move. Gamma decides how often the hedge has to be redone.
A delta-hedged short gamma example
Take a trader who sells 10 of the illustrative $100 calls (1,000 shares of exposure) and hedges with stock. With a delta of 0.533, the short calls behave like about -533 shares, so the trader buys about 533 shares to get flat. Position gamma is about -55 shares per $1.
Now follow both directions:
- The stock rises $3. Call delta rises to about 0.69, so the short calls now behave like -689 shares. Net exposure is about -156 shares, and the trader has to buy about 156 more shares near $103 to get flat again.
- The stock falls $3. Call delta drops to about 0.37, so the short calls behave like -366 shares. Net exposure is about +167 shares, and the trader has to sell about 167 shares near $97.
Short gamma forces you to buy after prices rise and sell after they fall. Every round trip costs money, and that cost is what the collected theta is meant to pay for. Long gamma does the opposite: the rebalancing trades sell into strength and buy into weakness, which is why some traders call it gamma scalping.
Neutralizing gamma with other options
Stock cannot fix gamma, because stock has none. To reduce gamma itself, a trader adds options with the opposite gamma sign, such as buying a different strike or expiration against a short position. The usual sequence is to set gamma first with options, then flatten delta with the underlying.
Rebalancing is not free. Commissions, bid-ask spreads and price gaps between hedges all eat into the result, and a gap through the strike can move delta further than any hedge schedule anticipated.
Managing Gamma Risk
Option gamma risk is the risk that your delta changes faster than your plan. Most gamma mistakes come from reading one Greek in isolation.
Common gamma mistakes
- Treating high gamma as a buy signal. High gamma says delta will move quickly if price moves. It says nothing about whether price will move, or which way.
- Comparing raw gamma across underlyings. A gamma of 0.05 on a $100 stock and 0.0014 on an index future are not comparable without the price and contract multiplier. Compare the change in dollar exposure for the same percentage move.
- Using one snapshot for a large move. The local estimate overshoots once gamma itself starts changing.
- Ignoring the calendar. A short option that was comfortable at 30 days can carry several times the gamma in its final week.
- Forgetting the net position. One leg can be long gamma and another short. The decision belongs to the net number.
A gamma risk checklist
Before holding a gamma-sensitive position, write down:
- Net delta and net gamma now, in shares or contracts.
- Estimated delta after a defined up move and the same down move.
- Dollar exposure after applying the contract multiplier.
- Days to expiration and the distance from the nearest key strike.
- Premium paid or collected, maximum loss, and any assignment or exercise considerations.
- The exposure level that would make you reduce or close the position.
If you cannot say how your delta changes in both directions, slow down. The trade may still be fine, but the risk has not been turned into a plan yet. The OIC's caution applies here too: pricing models estimate, but market forces set actual premiums.
Gamma Exposure and Gamma Squeezes
Gamma exposure, often shortened to GEX, applies option gamma to a whole market rather than one position. It estimates how much dealers' combined delta would change for a given move in the underlying, based on the options they are thought to be long or short.
The theory behind a gamma squeeze comes from how dealers hedge options they have sold. When a dealer is short calls and hedged with stock, a rally raises the calls' delta, so the dealer has to buy more shares into the rally. The SEC staff's Staff Report on Equity and Options Market Structure Conditions in Early 2021, dated October 14, 2021, describes a gamma squeeze as market makers buying a stock to hedge the risk of call options they have written, which puts further upward pressure on the price. Heavy call buying is the main driver: as the stock rises, short-gamma dealers have to buy more shares.
The same report is a useful reality check. SEC staff did not find evidence of a gamma squeeze in GameStop (GME) during January 2021. Individual customers' GME options volume rose from $58.5 million on January 21 to $563.4 million on January 22, peaking at $2.4 billion on January 27. But that increase was driven mostly by put buying, and market makers were buying calls rather than writing them.
So treat gamma exposure figures with care. They are estimates built on assumptions about who holds which side. They can help explain why a move accelerates, but they are not proof that dealer hedging caused any particular move.
Option Gamma on Futures Options
Option gamma works the same way on options on futures, but the units change. On E-mini S&P 500 options, gamma is quoted per index point, delta is measured in futures contracts, and CME's rulebook values each index point at $50.00 per option contract.
Take an illustrative E-mini future at 6,000, a 30-day at-the-money option and 16% implied volatility. A Black-76 model, the futures version of Black-Scholes, gives a delta of 0.51 and a gamma of 0.0014 per point.
| E-mini move | Model delta | Delta-equivalent dollars per index point |
|---|---|---|
| No move | 0.51 | about $25 |
| +20 points | 0.54 | about $27 |
| +50 points | 0.58 | about $29 |
| -50 points | 0.44 | about $22 |
With 7 days left, that option's gamma roughly doubles to 0.0030, the same near-expiration effect a stock option shows.
Why raw futures option gamma looks small
A gamma of 0.0014 looks tiny next to 0.055 on the $100 stock option. It is not. A 1% move in the E-mini is 60 points, which shifts the option's delta by about 0.09. A 1% move in the $100 stock is $1, which shifts that option's delta by about 0.055. Measured per percentage move, the futures option's delta changes faster in this example. Raw gamma only compares like with like.
Option gamma for futures traders
A futures contract has no gamma. Like stock, its delta is fixed: one long E-mini contract is worth $50 per index point, whatever price does. That is why gamma matters to a futures trader mainly as market context, such as dealer hedging around heavily traded strikes near expiration.
We don't offer options of any kind on our accounts, so none of these Greeks apply to a position you hold with us. Our evaluations and Sim Funded accounts trade futures such as ES, NQ and their micros, with every position closed by 4:45 PM ET.
Option Gamma FAQ
Is high gamma good?
High gamma is good for a long option holder when the underlying moves enough, because delta adjusts in their favor. It is a problem for an option seller, because exposure grows against them. High gamma also usually comes with fast time decay, so judge the whole position rather than gamma alone.
Can gamma be negative?
Option gamma for a single long call or long put is always positive. Short calls and short puts have negative gamma. A multi-leg position can have positive, negative or near-zero net gamma, depending on its legs.
Which options have the highest gamma?
At-the-money options close to expiration have the highest option gamma. In the illustrative example, a $100 call on a $100 stock carries 0.055 gamma with 30 days left and 0.305 with one day left. Deep in-the-money and far out-of-the-money options have the lowest.
What is a good gamma value?
A good gamma value is one whose delta change fits your plan; no single number suits every trade. Gamma has to be read against the underlying's price, the contract multiplier, the time to expiration and the position size. Convert it to the change in dollar exposure for a move you consider realistic, then decide whether that change fits your plan.
Do puts have the same gamma as calls?
Yes, under standard pricing models a call and a put with the same strike and expiration have the same option gamma. The illustrative $100 call and $100 put both show 0.0555. Their deltas differ in sign, but delta changes at the same rate for both.
Using Option Gamma in Your Next Trade Plan
Option gamma is most useful as a short pre-trade exercise. Before your next options position, write down its delta and gamma, then estimate the new delta after a realistic move up and the same move down.
Convert both results into share or contract equivalents, and check the days to expiration and the distance to the nearest strike. If either estimated exposure is larger than you would choose to carry, change the strike, the expiration or the size before the trade, not after the move.
Options involve substantial risk and are not suitable for every investor. A long option can lose its entire premium, and some short option positions can lose far more than the premium collected. The Greeks and worked examples here are model estimates for education, not predictions or individual advice. Futures and other leveraged products can also produce losses larger than expected, and funded prop-firm accounts are simulated.


