



TL;DR: Volatility smile and skew describe how implied volatility changes across strikes for one expiration. A smile lifts both wings above the at-the-money strike; skew tilts one wing, like a 90 put at 28% versus 20% at the money. Stock index options have skewed toward puts since the October 1987 crash, a price for protection, not a forecast. Track level, slope (the 25-delta risk reversal) and curvature against the market's own history.
Two options on the same index, expiring the same day, can carry very different implied volatilities. A put 10% below the market might be priced at 28% while the at-the-money option sits at 20%. Nothing is broken. The options market is charging more for some outcomes than others, and it is showing you exactly where.
That pattern across strikes is what traders mean by the volatility smile and skew. Once you can read it, you stop calling an option "expensive" just because its implied volatility is high, you see why two spreads with the same width cost different amounts, and you get a live read on what the options market is paying for tail risk. That last part is useful even if you never trade an option.
What Volatility Smile and Skew Mean
Volatility smile and skew are two ways of describing the same chart. Take every option on one underlying with one expiration date, solve each price for its implied volatility, and plot implied volatility against strike. The line you get is the volatility curve.
- Flat curve. Every strike carries about the same implied volatility. This is what the textbook Black-Scholes model assumes, and real markets rarely show it.
- Volatility smile. Implied volatility is lowest near the at-the-money strike and rises toward both wings, forming a U.
- Volatility skew. One wing carries noticeably more implied volatility than the other, so the curve tilts.
- Volatility smirk. A lopsided smile: both wings rise, but one rises far more. Equity index options are the classic case.
CME Group's options education uses the same language. When put implied volatilities sit above call implied volatilities, CME calls it negative skew; when calls sit above puts, positive skew; and a roughly symmetrical curve with both wings raised is "the smile", which CME describes as positive convexity.
The key point is that a smile and a skew are not competing labels. Smile describes curvature (both wings versus the middle). Skew describes asymmetry (one wing versus the other). A single volatility curve can show both, and most real equity index curves do.
Implied Volatility Behind the Volatility Curve
Implied volatility is the raw material of every smile and skew. The Options Industry Council (OIC) defines it as a measure of how much the marketplace expects the asset price to move, based on the option's price. It is "the volatility that the market implies", as opposed to historical volatility, which measures how much the price actually moved.
The number comes out of a pricing model run backwards. In 1973 Fischer Black and Myron Scholes published what became the Black-Scholes formula, with Robert Merton developing the framework alongside them; Merton and Scholes received the 1997 economics prize for the work. The model takes the underlying price, strike, time to expiration, interest rate and volatility, and returns a theoretical option value. Every input except volatility is observable. So traders feed in the market price and solve for the volatility that makes the model match. That answer is implied volatility.
Here is the catch that creates the whole topic, and it is worth slowing down for. Black-Scholes assumes a single, constant volatility for the underlying. If the model were a perfect description of the market, every strike would solve to the same implied volatility and the curve would be flat. It isn't. OIC puts it plainly: the model "does not perfectly describe real-world options markets," and "market forces determine actual premiums, not formulas."
So when the 90 strike solves to 28% and the 100 strike solves to 20%, the market is not saying the underlying has two volatilities. It is saying the model's single-volatility assumption misprices the 90 strike unless you bump its volatility input. The smile and skew are the size and shape of those bumps.
What a Volatility Smile Looks Like
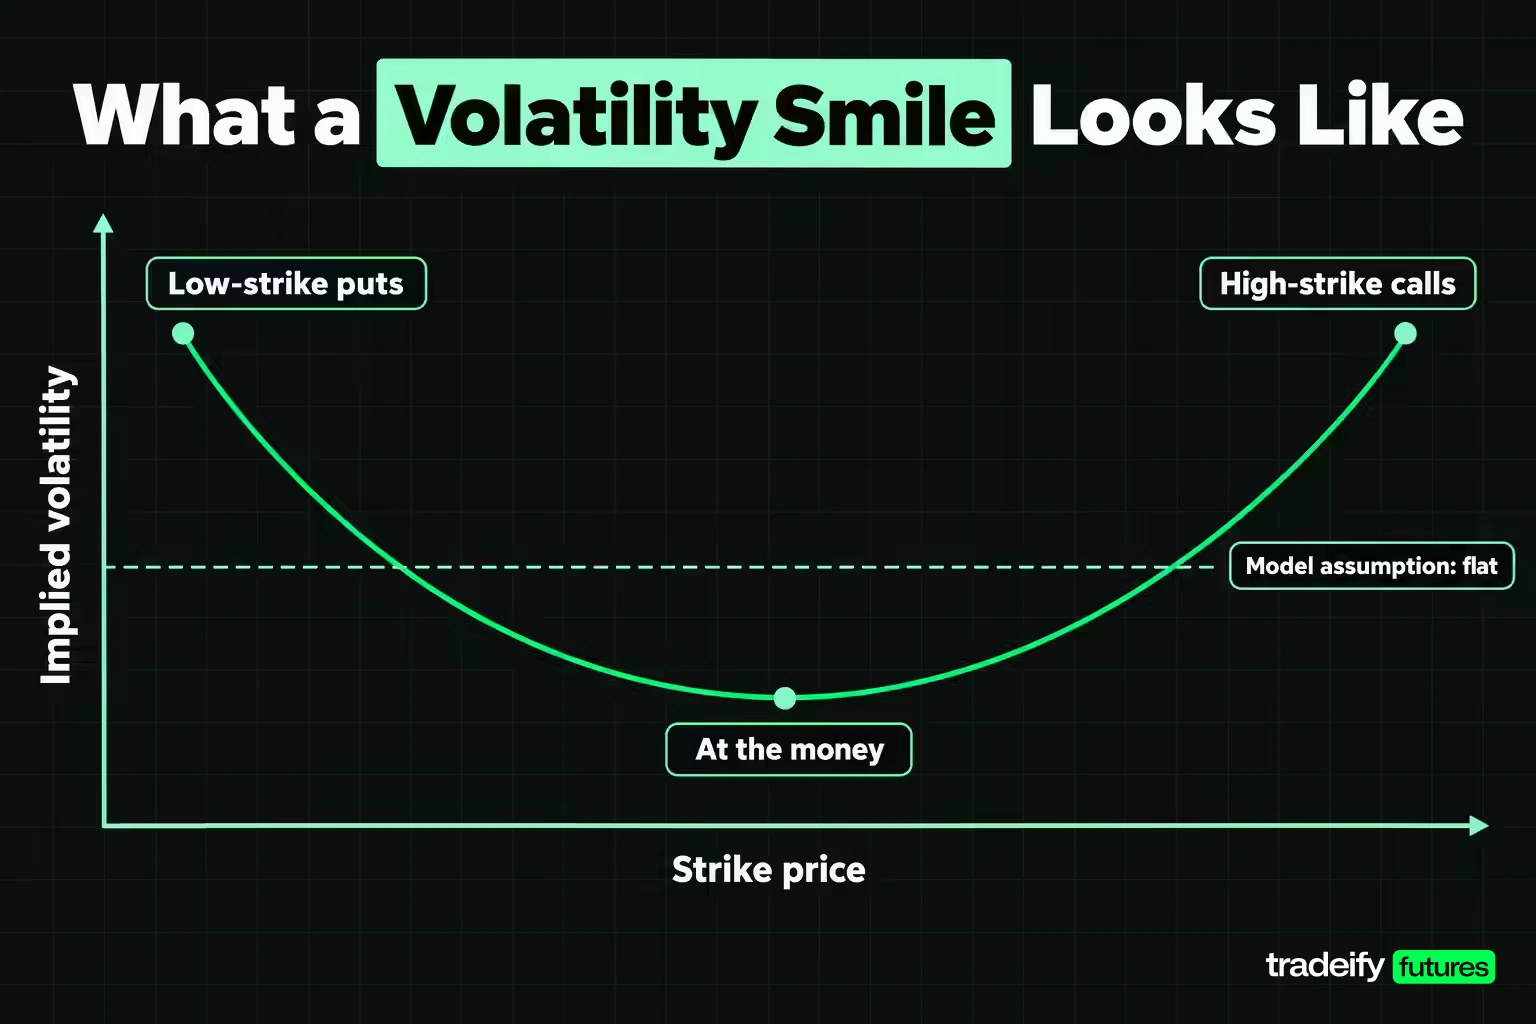
A volatility smile is a curve where implied volatility is lowest around the at-the-money strike and rises as you move out to both the low-strike puts and the high-strike calls. Plotted, it looks like a shallow U.
CME's convexity lesson describes the opposite case well: if the curve flattens to a straight line, Black-Scholes implied volatilities are equal at every strike and convexity is zero. A smile is the market refusing to accept that straight line.
Why the volatility smile exists
The main reason is fat tails. The Black-Scholes model treats returns as roughly bell-shaped, where very large moves are rare enough to ignore. Real markets jump. Cboe's SKEW white paper explains that jumps "fatten the weights of the tails," which means two- and three-standard-deviation moves happen more often than a normal distribution allows.
Far out-of-the-money options only pay off in those big moves. If big moves are more likely than the model assumes, the model underprices those wing options at the at-the-money volatility. Market makers who sell them know this, so they charge more, and the extra premium shows up as higher implied volatility on both wings.
Other forces add to the shape:
- Hedging demand. Investors buy far puts for protection and sometimes far calls for upside exposure, and that demand lifts wing prices.
- Jump and event risk. A pending court ruling, earnings report or policy decision can make a large move in either direction more plausible.
- Inventory risk. Dealers short far wings face losses that are hard to hedge when the market gaps, so they demand compensation.
A pure, symmetric smile is most often described in currency options, where a sharp move in either direction is a real risk. In equity index options the smile has largely tilted into a smirk, which is a different shape with a different story.
Strike Price Skew Across One Expiration
Strike price skew is the way implied volatility changes from one strike to the next within a single expiration. CME defines the collection of implied volatilities that share one expiration as the implied volatility curve. That "same expiration" condition is the most important rule in the topic, because mixing expirations blends strike skew with the volatility term structure and produces a chart that means nothing.
Consider an illustrative chain on an underlying trading at 100, all options expiring in 30 days. These are hypothetical numbers built for teaching, not live quotes.
| Strike | Position on the curve | Option used | Implied volatility |
|---|---|---|---|
| 90 | Far downside wing | Put | 28% |
| 95 | Near downside | Put | 24% |
| 100 | At the money | Call or put | 20% |
| 105 | Near upside | Call | 21% |
| 110 | Far upside wing | Call | 23% |
Implied volatility falls from the 90 strike to the 100 strike, then climbs again toward the 110 strike. It climbs on both sides, so there is smile-like curvature. It climbs much more on the low-strike side, so there is downside skew. That combination is a smirk.
Strike, moneyness or delta on the horizontal axis
You can plot strike price skew three common ways, and each answers a slightly different question.
- Raw strike. Simple and fine for one snapshot, but strikes drift in meaning as the underlying moves.
- Percent moneyness. Strike divided by the underlying (or its forward) price, so 90% always means "10% below the market". Cboe's SKEW white paper charts S&P 500 implied volatility this way.
- Delta. Options are matched by their delta, so a 25-delta put and a 25-delta call sit at similar odds of finishing in the money. This is the standard way to quote skew in currency options and in risk reversals.
Pick one and stick with it. Comparing today's 25-delta put with last week's 90 strike, after the underlying has moved 3%, is comparing two different options and calling it a change in skew.
Volatility Skew Between Puts and Calls
Volatility skew is the asymmetry between the downside and upside wings of the curve: which side carries more implied volatility, and by how much.
- Negative (downside or reverse) skew. Out-of-the-money puts carry higher implied volatility than equally distant calls. Typical of stock indexes and many individual stocks.
- Positive (upside or forward) skew. Out-of-the-money calls carry higher implied volatility than equally distant puts. CME research has documented this in gold and silver options in normal interest-rate regimes, and it often appears in commodities when supply shocks make sharp rallies the bigger risk.
The 25-delta risk reversal
The most common single number for volatility skew is the risk reversal. CME describes it as the difference in implied volatility between a put and a call with the same absolute delta or moneyness. For the 25-delta risk reversal, you find the 25-delta call and the 25-delta put and subtract their implied volatilities.
CME's own example uses a put at 70 volatility and a call at 45. The risk reversal is negative 25 vol points, and the curve is skewed to the downside. Traders use the figure to express the cost of downside protection versus upside exposure.
Why put-call parity keeps calls and puts on one curve
A beginner question that trips up a lot of people: if puts are "expensive", are calls at the same strike cheap? Put-call parity says no. OIC explains that the price of a call implies a fair price for the put with the same underlying, strike and expiration, and when the two drift apart an arbitrage opportunity appears.
For European-style options, parity ties the call minus the put to the underlying price minus the present value of the strike. In the illustrative 30-day chain with a 4% rate, the 100 strike call at 20% volatility is worth $2.45 and the put $2.12. The $0.33 gap equals 100 minus the present value of 100. At the 90 strike with 28% volatility, the call is worth $10.60, the put $0.31, and the $10.30 gap again equals the underlying minus the present value of 90.
The practical consequence is that a call and a put at the same strike and expiration share one implied volatility, give or take dividends, financing and American exercise features. Skew is a property of the strike, not of whether you happen to quote it with a put or a call. That is why the curve uses out-of-the-money puts on the left and out-of-the-money calls on the right: they are the liquid side of each strike, but both describe the same point.
The Volatility Smirk in Equity Index Options
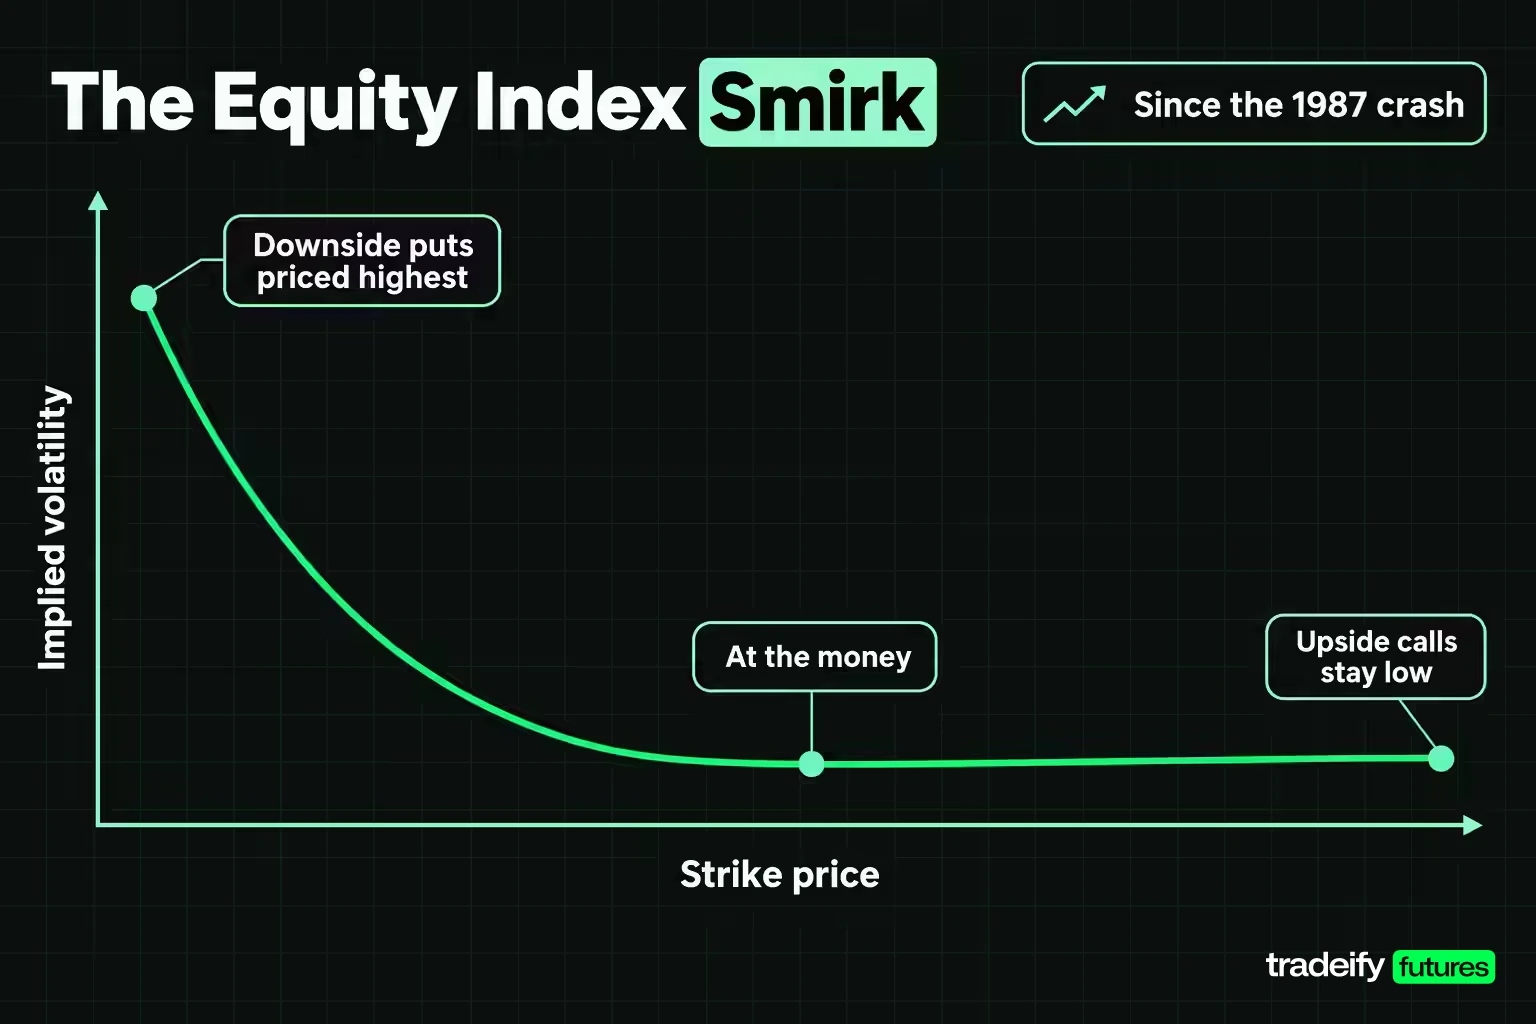
The volatility smirk is the lopsided smile that dominates stock index options: implied volatility is highest at low strikes, dips near the money and rises only slightly, if at all, at high strikes.
It has a specific history. Cboe's SKEW white paper says the S&P 500 implied volatility curve "emerged from a smile in the wake of the crash of October 1987" and has since "lost its symmetry," becoming "biased towards the put side." On Black Monday, October 19, 1987, the Dow Jones Industrial Average fell 22.6% in a single session, according to the Federal Reserve's history of the crash. The same essay notes that risk managers afterward recalibrated the way they valued options.
Cboe's explanation is direct: investors "now prize low strike puts more than they do high strike calls" because the 1987 crash sensitized the market to large downward jumps. After a one-day loss that size, the textbook odds of a crash looked naive, and the market started charging for it permanently.
Three forces keep the smirk in place:
- Structural put demand. Pension funds, insurers and long-only managers buy index puts to protect portfolios. There is no equally large natural buyer of far calls.
- Volatility rises when stocks fall. Cboe's VIX methodology calls the negative correlation of volatility to stock market returns well documented. A downside strike tends to be reached in a turbulent market, so the option seller needs more premium for it.
- Gap risk is hard to hedge. A put seller can't adjust a hedge fast enough when the index gaps through the strike overnight or in minutes, and the premium reflects that.
The smirk is persistent, not permanent in its steepness. It steepens and flattens with demand for protection, which is why the slope is worth tracking.
Related lesson: Tail risk and black swan events
Volatility Smile and Skew Compared
Volatility smile and skew shapes are easiest to keep straight side by side. The "where it shows up" column describes common tendencies documented by exchanges, not rules every chain follows.
| Shape | What the curve does | Where it commonly shows up | What it suggests | What it cannot tell you |
|---|---|---|---|---|
| Flat | Same implied volatility at every strike | Textbook model assumption | Market agrees with a normal distribution | Rarely seen in practice |
| Smile | Both wings above the at-the-money strike | Currency options, event-driven expirations | Big moves either way priced above model odds | Which direction is more likely |
| Smirk or reverse skew | Downside wing far above upside wing | Stock index options since 1987 | Crash protection carries a premium | Whether a drop is coming |
| Forward skew | Upside wing above downside wing | Gold and silver in normal rate regimes, some commodities | Sharp rallies priced as the bigger risk | Whether a rally is coming |
| Term structure | Implied volatility changes by expiration, not strike | Every options market, especially around events | When the market expects movement | Anything about strike asymmetry |
Two quick rules help. Smile versus skew is curvature versus tilt, and most real curves have some of each. And every row describes price, not prediction: the curve tells you what protection costs right now, not what will happen.
Volatility Skew as a Price for Tail Risk
The most useful way to read downside volatility skew is as an insurance premium. Out-of-the-money index puts pay off in a crash. Buyers pay extra implied volatility for that payoff, and sellers demand it because they carry the crash risk.
Cboe built an index to measure that price. The Cboe SKEW Index estimates the skewness of S&P 500 returns at the end of a 30-day horizon, calculated from a portfolio of out-of-the-money S&P 500 options using a method similar to VIX. Its formula is SKEW = 100 - 10 x S, where S is the market price of skewness. A SKEW of 100 corresponds to a normal distribution; higher readings mean the options market is pricing a fatter left tail. Cboe states that SKEW typically ranges from 100 to 150.
What SKEW readings translate to
Cboe's white paper converts SKEW levels into risk-adjusted probabilities of a large 30-day decline:
| SKEW level | Chance of a 30-day return 2 standard deviations below the mean | Chance of a 30-day return 3 standard deviations below the mean |
|---|---|---|
| 100 | 2.3% | 0.15% |
| 145 | 14.45% | 2.81% |
Those are risk-adjusted probabilities, which include the premium investors pay to avoid the outcome. They are a price, not a forecast. Between 1990 and 2010, SKEW ranged from a low of 101 to a high of 147, and Cboe notes that high SKEW values have shown up alongside both low and high VIX readings. A high reading tells you protection is expensive. It does not tell you when, or whether, it will pay.
Skew and VIX move separately
Volatility skew and volatility level are different measurements. Cboe's white paper shows that on March 9, 2009, SKEW read 112.95 with VIX at 49.68. On June 16, 2009, SKEW had risen to 125.11 while VIX had fallen to 32.68. Overall volatility was easing, yet the price of crash protection relative to the at-the-money options was climbing. A trader watching only VIX would have missed it.
As of the November 4, 2026 close, the Cboe SKEW Index stood at 150.90, at the top of its typical range. Read that as "S&P 500 tail protection is relatively expensive right now," not as a signal that a drop is due. The reading will be out of date within days; check the live value before using it.
Is volatility skew bullish or bearish?
Neither on its own. A steep downside skew can reflect fear, but it can also reflect heavy hedging by investors who are fully invested and staying that way. A flat skew can mean complacency or simply that protection was already bought. Skew tells you what the market is paying for, and the "why" needs other evidence.
Volatility Skew in Gold, Currencies and Other Markets
Volatility skew does not point downward everywhere. The direction depends on which move hurts the people hedging that market.
Gold and silver. CME Group research from May 7, 2019 found that in a normal monetary regime, out-of-the-money calls on gold and silver tend to cost more than out-of-the-money puts, because investors worry more about an abrupt rally than a fall. During the long period of near-zero rates and quantitative easing, the skew flipped and puts cost more. The same report warns that its skew-as-signal findings (2008 to April 2019) are time dependent.
A skew flip in real time. A CME OpenMarkets article showed how fast gold's skew can change. As of October 2, 2023, 5% out-of-the-money gold puts were priced near 20% implied volatility and 5% out-of-the-money calls about 15.5%. By October 20, 2023, after the Middle East conflict escalated, puts sat at 17.5% and calls near 20.5%. The skew had gone from downside to upside in under three weeks.
Forex options volatility smile
Currency options are where the classic, more symmetric smile lives, because a sharp move in either direction is a real risk for both sides of a currency pair. Skew still appears, and CME's 2019 report ties it to interest rates. Low interest rate "funding" currencies such as the Japanese yen and Swiss franc tend to show upward skew (calls on the currency cost more), because carry trades that borrow in those currencies unwind violently when they turn. Higher-rate currencies tend to skew the other way. CME notes the Australian and Canadian dollars showed exceptionally negative skew against the US dollar from 2009 through 2014.
Currency options desks quote this shape in delta terms: an at-the-money volatility, a 25-delta risk reversal for the tilt, and a butterfly for the curvature. That is the smile and the skew split into two numbers.
Commodities. In energy and agricultural options, call skew often appears when a supply disruption, a weather scare or a cold snap makes a price spike the bigger danger for hedgers. The direction can change with the season and with inventories, so it has to be read fresh each time.
Volatility Term Structure and the Volatility Surface
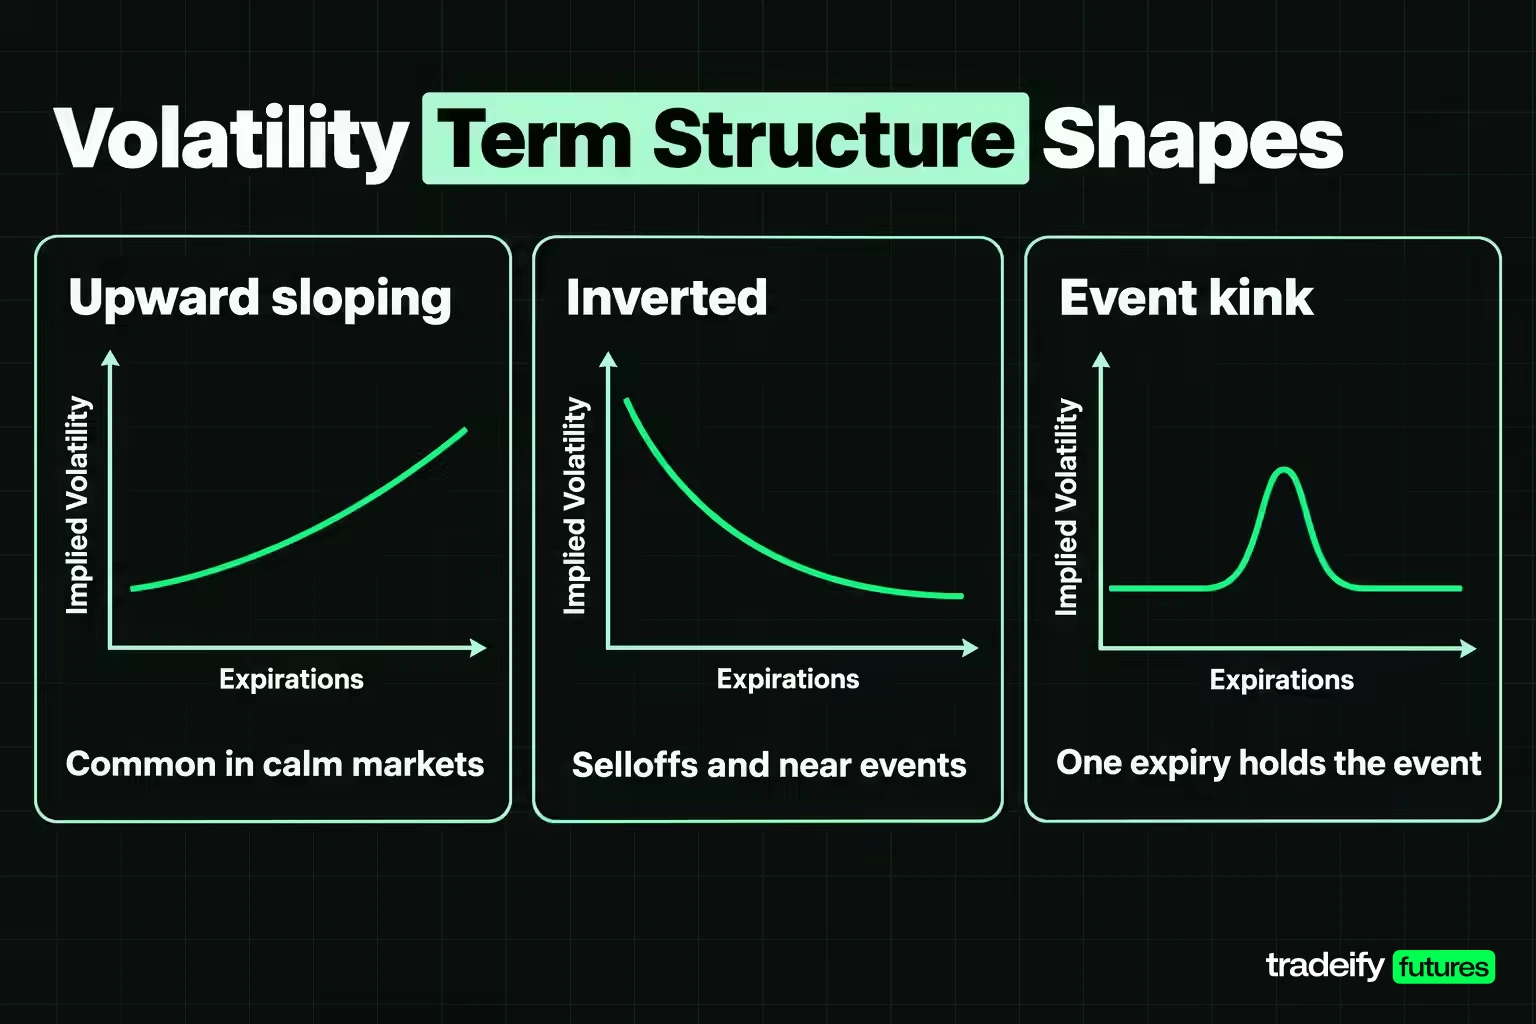
Volatility term structure is how implied volatility changes across expiration dates, holding moneyness steady. Skew compares strikes inside one expiration; term structure compares expirations.
Common term structure shapes:
- Upward sloping (contango). Longer-dated options carry higher implied volatility than short-dated ones. Common in calm markets, where more time means more room for something to go wrong.
- Inverted (backwardation). Short-dated options carry higher implied volatility. Common during a selloff or just before a known event, when near-term uncertainty dominates.
- Event kink. One expiration that captures an earnings report, a central bank decision or an inflation release carries a bump that the expirations on either side lack.
Cboe's VIX methodology shows the two dimensions working together: VIX is built from near-term and next-term S&P 500 options and interpolated to a constant 30-day horizon. Cboe also publishes a SKEW term structure, which tracks how the price of tail risk differs by expiration.
Combining skew and term structure into the volatility surface
Put strike on one axis, expiration on another and implied volatility on the vertical, and you get the volatility surface. Each slice at a fixed expiration is a smile or skew; each slice at a fixed moneyness is a term structure.
The surface matters because the two dimensions can move independently. A near-term event can lift one expiration while the downside skew in later months barely changes. A crash scare can steepen skew across every expiration at once. If you only look at one slice, you cannot tell which happened.
How Volatility Skew Changes Option Prices
Volatility skew changes the volatility input attached to each strike, and the premium follows. The cleanest way to see the size of the effect is to price the same options twice: once on a flat curve and once on the skewed one.
The example below uses Black-Scholes values for a hypothetical underlying at 100, 30 days to expiration, a 4% interest rate and no dividends. The flat column assumes 20% at every strike; the skewed column uses the illustrative curve from 28% at the 90 strike to 23% at the 110 strike. These are illustrative calculations, not market prices.
| Option | Premium on a flat 20% curve | Implied volatility on the skewed curve | Premium on the skewed curve |
|---|---|---|---|
| 90 put | $0.06 | 28% | $0.31 |
| 95 put | $0.51 | 24% | $0.81 |
| 100 call | $2.45 | 20% | $2.45 |
| 105 call | $0.71 | 21% | $0.80 |
| 110 call | $0.14 | 23% | $0.26 |
The at-the-money option is untouched. The far put, however, costs about five times as much on the skewed curve. Far wing options have little value to begin with, so a few volatility points move them a long way in percentage terms. On a contract with a 100 multiplier, the $0.25 difference on the 90 put is $25 per contract; check the multiplier in the contract specs, since it varies by product.
How skew changes a spread
Skew also shows up in spreads. A 95/90 put spread (buy the 95 put, sell the 90 put) costs $0.45 on the flat curve and $0.51 on the skewed curve. The short 90 put collects more because of skew, but the long 95 put costs more too, and on this curve the long leg's increase wins.
That is the main lesson for multi-leg positions: a spread is a bet on the relationship between two points on the curve. If the skew steepens or flattens while you hold it, the spread's value changes even when the underlying and the at-the-money volatility barely move. Direction and time decay usually still dominate the result, but skew is a real third input.
Reading and Interpreting Volatility Skew
Reading volatility skew well means turning a chart impression into a few numbers you can track over time. A simple three-part method covers most of it: level, slope and curvature.
Using the illustrative curve (90 strike at 28%, 95 at 24%, 100 at 20%, 105 at 21%, 110 at 23%):
- Level. At-the-money implied volatility is 20%. This is the volatility backdrop.
- Downside wing premium. 28% - 20% = 8 points.
- Upside wing premium. 23% - 20% = 3 points.
- Slope, or wing spread. 28% - 23% = 5 points. Positive means downside skew.
- Curvature. (28% + 23%) / 2 - 20% = 5.5 points. Positive means both wings sit above the center.
CME's CVOL course calculates convexity as a ratio instead, so different products can be compared. In its example, a curve of 30, 24, 20, 21 and 25 has a CVOL of 24.5 against an at-the-money 20, for a convexity of 1.225. Applying the same idea to the illustrative curve, the wing average of 25.5% divided by 20% gives 1.275.
Tracking a change in skew
Now suppose a second snapshot of the same expiration reads 26%, 23%, 20%, 22% and 25%. At-the-money volatility is still 20%. A trader watching only that number sees no change.
The wing spread tells another story: 26% - 25% = 1 point, down from 5. The curve has become far more balanced. Downside protection got cheaper relative to upside calls, even though "volatility" did not move.
What would change a volatility skew read
Treat any skew conclusion as conditional and ask what would overturn it:
- History. A 5-point wing spread is only steep or flat compared with the same market's own past, measured the same way.
- Events. An earnings date or data release inside the expiration can bend one wing for reasons that disappear afterward.
- Quote quality. Far wings often have wide markets and stale prints, and a single bad quote can invent a "spike".
- The underlying moved. If the market fell 3%, yesterday's 95 strike is now near the money. Compare by moneyness or delta, not by fixed strike.
Observation and confirmation are separate steps. A steep skew is an observation. A reason it should change, backed by history and a clean comparison, is what turns it into something you can act on.
Skew Measures Built From Many Strikes
Skew measures built from many strikes avoid the biggest weakness of a two-point risk reversal: it ignores everything between and beyond those two options. CME notes that the traditional risk reversal "uses only two points on the implied volatility curve and therefore misses much of the available market information."
The alternative is a model-free variance approach. Instead of assuming a pricing model and reading one implied volatility, these methods add up the prices of a whole strip of out-of-the-money options to estimate expected variance directly.
- VIX. Cboe introduced VIX in 1993 and rebuilt it in 2003 with Goldman Sachs to aggregate the weighted prices of S&P 500 puts and calls over a wide range of strikes. It measures 30-day expected volatility, uses mid-quotes of out-of-the-money options, excludes options with a zero bid, and stops adding lower puts once two consecutive strikes show zero bids.
- Cboe SKEW. Uses a similar out-of-the-money option portfolio to price the third moment of returns, skewness, instead of variance.
- CME CVOL. CME's CVOL indexes use a variance estimate across every strike on the curve. CVOL then splits skew into down variance (DnVar, built from the puts) and up variance (UpVar, built from the calls), so the tilt reflects the whole wing rather than one option.
For a trader, the practical upshot is choice of tool. A 25-delta risk reversal is quick and widely quoted. A full-strip measure is steadier and harder for one stale far-wing quote to distort. When the two disagree, the gap often points to a single strike doing something odd.
Arbitrage Limits on the Volatility Curve
Arbitrage limits put a ceiling on how strange a volatility curve can look. OIC describes the no-arbitrage principle as the idea that any rational price must exclude riskless profit. Applied across strikes, it creates a few hard rules that any valid skew has to respect.
- Put-call parity. A call and a put at the same strike and expiration must line up with the underlying and the present value of the strike. If they drift apart, traders can lock in the difference with stock or futures, which pushes the prices back.
- Call prices fall as strikes rise. A call with a higher strike can never be worth more than an otherwise identical call with a lower strike. Puts work the other way.
- Vertical spreads are bounded. A call spread between two strikes can never cost more than the discounted distance between the strikes, and never less than zero.
- Butterflies cannot be negative. A long butterfly (buy one low strike, sell two middle, buy one high) can never pay less than zero, so its price can't be negative. This is what stops a curve from bending too sharply.
These rules do not fix the skew at a particular level. They limit how fast it can change from one strike to the next. A downside wing can be very steep, but if one strike's implied volatility jumps far above its neighbors, the butterfly around it can become mispriced in a way arbitrage traders will sell.
In practice, transaction costs, bid-ask spreads and borrowing limits mean small violations can sit unclaimed. OIC notes that for most individual investors, costs may reduce or eliminate a perceived arbitrage opportunity. A curve that appears to break these rules on screen is usually showing a stale or wide quote, not free money.
Volatility Skew Trading Strategies and Their Risks
Volatility skew trading strategies try to profit from the shape of the curve changing, or to take advantage of one wing being rich or cheap relative to another. They are advanced structures, and the risks are easy to underestimate.
- Risk reversal. Buy an out-of-the-money call and sell an out-of-the-money put (or the reverse). It expresses a view on the relative price of the two wings, but it also carries a directional position and, on the short side, large potential losses.
- Put spread. Buy a nearer put and sell a farther one. Downside skew makes the short leg richer, which partly finances the long leg. Losses are capped at the premium paid, but the spread value moves as skew changes.
- Ratio spread. Buy one option and sell two or more farther out. It sells the expensive wing more heavily, and it leaves open-ended risk beyond the short strikes if the market moves hard that way.
- Butterfly. Buy the wings, sell the body, or the reverse. It trades the curvature of the smile rather than its tilt.
Where volatility skew trades go wrong
Here is where traders get caught: treating "high implied volatility" as "overpriced". A downside put can carry extra implied volatility for structural reasons that do not go away, and the skew can steepen further, often right when the underlying is falling. Selling the rich wing collects a premium that exists precisely because that wing occasionally pays out a lot.
A skew view still needs everything any option position needs: a defined maximum loss, realistic fills in wide far-wing markets, a scenario test for a large move, and a reason the relationship should change. Skew is one input to a decision, not the decision.
Common Volatility Skew Mistakes
Volatility skew mistakes tend to repeat, and most come from comparing things that are not alike.
- Comparing raw premiums instead of implied volatility. A put costs more than a call for many reasons, including intrinsic value and distance from the money. Only implied volatility puts them on one scale.
- Mixing expirations. Plotting a weekly put next to a monthly call blends skew with term structure.
- Trusting stale far-wing quotes. Cboe's VIX methodology drops options with a zero bid and stops adding strikes after two consecutive zero bids, for exactly this reason. Wide or empty markets give unreliable implied volatilities.
- Fixed strike versus fixed delta. After the underlying moves, the same strike sits at a different place on the curve. Track skew by moneyness or delta.
- Reading skew as a forecast. Steep downside skew means crash protection is expensive. It does not mean a crash is coming.
- Assuming skew stays put. When the underlying moves, the curve can shift with it, stay anchored to strikes, or reshape entirely. Your position's value depends on which happens.
- Building a trade from relative volatility alone. Direction, gamma, theta, vega, liquidity and maximum loss still decide the outcome.
Related lesson: Liquidity and bid-ask spreads in options
Volatility Skew for Futures Traders
Volatility skew is useful context for futures traders who never buy or sell an option. Equity index options sit on the same underlying as ES and NQ futures, and their skew shows how much the market is paying to protect against a sharp drop.
A few practical reads:
- Steep downside skew with a calm VIX. Protection is in demand even though headline volatility is low. Some traders treat that as a reason to keep position size modest rather than as a timing signal.
- Skew flattening into a selloff. Protection may already be owned, and forced hedging buyers may be fewer.
- Event kinks in the term structure. An expiration that spans a central bank decision or inflation release tells you where the options market expects the move to land in time.
None of these tell you which way the next futures move will go. They tell you how the options market is pricing risk around your trade, which can shape how much size you carry into an event.
On our accounts, options aren't available, so you can't trade skew directly with us; the only volatility product on our list is the EUREX VSTOXX future (FVS), on Tradovate accounts. Our hedging rule also treats a long equity index position plus a long volatility position as offsetting, so the two can't be paired as a hedge. Funded accounts are simulated, and reading skew is context for futures decisions, not a strategy we support.
Volatility Skew FAQ
What is the difference between a volatility smile and a volatility skew?
A smile describes curvature, with both wings above the at-the-money strike. A skew describes asymmetry, with one wing above the other. Most real curves show some of each.
Why does the volatility smile exist?
Real returns have fatter tails than the Black-Scholes model assumes, so large moves happen more often than the model expects. Far out-of-the-money options pay off in those moves, so the market prices them above the at-the-money volatility.
What is a volatility smirk?
A smirk is a lopsided smile where the downside wing rises much more than the upside wing. It is the normal shape in stock index options, where it has dominated since the October 1987 crash.
What does negative volatility skew mean?
Out-of-the-money puts carry higher implied volatility than equally distant calls. It means downside protection costs more, relative to the model, than upside exposure.
Does a steep skew predict a market crash?
No. Steep downside skew shows that crash protection is expensive, which can reflect fear or simply heavy hedging. Cboe treats its SKEW index as the price of tail risk, not a timing signal.
How often does volatility skew change?
It changes whenever option prices or the underlying move. Events, hedging flows and shifts in demand for protection can steepen or flatten it within days, as gold's skew flip in October 2023 showed.
This article is educational and uses hypothetical values in its worked examples. Options and futures carry substantial risk: options can expire worthless, some option strategies can lose more than the premium collected, and leveraged futures positions can lose more than you expect. Market readings cited here are dated and change quickly. Funded and evaluation accounts at prop firms are simulated, and nothing here is individualized financial advice.


