




TL;DR: Retail sales and consumer confidence measure different things: what households spent versus how they say they feel. Census retail sales are in current dollars, so September 2026's 0.8% gain was only 0.1% after inflation. Michigan sentiment sat at 48.0 in October 2026 while sales were up 6.3% from a year earlier. Check revisions, gasoline, the control group and real sales before reading the two as one signal.
A retail sales beat looks decisive at 8:30 AM. So does a slump in consumer confidence at 10 AM. The trap is treating either headline as the answer to the question that actually matters on release day: is the consumer getting stronger or weaker, and does the market care right now?
Retail sales and consumer confidence come from different places. One counts money spent at stores, websites and restaurants. The other asks households how they see business conditions, jobs and their own income. They often point the same way over long stretches. Month to month, they disagree all the time, and the disagreement is where most of the useful information sits.
This guide covers how each indicator is built, why they split apart, how to read them together, and how futures markets tend to process them. It uses the real September and October 2026 releases as the worked example, because a live case shows the traps better than a made-up one.
How Retail Sales and Consumer Confidence Differ
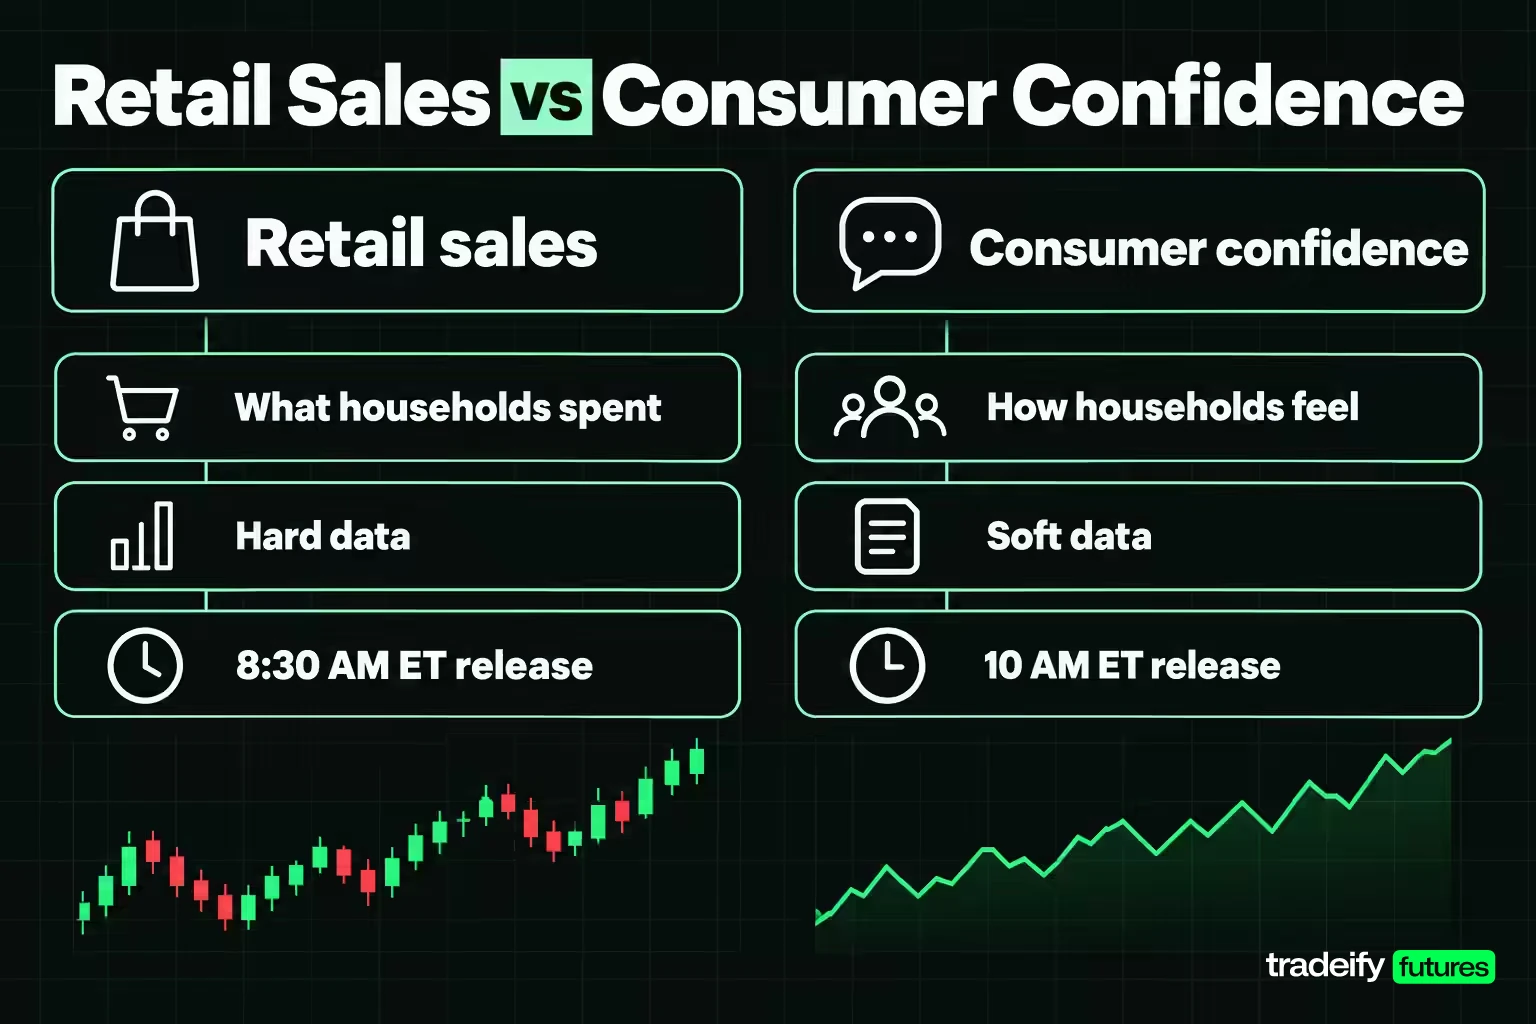
Retail sales and consumer confidence answer two different questions. Retail sales ask what households and other buyers actually spent at retail and food service businesses last month. Consumer confidence asks how households feel about the economy now and over the next six to twelve months.
Economists call retail sales hard data because it comes from reported business transactions. Confidence surveys are soft data because they capture opinions. Soft does not mean useless, and hard does not mean final: the advance retail sales number is a sample estimate that gets revised.
| Feature | Retail sales | Consumer confidence |
|---|---|---|
| What it measures | Dollar sales at retail and food service firms | Household views of current and expected conditions |
| Main U.S. source | Census Bureau advance monthly survey | Conference Board and University of Michigan surveys |
| Data type | Hard data from business reports | Soft data from household surveys |
| Units | Dollars and percent change, not adjusted for prices | Index points against a base period |
| Typical release time | 8:30 AM ET, mid-month | 10 AM ET |
| Biggest blind spot | Price changes inflate nominal sales | Feelings do not always turn into purchases |
The practical consequence: when the two disagree, neither one is automatically wrong. They are measuring different things, so a disagreement is information, not an error. A household can feel pessimistic and still buy groceries, fill the tank at a higher price, or replace a broken washer. Another household can feel optimistic and spend the extra money on services that the retail report barely covers.
What Consumer Confidence Means and How It Is Measured
Consumer confidence is the degree of optimism households express about the economy and their own finances. It matters because consumers who expect stable jobs and rising income are more willing to make big purchases, while worried consumers tend to delay them and save more.
The most cited U.S. measure is The Conference Board Consumer Confidence Index. It has run since 1967, monthly since June 1977, and has used an online sample of 3,000 responses per month since May 2021.
How the Conference Board Builds the Consumer Confidence Index
The Conference Board index rests on five questions:
- Current business conditions.
- Current employment conditions.
- Business conditions six months from now.
- Employment conditions six months from now.
- Total family income six months from now.
Each answer is positive, negative or neutral. For each question, the positive share is divided by the sum of positive and negative shares, which gives a "relative" value. That value is compared with its average for 1985, so the index reads 1985=100.
The first two questions form the Present Situation Index. The last three form the Expectations Index. The headline Consumer Confidence Index is the average of all five.
Reading Consumer Confidence Index Levels
The level only means something against its own history. A reading of 91.7 says confidence is below its 1985 benchmark. It is not a share of people who feel good.
The components often tell a different story from the headline. In October 2026, the Conference Board index rose 7.5 points to 91.7 from 84.2 in September. The Present Situation Index was 120.4, while the Expectations Index was 72.6. That split says households rated today's conditions far better than the next six months.
The Board publishes at 10 AM ET on the last Tuesday of each month, and the preliminary reading is revised with the next release. As of November 4, 2026, the next release is Tuesday, November 24.
Consumer Confidence Indexes Compared
Several consumer confidence indexes exist, and they are not interchangeable. Each asks different questions, samples differently and uses a different base, so compare each series with its own history and never subtract one from another.
| Index | Publisher | How it is built | Scale |
|---|---|---|---|
| Consumer Confidence Index | The Conference Board | Five questions on business conditions, jobs and income, online sample of 3,000 | 1985=100 |
| Index of Consumer Sentiment | University of Michigan Surveys of Consumers | Five questions on personal finances, business conditions and buying conditions, about 1,000 interviews | 1966 base period |
| Economic Confidence Index | Gallup | Ratings of current conditions plus economic outlook | -100 to +100 |
| Consumer confidence index | OECD | Standardized household survey data across member countries | Long-term average = 100 |
Consumer Sentiment vs Consumer Confidence
Consumer sentiment and consumer confidence describe the same idea, but in market usage the names usually point to two specific products. "Consumer confidence" usually means the Conference Board index. "Consumer sentiment" usually means the University of Michigan index.
The Michigan index leans more on personal finances and buying conditions. Its five questions ask whether the household is better or worse off than a year ago, whether it expects to be better off a year from now, how business conditions look over 12 months and five years, and whether now is a good time to buy major household items. Michigan now runs about 1,000 web interviews a month, publishes a preliminary reading mid-month and a final one at month end.
The Conference Board version leans more on the labor market. That difference can make the two series move in different directions in the same month. In October 2026, the Conference Board index rose while the Michigan sentiment index held almost flat at 48.0, versus 48.1 in September.
When to use each: the Conference Board's present-situation jobs questions are useful for labor market context. Michigan's buying-conditions and inflation-expectations questions are useful for price and big-ticket purchase context.
Consumer Confidence Indexes in Other Countries
Consumer confidence is measured in most large economies, usually by statistics agencies or central research bodies. The OECD publishes a standardized consumer confidence index built from household answers about expected finances, the general economy, unemployment and savings. It is amplitude adjusted so the long-term average equals 100.
The OECD reading is simple to interpret. Above 100 suggests households are more inclined to spend on major purchases over the next 12 months. Below 100 suggests a tendency to save more and spend less. Because it is standardized, it is the cleanest way to compare consumer confidence across countries without mixing national scales.
Gallup's Economic Confidence Index offers another U.S. view. It runs from -100 to +100, with zero as an equal balance of positive and negative views, and Gallup reports that it correlates strongly with both the Conference Board and Michigan measures.
What Drives Consumer Confidence Up or Down
Consumer confidence moves with the things households feel directly. The main drivers are:
- Prices, especially gasoline and groceries, because they are bought often and seen daily.
- The job market: whether jobs feel plentiful or hard to get.
- Income expectations over the next six months.
- Interest rates, which change the cost of cars, homes and credit card balances.
- Stock and home prices, which change how wealthy households feel.
- Big news events such as wars, shutdowns or elections.
The October 2026 surveys show these drivers at work. The Conference Board linked the rise in confidence to retail gasoline prices easing from September. Write-in responses still focused on prices, food and groceries, and oil and diesel. Consumers' average 12-month inflation expectation was 5.8%. In the Michigan survey, buying conditions for durables plunged 18% on higher interest rates and affordability concerns, and year-ahead inflation expectations rose to 4.7%.
How Elections and Party Politics Move Consumer Confidence
Consumer confidence now splits sharply by political affiliation. In October 2026, the Conference Board reported that confidence improved across all affiliations but much more so for Republicans. Michigan reported gains among Republicans and Democrats offset by declines among independents.
That matters for interpreting consumer confidence around elections. Confidence questions about business conditions and the next five years overlap with how people judge the party in power. When an election changes that party, supporters of the winner can turn more optimistic and supporters of the loser more pessimistic, even if neither group's paycheck or shopping list changes.
Two habits help. First, look at the components tied to personal finances and jobs, which tend to track real conditions more closely than broad national outlook questions. Second, treat a large post-election swing in confidence as a reason to check the next retail sales and jobs reports, not as proof that spending has already moved. The October 2026 surveys, where partisan groups moved in different directions within the same month, show how much of the headline can be politics rather than purchasing power.
Policy Actions That Can Lift Consumer Confidence
Governments and central banks can influence consumer confidence, though not on command. Typical levers include:
- Lower interest rates, which cut borrowing costs for cars, homes and credit.
- Fiscal support such as tax cuts or direct payments, which raise disposable income.
- Policies that bring inflation down, since prices are the most common complaint in surveys.
- Clear communication, which can reduce uncertainty about the outlook.
The current policy setting runs the other way. As of November 4, 2026, the Federal Reserve's target range is 3.75%-4.00% after a September hike, held at the October 28 meeting. Higher rates are part of why Michigan respondents rated big-ticket buying conditions poorly.
How Retail Sales Are Measured
Retail sales in the United States come from the Census Bureau's Advance Monthly Retail Trade Survey. It produces an early estimate of total sales and the month-to-month change for retail and food service businesses.
The mechanics matter for anyone reading the release:
- The advance sample is approximately 4,800 firms, drawn from a monthly survey of about 13,000.
- Results are weighted to represent over three million retail and food service firms.
- Data collection ends by the sixth business day after the month closes.
- The estimate is released approximately ten business days after month end, at 8:30 AM ET.
- It is revised one month later by the fuller monthly survey, and benchmarked to annual data.
- Figures are adjusted for seasonal, holiday and trading-day differences, but not for price changes.
Retail sales also feed into the government's estimates of personal consumption expenditures, which is why the release can shift growth forecasts.
Sampling Error in the Retail Sales Estimate
Every advance retail sales figure comes with a margin of error, set as a 90% confidence interval. For September 2026, sales rose 0.8% (±0.4%), so the plausible range of the true change runs from about 0.4% to 1.2%. If an interval includes zero, the Census Bureau says there is not enough evidence that sales changed at all.
That is worth remembering when a print misses consensus by 0.1 or 0.2 percentage point. The miss can be smaller than the survey's own uncertainty.
Retail Sales Growth vs Level
Retail sales are reported both as a dollar level and as growth rates. For September 2026, the advance estimate was $745.0 billion, up 0.8% from August and up 6.3% from September 2025.
The monthly change gets the headline and moves markets. The year-over-year change smooths out monthly noise. The level shows scale and lets you check revisions: August was revised to $739.3 billion, with its monthly gain raised from 1.1% to 1.3%.
Retail Sales Categories and the Control Group
The Census retail sales headline mixes volatile categories with steady ones. Motor vehicle sales swing with incentives and supply, and gasoline station sales move with fuel prices. That is why the release also shows totals excluding autos, excluding gasoline, and excluding both.
Market reports also track the control group: retail sales excluding auto dealers, gasoline stations, building materials and food services. Economists use it because it maps more closely to the goods spending that flows into GDP. It is not a separate Census headline, so analysts compute it from the category tables.
Nominal vs Real Retail Sales

Retail sales are reported in nominal dollars, meaning current prices. A 0.8% rise in sales does not mean shoppers bought 0.8% more goods. If prices rose, part of that gain is inflation.
Real retail sales strip out price changes. The St. Louis Fed publishes one version, Advance Real Retail and Food Services Sales, by deflating the Census series with the Consumer Price Index.
September 2026 shows how wide the gap can get:
| September 2026 measure | Nominal retail sales | Real retail sales |
|---|---|---|
| Change from August | 0.8% | 0.1% |
| Change from a year earlier | 6.3% | 2.5% |
The difference came largely from prices. CPI rose 0.6% in September, with gasoline up 9.1% on the month, and gasoline station sales rose 6.4%. A quick shortcut is to subtract monthly CPI from nominal sales growth: 0.8% minus about 0.6% leaves roughly 0.2% of real growth, close to the 0.1% in the deflated series.
The lesson is plain. A nominal beat during a fuel price spike can describe higher bills, not stronger demand. Real sales still grew 2.5% over the year, so spending volumes were rising, just far slower than the nominal headline suggested.
How Consumer Confidence Affects Consumer Spending
Consumer confidence affects consumer spending mainly through big and optional purchases. Households that expect stable jobs and higher income are more willing to buy a car, furniture or a vacation. Households that expect layoffs or rising costs tend to delay those purchases and build savings.
Consumer spending covers everything households buy: groceries, gasoline, rent, a new phone, a restaurant meal, a streaming subscription. Retail sales capture the goods side and restaurants. Much of the services side, such as rent, insurance and medical care, sits outside the retail report.
The September 2026 Census report gives concrete examples of consumer spending by category. Nonstore retailers, mostly online sellers, took in $124.3 billion. Food services and drinking places took in $92.9 billion. Gasoline stations took in $68.0 billion. A restaurant bill is a fairly discretionary purchase, while a gasoline bill mostly is not, which is why the category mix says more about confidence than the total does.
Why the Monthly Link Between Sentiment and Retail Sales Is Loose
The relationship between sentiment and retail sales works better over quarters and years than over single months. Common reasons the two diverge:
- Necessities get bought regardless of mood.
- Higher prices lift nominal sales without more goods being bought.
- Savings, rising stock portfolios and credit can keep spending going.
- Large purchases are often planned well before the survey month.
- Spending can shift to services outside most of the retail report.
- Survey answers increasingly reflect political views as well as finances.
2026 is a clear example. PNC Economics noted that Michigan sentiment in October was at its second-lowest level ever, while September retail sales were up 6.3% from a year earlier and real sales were up 2.5%. Sentiment said "unhappy." Spending said "still buying."
Consumer Confidence and Aggregate Demand
A rise in consumer confidence tends to raise aggregate demand. In the standard model, aggregate demand equals consumption plus investment plus government spending plus net exports (AD = C + I + G + X - M). When consumers feel more confident, they consume more at every price level, which shifts the aggregate demand curve to the right. A drop in confidence does the reverse.
The size of the shift depends on whether confidence turns into actual spending, which is exactly what retail sales help check.
Consumer Confidence as a Recession Signal
Consumer confidence is watched as a recession signal because households often cut back when they expect trouble, and consumption is one of the main components of aggregate demand. The Conference Board describes an Expectations Index reading below 80 as the threshold that usually signals a recession ahead. Michigan's consumer expectations measures are also included in the Leading Indicator Composite Index and the OECD's leading indicator for the United States.
The signal is useful, but it is not a verdict, and 2026 shows why. In January 2026, the Conference Board Expectations Index fell to 65.1, and the headline index hit 84.5, the lowest since May 2014. By October 2026 the Expectations Index was 72.6, still below 80. Yet over the same period, nominal retail sales grew 6.3% year over year and real retail sales 2.5%.
So is consumer sentiment declining? As of November 4, 2026, the answer depends on the series. The Michigan index was 48.0 in October, down from 53.6 a year earlier. The Conference Board index rose to 91.7 in October after three monthly declines in its expectations component.
The practical rule: treat a sustained drop in expectations as a reason to watch spending, jobs and credit more closely. Do not treat a single month below 80 as a forecast that a recession has started.
Core Capital Goods Orders as a Check on Consumer Confidence
Business spending is the other half of private demand, and it often confirms or contradicts what consumer confidence suggests. If households sound gloomy but companies keep ordering equipment, the growth story is harder to call weak.
The most watched monthly proxy is core capital goods orders: new orders for nondefense capital goods excluding aircraft, from the Census Bureau's durable goods report. Aircraft are excluded because a few large orders can swing the total.
September 2026 shows why. Total durable goods orders rose 1.8%, but nondefense aircraft orders jumped 28.4%. Core capital goods orders rose a quieter 0.5% to $88.0 billion. That still pointed to steady business investment while consumer surveys were near historic lows.
Read business spending and consumer confidence together. Weak confidence plus falling core orders is a broader slowdown signal than weak confidence alone.
Reading Retail Sales and Consumer Confidence Together

The most useful way to read retail sales and consumer confidence is as a two-by-two diagnostic. First decide whether they agree, then explain why.
| Retail sales | Consumer confidence | What it often means | What to check next |
|---|---|---|---|
| Rising | Rising | Demand and mood agree on strength | Is the sales gain broad, and were prior months revised up? |
| Falling | Falling | Demand and mood agree on weakness | Is the drop broad or one volatile category, and is the job market softening? |
| Rising | Falling | Households spend despite feeling worse | Prices, necessities, savings, credit or one-off purchases |
| Falling | Rising | Better mood not yet showing in goods spending | Shift to services, delayed big purchases or a one-month dip |
When Retail Sales and Confidence Agree
Agreement makes a story stronger, but it still needs quality checks. A rising-rising month led only by autos and gasoline is weaker than one with broad gains in the control group. A falling-falling month after a strong run may just be payback.
When Retail Sales and Confidence Diverge
Divergence is common and can last for months. Sales up with confidence down usually points to prices, necessity spending, or households drawing on wealth and credit. Sales down with confidence up often means optimism has not reached the register yet, or spending moved to services.
The matrix is a pause button, not a trade signal. Its job is to stop one headline from becoming the whole consumer story in your head before the details are in.
September 2026 Retail Sales Report Worked Example
The September 2026 retail sales report, released October 15, 2026, shows how much the details can change a headline. All figures are from the Census Bureau release and the October confidence surveys.
| Data point | Reading |
|---|---|
| Headline retail sales, month over month | +0.8% |
| Consensus expectation (as reported by PNC Economics) | +0.3% |
| August revision | 1.1% to 1.3% |
| Gasoline station sales | +6.4% |
| Sales excluding autos and gasoline | +0.2% |
| Control group | +0.1% |
| Real retail sales (CPI-adjusted) | +0.1% |
| Conference Board index, October | 91.7, up from 84.2 |
| Michigan sentiment, October final | 48.0 |
September 2026 Retail Sales Headline vs Consensus
The first read of the September 2026 retail sales report (released October 15, 2026) was a big beat: headline sales rose 0.8% against 0.3% expected, with August revised higher by 0.2 percentage point. On the surface, that looks like a strong consumer, and it is easy to stop reading there when futures are already moving.
Retail Sales Details Behind the September 2026 Headline
The details of the September 2026 retail sales report change the quality of its 0.8% headline beat. Gasoline station sales rose 6.4% as fuel prices jumped. Excluding autos and gasoline, sales rose only 0.2%. The control group rose about 0.1%. Adjusted for CPI, real sales rose about 0.1%.
The honest conclusion: nominal spending was stronger than expected, but most of the surprise came from prices at the pump. Core goods demand was roughly flat for the month, after a strong August.
What Would Change the September 2026 Retail Sales Read
The September 2026 retail sales read was that nominal spending beat expectations (0.8% against 0.3%) mainly because of gasoline prices, while core goods demand was roughly flat. October 2026 consumer confidence data fit that interpretation. The Conference Board linked October's improvement to easing gasoline prices, and Michigan respondents complained about purchasing power and big-ticket affordability.
What would change this conclusion? A strong control-group gain in the next report, upward revisions to September, or real sales picking up as gasoline prices ease would make the demand story stronger. A falling control group alongside expectations stuck below 80 would make it weaker.
How Futures Markets React to Retail Sales and Confidence Reports
Futures markets react to the gap between the release and what was expected, then to what that gap means for growth and interest rates. Retail sales hit at 8:30 AM ET. The Conference Board and Michigan releases arrive at 10 AM ET.
A strong consumer report can push markets in two directions at once:
- Growth channel: stronger spending supports earnings expectations, which can lift equity index futures such as ES and NQ.
- Rates channel: stronger spending can keep inflation pressure alive, push Treasury yields higher and strengthen the dollar, which can weigh on equity index futures.
Which channel wins depends on the policy backdrop. With the Fed's range at 3.75%-4.00% as of November 4, 2026, after a September hike and an October hold, a hot report can read as a reason for rates to stay high rather than as pure good news.
Upcoming Consumer Data Releases
As of November 4, 2026, the next scheduled consumer releases are:
| Release | Date | Time (ET) |
|---|---|---|
| Michigan sentiment, November preliminary | Friday, November 6, 2026 | 10 AM |
| CPI, October data | Tuesday, November 10, 2026 | 8:30 AM |
| Retail sales, October advance | Tuesday, November 17, 2026 | 8:30 AM |
| Conference Board confidence, November | Tuesday, November 24, 2026 | 10 AM |
Common Mistakes With Consumer Data
- Trading the headline before reading revisions and categories.
- Calling every nominal sales gain strong demand.
- Treating one confidence print as a spending forecast.
- Assuming good economic data is always good for stocks.
- Mixing index levels from different confidence surveys.
If you cannot read the revision and category mix before price moves, doing nothing is a valid decision. Missing the first spike does not make the second one a good entry. It makes it a different trade.
On our accounts, news trading is allowed with no restrictions, at your own risk. Orders can fill far from the expected price in a fast release, and the daily loss limit should never be used as a stop. All positions must be closed by 4:45 PM ET, so any reaction to an 8:30 AM retail sales print is a same-session trade.
Consumer Data Release Checklist
Use this checklist for retail sales and consumer confidence releases. It has two parts, because the work before the numbers drop is different from the work after.
Before a Consumer Data Release
- Write down the consensus and prior values for retail sales and the confidence survey.
- Note what else is on the calendar that week, such as CPI or a Fed meeting.
- Decide in advance what result would surprise you, and in which direction.
After a Consumer Data Release
- Record the retail sales headline versus consensus.
- Record the revision to the prior month and compute the net change.
- Check autos, gasoline and the control group.
- Compare nominal growth with the latest CPI to estimate real growth.
- For consumer confidence, record the Present Situation and Expectations components, not just the headline.
- Classify the pair as agreeing or diverging, write one reason why, and note what next month's data would need to show to change your view.
The checklist does not make releases easy to trade. It stops a noisy headline from turning into a confident story without support.
Related lesson: What market volatility means
Retail Sales and Consumer Confidence FAQ
What is meant by consumer confidence?
Consumer confidence is how optimistic households feel about the economy, jobs and their own income. Surveys such as the Conference Board index turn those answers into a number tracked against a base year.
Is consumer confidence a leading indicator of retail sales?
Consumer confidence offers forward-looking context, but it is a weak one-month forecast of retail sales. Prices, jobs, savings and credit can keep spending going even when confidence is low.
Are retail sales adjusted for inflation?
No. Census retail sales are adjusted for seasonal and calendar effects but not for price changes. Real retail sales series deflate them with CPI.
What is an example of consumer spending?
Groceries, gasoline, a new car, a restaurant meal and rent are all consumer spending. Retail sales capture goods and restaurants, while many services fall outside the report.
Is consumer sentiment declining?
It depends on the survey. As of November 4, 2026, Michigan sentiment was 48.0 in October, down from 53.6 a year earlier, while the Conference Board index rose in October.
What happens to aggregate demand when consumer confidence rises?
Aggregate demand usually rises. More confident households spend more at every price level, which shifts the aggregate demand curve to the right.
This article is for education only and is not financial advice; funded and evaluation accounts are simulated, so results can differ from live trading. Futures trading uses leverage, and fast moves around economic releases can cause losses larger than expected, including slippage past a planned stop.


