



TL;DR: Volatility is how far a price swings over time, not which way it goes. Historical volatility and ATR measure past swings; implied volatility and the VIX price expected ones. The VIX closed at 16.61 on November 4, 2026, against a 1990 to 2026 average of 19.42. When volatility rises, the same stop and size carry more risk, so position size should fall.
Volatility often shows up first as a stop that held all last week getting hit in the first ten minutes. Nothing about the plan changed. The market's range did.
Volatility is the size of a market's price swings over a period of time. It describes how much prices vary, not whether they rise or fall. This guide covers what volatility is, how historical volatility, Average True Range, implied volatility, the VIX and beta measure it, what causes it, and how to adjust stops and position size when it changes.
What Is Volatility in Trading
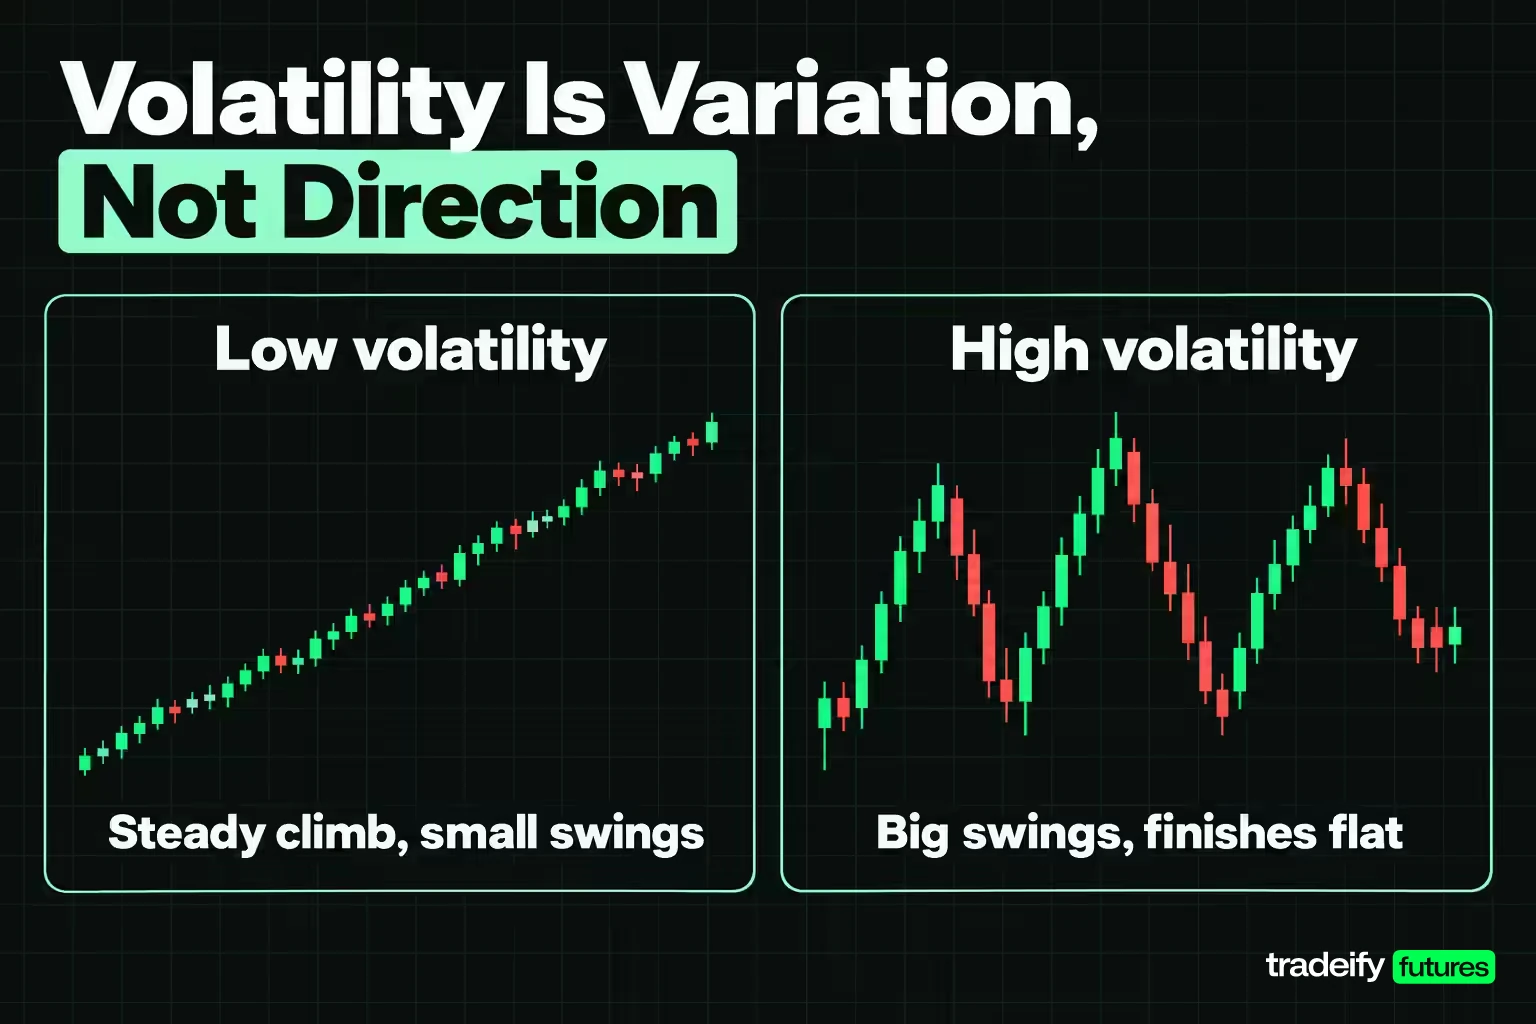
Volatility in trading is the degree to which a price varies over a set period. The key word is variation. Variation is not direction.
If the S&P 500 gained a small, steady amount every session for a month, it would travel a long way with low volatility. If it alternated between large up days and large down days and finished flat, it would go nowhere with high volatility.
That is why "the market is volatile" and "the market is falling" are different statements, even though headlines often use them as if they meant the same thing. Treating them as one produces two common errors: assuming a volatile market must be heading down, and assuming a quiet market cannot hurt you.
FINRA describes market volatility in plain terms: some days prices move up, other days they move down, and the more dramatic those swings, the higher the volatility and the potential risk.
Related lesson: Bull vs. bear markets
Volatility in simple words and outside finance
In simple words, volatility means how jumpy something is. Merriam-Webster defines volatile as "characterized by or subject to rapid or unexpected change", and its own example is "a volatile market".
The same word describes people and chemicals. A volatile person has moods that change quickly or tend to erupt (the dictionary's example is "a volatile temper"). A volatile liquid evaporates easily at a low temperature. That is also what volatility means for fuel: the EPA describes it as the property that defines how a fuel evaporates, measured for gasoline as Reid vapor pressure, which federal rules cap at 9.0 pounds per square inch in the summer season.
In markets the meaning is narrower and measurable. Price volatility comes with units: a percentage of the price, or the instrument's own points or dollars. That is what makes it useful to a trader, because a number can be compared, tracked and planned around.
Historical Volatility and How It Is Calculated
Historical volatility, also called realized volatility, measures how much a price actually moved over a past window. It is the standard deviation of the instrument's returns, usually daily close-to-close returns, scaled up to an annual figure.
Cboe's realized volatility indices use exactly this idea: they measure the annualized standard deviation of daily returns over a set lookback. Its flagship version uses 21 trading days, roughly one month, and longer versions use 63, 126 and 252 trading days.
The calculation has four steps:
- Take a series of closing prices.
- Compute each day's logarithmic return, the natural log of today's close divided by yesterday's close.
- Find the standard deviation of those returns. That is the daily volatility.
- Multiply by the square root of 252, the usual count of trading days in a year (about 15.87), to annualize it.
A worked historical volatility example on five closes
These are five illustrative E-mini S&P 500 closes, round numbers chosen so the arithmetic can be checked on a calculator. They are not market quotes.
| Session | Close | Change in points | Log return |
|---|---|---|---|
| 1 | 7,000.00 | none | none |
| 2 | 7,049.00 | +49.00 | +0.6976% |
| 3 | 7,007.00 | -42.00 | -0.5976% |
| 4 | 7,070.00 | +63.00 | +0.8951% |
| 5 | 7,021.00 | -49.00 | -0.6955% |
Five closes give four returns. Their average is about +0.08%, close enough to zero that direction contributed almost nothing to the result. The sample standard deviation of the four returns is 0.838% a day.
Multiply by 15.87 and the annualized historical volatility is 13.30%, or about 13%. That number says the day-to-day swings in this window were consistent with a 13% annual spread of outcomes. It does not say the price will move 13%.
Four returns is a tiny sample, used here only to show the steps. Twenty sessions is a sensible floor, which is why one-month (21-day) windows are common, and the answer will change with the window you choose.
What 20% volatility means
Twenty percent volatility means an annualized standard deviation of 20%. Divide by 15.87 and that is about 1.26% a day. On an index at an illustrative 7,000, a one-standard-deviation day is roughly 88 points.
Traders often shorten the divisor to 16, the "rule of 16", to convert an annual volatility figure into a typical daily move in their heads.
Related lesson: Standard deviation indicator
Average True Range and Other Volatility Measures
Close-to-close volatility tells you how far price moved between one close and the next. It says nothing about the path in between, and the path is where a stop gets hit. A session can run 70 points up, come all the way back and close unchanged, which shows up as almost zero close-to-close volatility.
Average True Range (ATR) measures volatility from the range instead. J. Welles Wilder introduced it in his 1978 book New Concepts in Technical Trading Systems, built for commodities that often gap or make limit moves. A high-minus-low range misses those gaps, so Wilder's true range takes the largest of three distances:
- Today's high minus today's low.
- Today's high minus yesterday's close (as an absolute value).
- Today's low minus yesterday's close (as an absolute value).
ATR is the average of those true ranges, typically over 14 periods. Like every volatility measure, it says nothing about direction.
A worked Average True Range example
The same five illustrative E-mini S&P 500 sessions, now with highs, lows and the previous close:
| Session | High | Low | Previous close | High minus low | High minus previous close | Previous close minus low | True range |
|---|---|---|---|---|---|---|---|
| 1 | 7,035.00 | 6,975.00 | 6,972.00 | 60.00 | 63.00 | -3.00 | 63.00 |
| 2 | 7,068.00 | 7,012.00 | 7,000.00 | 56.00 | 68.00 | -12.00 | 68.00 |
| 3 | 7,062.00 | 6,990.00 | 7,049.00 | 72.00 | 13.00 | 59.00 | 72.00 |
| 4 | 7,086.00 | 7,024.00 | 7,007.00 | 62.00 | 79.00 | -17.00 | 79.00 |
| 5 | 7,078.00 | 7,010.00 | 7,070.00 | 68.00 | 8.00 | 60.00 | 68.00 |
The five true ranges average 70.00 points, which is 0.997% of the last close of 7,021. Two rows show why the range version matters to a trader.
Session 4 had a high-to-low range of 62 points, but its high sat 79 points above the previous close, because the market opened higher and kept going. Session 3 closed only 42 points below the prior close, yet it travelled 72 points from high to low on the way. A stop placed 30 points away cared about that 72, not the 42.
Point value turns a volatility measurement into money. The E-mini S&P 500 (ES) is worth $50 per index point and the Micro E-mini (MES) $5, so a 70-point ATR is $3,500 per ES contract and $350 per MES contract.
Volatility measures compared
| Measure | What it uses | Looks | Best use |
|---|---|---|---|
| Historical volatility | Standard deviation of past returns | Backward | Comparing markets and periods |
| Average True Range | Average daily range including gaps | Backward | Setting stop distance and size |
| Implied volatility | Option prices | Forward | Reading expected movement and option cost |
| VIX | S&P 500 option prices over 30 days | Forward | Gauging expected stock market volatility |
| Beta | Moves relative to a benchmark index | Backward | Comparing a stock with the market |
Related lesson: Average true range (ATR)
Implied Volatility and Options Pricing
Implied volatility is the volatility the options market is pricing in for the future. It is not measured from past prices. It is backed out of current option premiums: if you know an option's price and the other pricing inputs, you can solve for the volatility that would justify that price.
That makes implied volatility a forward-looking number set by supply and demand. The Options Industry Council (OIC) puts it directly: increased demand and higher premiums mean an increase in implied volatility. Implied volatility can also change without any movement in the underlying, for example ahead of a scheduled earnings report or data release.
How implied volatility changes an option's price
Higher implied volatility means higher option premiums, for calls and puts alike, because a wider range of possible outcomes makes the option's potential payoff more valuable.
The Greek that measures this is Vega, the change in an option's value for a 1% change in implied volatility. In OIC's example, a Vega of .090 means the option's theoretical value rises by .090 if implied volatility rises one point and falls by .090 if it drops one point.
On a standard equity option covering 100 shares, a Vega of .090 is worth about $9 per contract per point of implied volatility. A 5-point drop in implied volatility after an event would take about $45 off that contract, even if the stock barely moved. That is why option buyers can be right on direction and still lose money when implied volatility falls.
OIC also notes that longer-dated options tend to have higher Vega than near-term ones, so they are more sensitive to a change in implied volatility.
What Is the VIX Volatility Index
The VIX is the Cboe Volatility Index, the best-known measure of expected volatility in the US stock market. It estimates the volatility the market expects for the S&P 500 over the next 30 days, using the prices of a wide range of S&P 500 index puts and calls.
Cboe launched the VIX in 1993 on S&P 100 options and rebuilt it on the S&P 500 in 2003. The financial press often calls it the "fear gauge". VIX futures followed in 2004, and Cboe lists both VIX futures and VIX options today.
How to read a VIX number
A VIX reading is an annualized implied volatility in percentage points. Divide it by 15.87 to estimate the expected one-standard-deviation daily move in the S&P 500.
As of the November 4, 2026 close, the VIX stood at 16.61, down 20.26% from 20.83 a day earlier. That converts to an expected daily move of about 1.05%. Its 52-week closing range at that point ran from 13.47 to 31.05. Those levels will be out of date quickly, so check Cboe for the current figure.
For long-run context, a review of Cboe's daily VIX history from January 1990 to November 4, 2026 (9,309 sessions) gives:
- A mean close of 19.42 and a median close of 17.56.
- A record close of 82.69 on March 16, 2020, and a lowest close of 9.14 on November 3, 2017.
- Closes above 20 on 36.9% of sessions, above 30 on 7.9% and above 40 on 2.2%.
VIX vs realized volatility
The VIX is an expectation, and expectations usually run a little rich. Cboe itself notes that index options have tended to price in slightly more uncertainty than the market ultimately realizes.
Cboe's own data shows it. Comparing each day's VIX close with the S&P 500's realized volatility over the following 21 sessions, from 1990 through 2026, the VIX was higher on 85.3% of days, by a median of about 4.7 points. The same history shows the next day's S&P 500 move stayed inside the VIX-implied one-day range on 81.6% of sessions, more often than the roughly 68% a textbook one-standard-deviation band would suggest.
As of November 4, 2026, the S&P 500's realized volatility over the previous 21 sessions was 12.60%, against a VIX of 16.61. That gap is normal, not a signal. Read a VIX above realized volatility as the market paying for insurance, not as a forecast that a sell-off is coming.
Beta and Volatility Relative to the Market
Beta measures how a stock has moved relative to a benchmark index, not how volatile it is in total. FINRA explains that the benchmark is assigned a beta of 1, and a stock with a beta of 1.2 has historically moved 120% for every 100% move in an index such as the S&P 500. A stock with a beta of 0.85 has historically moved less than the index.
As a worked illustration, if the S&P 500 fell 2%, a 1.2-beta stock moving in line with its history would fall about 2.4%, and a 0.85-beta stock about 1.7%. Real stocks rarely track their beta that neatly on any single day.
The distinction matters. FINRA points out that a stock can have high volatility and a low beta if its moves do not line up with the market's. A small biotech company waiting on a drug trial result can swing wildly on its own news while showing a low beta. Beta answers "how much does this move with the market?", and volatility answers "how much does this move at all?".
Beta belongs mostly to stock and portfolio analysis. A futures trader on an index contract is trading the benchmark itself, so beta adds little there; historical volatility and ATR do the work.
Related lesson: Beta and market risk
High Volatility vs Low Volatility
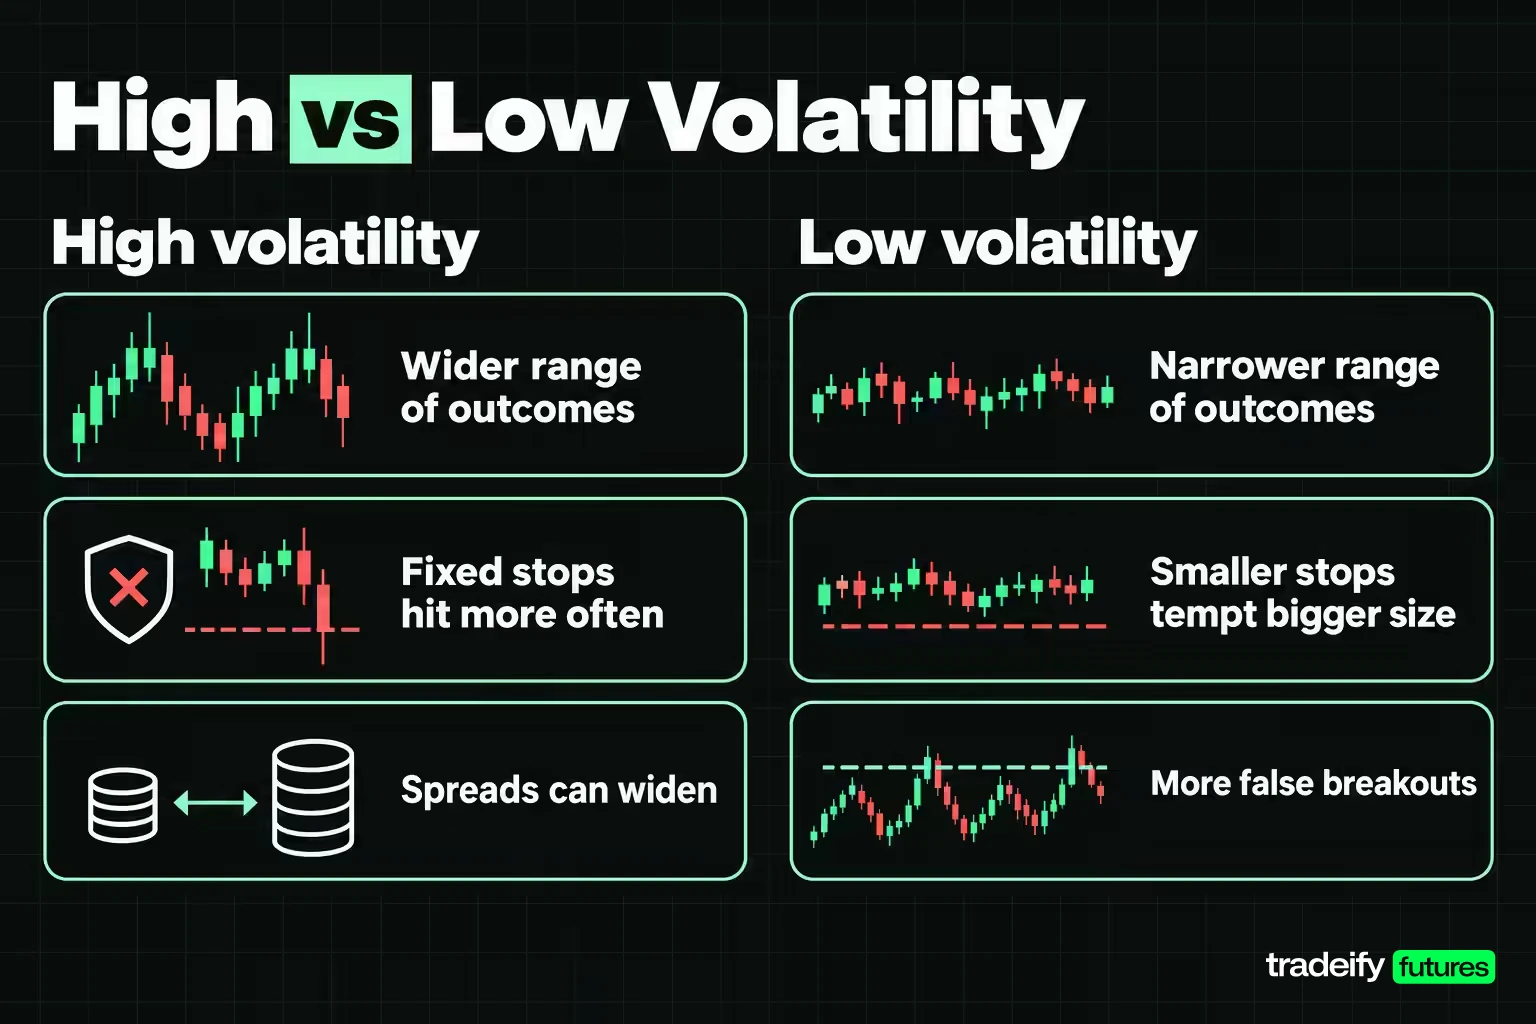
High volatility means a wider spread of possible outcomes in a given period. Low volatility means a narrower one. Neither tells you direction.
Cboe's daily VIX and S&P 500 history shows how different the two regimes feel. Grouping every session from January 1990 to November 2026 by the VIX close, then measuring the S&P 500's move the next day:
| VIX close | Sessions | Average next-day S&P 500 move | Next-day moves larger than 2% |
|---|---|---|---|
| Below 15 | 2,963 | 0.42% | 0.4% |
| 15 to 20 | 2,885 | 0.63% | 2.1% |
| 20 to 30 | 2,692 | 0.95% | 10.4% |
| Above 30 | 734 | 1.87% | 34.3% |
In that Cboe data, when the VIX closed above 30, the next day's average move was more than four times the average after a sub-15 close, and a 2% day was roughly 85 times more common. Same index, same contract, a completely different market to trade.
What high volatility means for a trader
High volatility means a fixed stop is more likely to be reached, the same position carries more dollar risk, and gaps through stops become more likely. Spreads can widen and fills can slip, so the cost of the worst case rises along with the average one.
It does not mean the market is falling, and it does not mean a big move is due. It also does not mean a strategy that worked in a calm market will keep working in a fast one. A fast market needs its own sample before you trust the results.
Why low volatility is not the same as safety
Low volatility compresses ranges, which shrinks stops and tempts traders to size up. That larger position then meets the market when the range expands again. A calm month can turn into a bad one through exactly that sequence. Quiet markets also produce more false breakouts and choppy sessions, which wear down strategies built for movement.
What Causes Market Volatility
Market volatility rises when new information or forced trading hits faster than the market can absorb it. Most of the causes can be named in advance, which is why traders can prepare for volatility even when they cannot predict direction.
- Scheduled economic data. Inflation, jobs and growth reports land at a fixed time. As of November 4, 2026, the next US CPI release (October data) is due Tuesday, November 10, 2026, at 8:30 AM ET.
- Central bank decisions. Interest rate decisions and press conferences can reprice every asset at once. The next Federal Reserve meeting is December 8-9, 2026, as of November 4, 2026.
- Earnings and company news. Results, guidance and deals move individual stocks and, for the largest companies, the indexes.
- Surprises. Geopolitical events, policy announcements, defaults and other shocks arrive without a schedule. These produce the largest moves.
- Liquidity. Thin order books, holiday sessions and overnight hours let the same order flow move price further.
- Positioning and forced flow. When many traders hold the same position, a move against them can trigger stop orders, margin calls and liquidations that push price further than the news alone would.
The part traders tend to miss is that price reacts to the gap between the number and what the market expected, not to the number alone. That is why a "good" report can still produce a sharp sell-off.
Examples of Market Volatility
Real episodes show what volatility looks like when it arrives, and how long it tends to stay. All figures below come from Cboe's daily S&P 500 and VIX histories.
- October 19, 1987. The S&P 500 fell 20.47% in one session, still its largest one-day drop. This predates the VIX history, which starts in 1990.
- The 2008 financial crisis. The VIX closed above 30 for 170 consecutive sessions, from September 15, 2008 to May 18, 2009, with a peak close of 80.86 on November 20, 2008.
- The 2011 debt-ceiling and euro-area stress. The VIX stayed above 30 for 50 sessions, from August 4 to October 13, 2011, peaking at 48.00.
- The March 2020 pandemic crash. The S&P 500 fell 9.51% on March 12, 2020 and 11.98% on March 16, 2020, when the VIX closed at its record 82.69.
- November 2017. The opposite extreme: the VIX closed at 9.14 on November 3, 2017, its lowest close on record.
A sentence using the word in its market sense: "Volatility jumped after the inflation report, so the trader cut her position size in half."
How long volatile periods last
Most spikes are short. Across January 1990 to November 2026, the VIX had 94 separate runs of closes above 30. The median run lasted just 2 sessions, and 71 of the 94 lasted five sessions or fewer.
A few lasted far longer. Eight runs went 20 sessions or more, and the 2008 episode ran 170. Even when the spike ends, the calm does not come straight back: after the March 2020 peak, the VIX took 231 sessions to close below 20 again, on February 12, 2021.
Volatility clustering
Big moves tend to arrive in groups. In Cboe's S&P 500 closing data from January 1990 to November 2026, 6.5% of sessions moved more than 2% in either direction. After one of those days, another 2% day followed within the next five sessions 62.0% of the time, against 21.9% for any random five-session window.
That is volatility clustering. It is the reason a position size chosen during a calm week can be wrong for the next several, and why the day after a violent session is a poor time to assume things are back to normal.
Related lesson: Tail risk and black swan events
Volatility vs Risk
Volatility and risk are related but not the same. Volatility is a measurement of how much price varied. Risk is what that variation can do to you, and it depends on your position size, your stop, your time horizon and your account's rules.
The same volatility is a small risk on one contract and a large one on ten. A 70-point ATR is $350 of typical daily movement on one MES contract and $3,500 on one ES contract. The market's volatility is identical in both cases; the trader's risk is ten times larger in the second.
Time horizon changes the meaning too. FINRA notes that buy-and-hold investors tend to treat volatility as background noise, while someone who needs cash soon can find it a real liability. A short-term trader sits at the far end of that scale, because every swing lands on an open position with a stop and a daily limit attached.
When someone says "the market got risky", the more accurate statement is usually that the market got more volatile and the position did not change size to match.
Related lesson: Risk management for traders
How to Manage Volatility
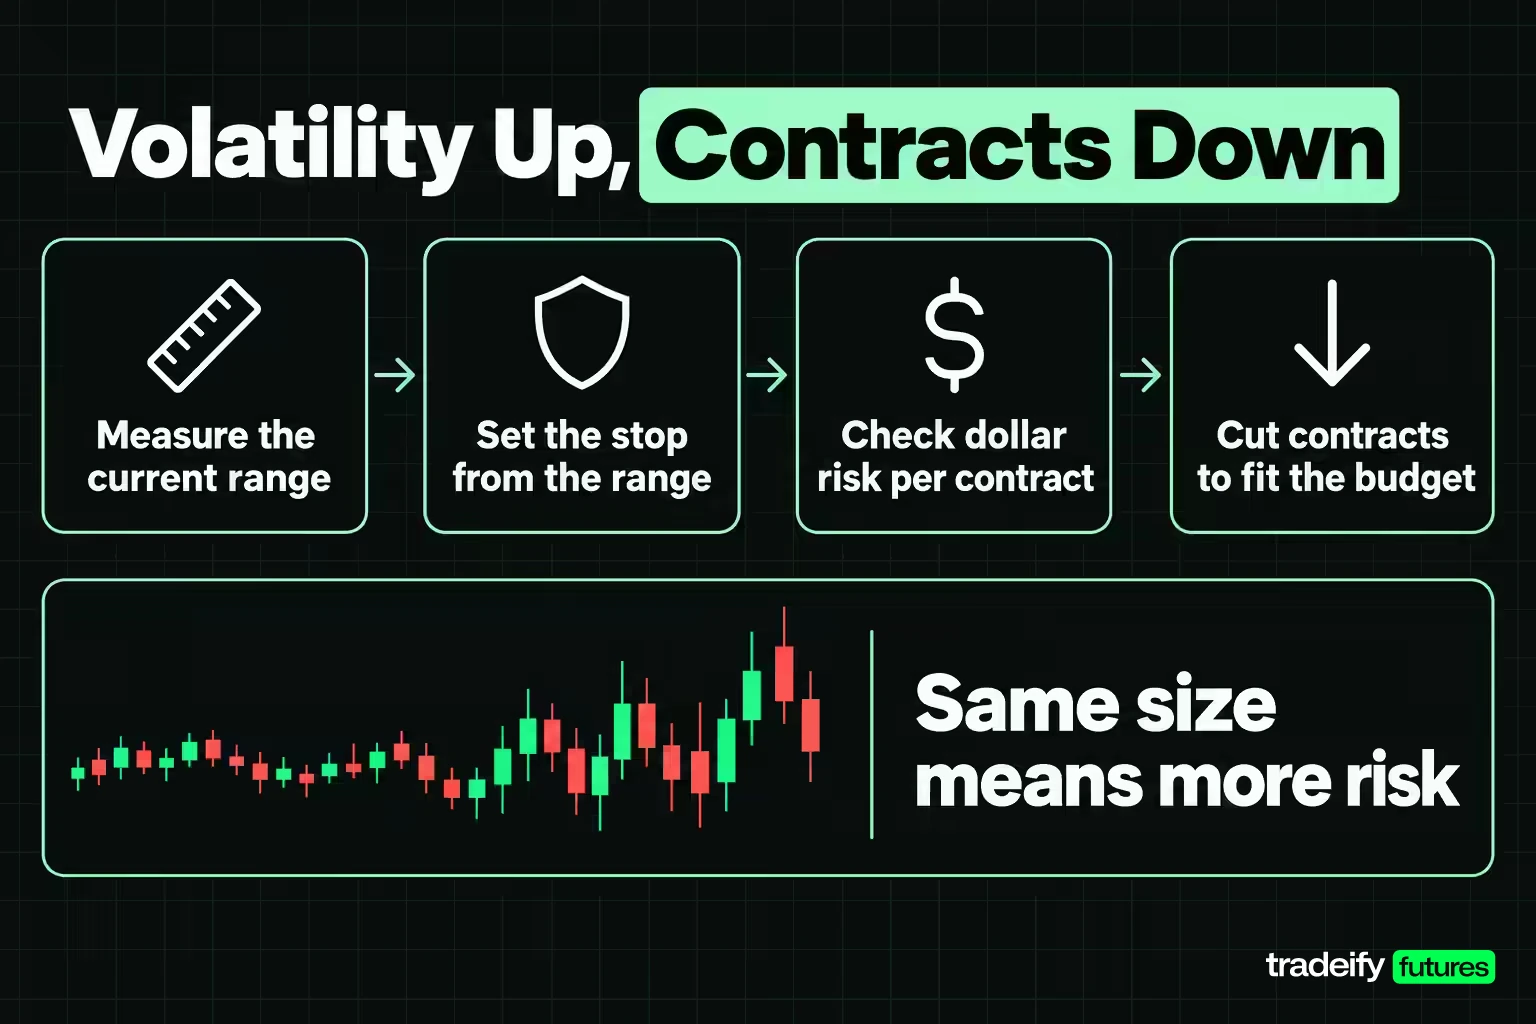
Managing volatility comes down to letting the market's current range set your stop distance, and letting your stop distance set your size. Volatility goes up, contracts go down. The other choice is keeping the same contracts and quietly taking more risk.
Sizing a position when volatility changes
Imagine a $50,000 account with a rule of risking 1% per trade, a $500 budget. The stop sits at half the ATR, a common starting convention rather than a rule, and the trade uses MES at $5 per point.
| Volatility regime | ATR in points | Half-ATR stop in points | Risk per MES contract | Contracts within $500 | Risk at that size | Risk if 8 contracts are kept |
|---|---|---|---|---|---|---|
| Quiet | 25 | 12.5 | $62.50 | 8 | $500 | $500 |
| Normal (worked example) | 70 | 35 | $175 | 2 | $350 | $1,400 |
| Event day | 105 | 52.5 | $262.50 | 1 | $262.50 | $2,100 |
| Shock | 160 | 80 | $400 | 1 | $400 | $3,200 |
In the quiet regime 8 contracts fit the budget exactly. A trader who sets size there and never revisits it takes $1,400 of risk at the 70-point ATR, $2,100 on an event day and $3,200 in a shock. That last figure is 6.4% of the account, or 6.4 times the intended risk, with no change to the setup, the plan or the number typed into the order ticket.
That is the most common way volatility damages an account. It rarely feels like a mistake, because nothing looks different on the screen. The size field says 8, the same as last week, and the risk behind it has more than sextupled.
Stop placement in volatile markets
Stop placement in a volatile market needs a check against the current range, not just the chart. On the E-mini S&P 500, a fixed 12.5-point stop is half the ATR when the ATR is 25 points and about 0.08 ATR when the ATR is 160 points. The same stop that sat outside the noise one week sits deep inside it the next.
A stop that is a small fraction of the day's average range is less a stop than a bet that the market will barely move. The tempting fix is to keep the tight stop and hope. The better order is stop first, from structure or an ATR multiple, then a check against the current range, then the size.
Volatility checks before each session
- Measure before you size. Pull the last 14 to 20 sessions and note the ATR before the session starts.
- Check the calendar. Know when data releases and central bank decisions land, and decide in advance whether you trade through them, stand aside or cut size.
- Expect clustering. After a violent day, assume the next few sessions may stay volatile until the range proves otherwise.
- Respect the spread. In fast markets, check the spread before using a market order; a limit order caps the price you pay.
- Keep long-term money separate. For investors, diversification and a time horizon that matches the money's purpose do more than reacting to each swing.
Related lesson: Volatility-based position sizing
Volatility and Prop Firm Loss Limits
Volatility hits differently on an evaluation or simulated funded account, because the rules are set in dollars while the market sets the range. A typical firm's daily loss limit or trailing drawdown does not widen when the ATR doubles. A trade sized for a quiet week can use up a far bigger share of the distance to that limit when the market speeds up.
Two habits help. Size from the current ATR so each trade's dollar risk stays a fixed share of the loss limit, and treat the daily loss limit as a boundary to stay well inside rather than a stop. In a fast market, slippage on a stop order can carry the loss past the planned figure.
On our accounts, news trading is allowed at your own risk, and we list one volatility product, EUREX VSTOXX futures (FVS), on Tradovate accounts only; VIX futures are not on our product list. Because volatility products tend to move against equities, our hedging rule treats a long equity index position plus a long volatility position as offsetting, so the two cannot be held together.
Related lesson: Daily and weekly loss limits
Volatility FAQ
What is volatility in simple words?
Volatility is how much and how quickly a price swings up and down. A highly volatile market makes big moves in short periods. A low-volatility market moves in small steps.
What does 20% volatility mean?
It means an annualized standard deviation of 20%. That works out to about 1.26% on a typical day. It describes the spread of likely outcomes, not a forecast that price will move 20%.
Is high volatility good or bad?
It is neither on its own. High volatility makes stops more expensive and losses larger at the same size. It also creates bigger moves for strategies built to capture them, so the answer depends on whether your size and stop match the range.
Is volatility the same as a trend?
No. Volatility describes the size of the swings, and a trend describes their net direction. A market can trend steadily with low volatility, or chop violently with no trend at all.
What is volatility in a person?
A volatile person has moods or reactions that change quickly and unpredictably. The dictionary example is "a volatile temper". The finance meaning borrows the same idea of rapid, unexpected change.
Can volatility be predicted?
The level of volatility can be anticipated better than direction can. Volatility clusters, scheduled events are known in advance, and implied volatility shows what the options market expects. Exact moves still cannot be predicted.
Using Volatility in Your Next Session
Volatility becomes useful the moment it changes a number in your plan. Before your next session, pull the last 20 sessions of the market you trade, calculate the ATR, and divide your usual stop distance by it. If the stop is a small fraction of the ATR, or your usual size now risks more than your rule allows, adjust the size before the first trade, not after the first loss.
Related lesson: How to keep a trading journal
This article is educational content, not financial advice or a recommendation to trade any instrument. Futures, options and other leveraged products can lose money quickly, and futures losses can exceed the amount you planned to risk. All worked prices, stops and position sizes here are illustrative examples, and the market statistics are historical, which does not predict future results. Evaluation and funded accounts at prop firms are simulated, and their rules can change, so check current terms before relying on them.


