



TL;DR: Investment return is the gain or loss on money you commit, divided by a base and tied to a period. Pick the base and period first, or one result can print as 0.29% or 2R. Count income, costs, taxes and inflation, and keep deposits out of the gain. Use CAGR or time-weighted return to compare periods, never a simple average.
Investment return is the profit or loss an investment produced, stated as a percentage of the money committed to it. The dollar figure is the raw fact. The return is that fact divided by a base, over a stated period, so it can be compared with something else.
That division is where most mistakes start. Two people can describe the same result honestly and print different numbers, because one divided by the account, one by the position and one by the money at risk. A win is not a result until you say what you divided it by.
This guide fixes the base first, then works through every common formula with numbers you can check by hand. Every example uses round, illustrative figures so you can rerun the math on your own.
What Investment Return Means
An investment return answers one question: how much did this money earn, relative to the money it took? It can be positive (a gain) or negative (a loss), and it covers price changes plus any income the investment paid while you held it.
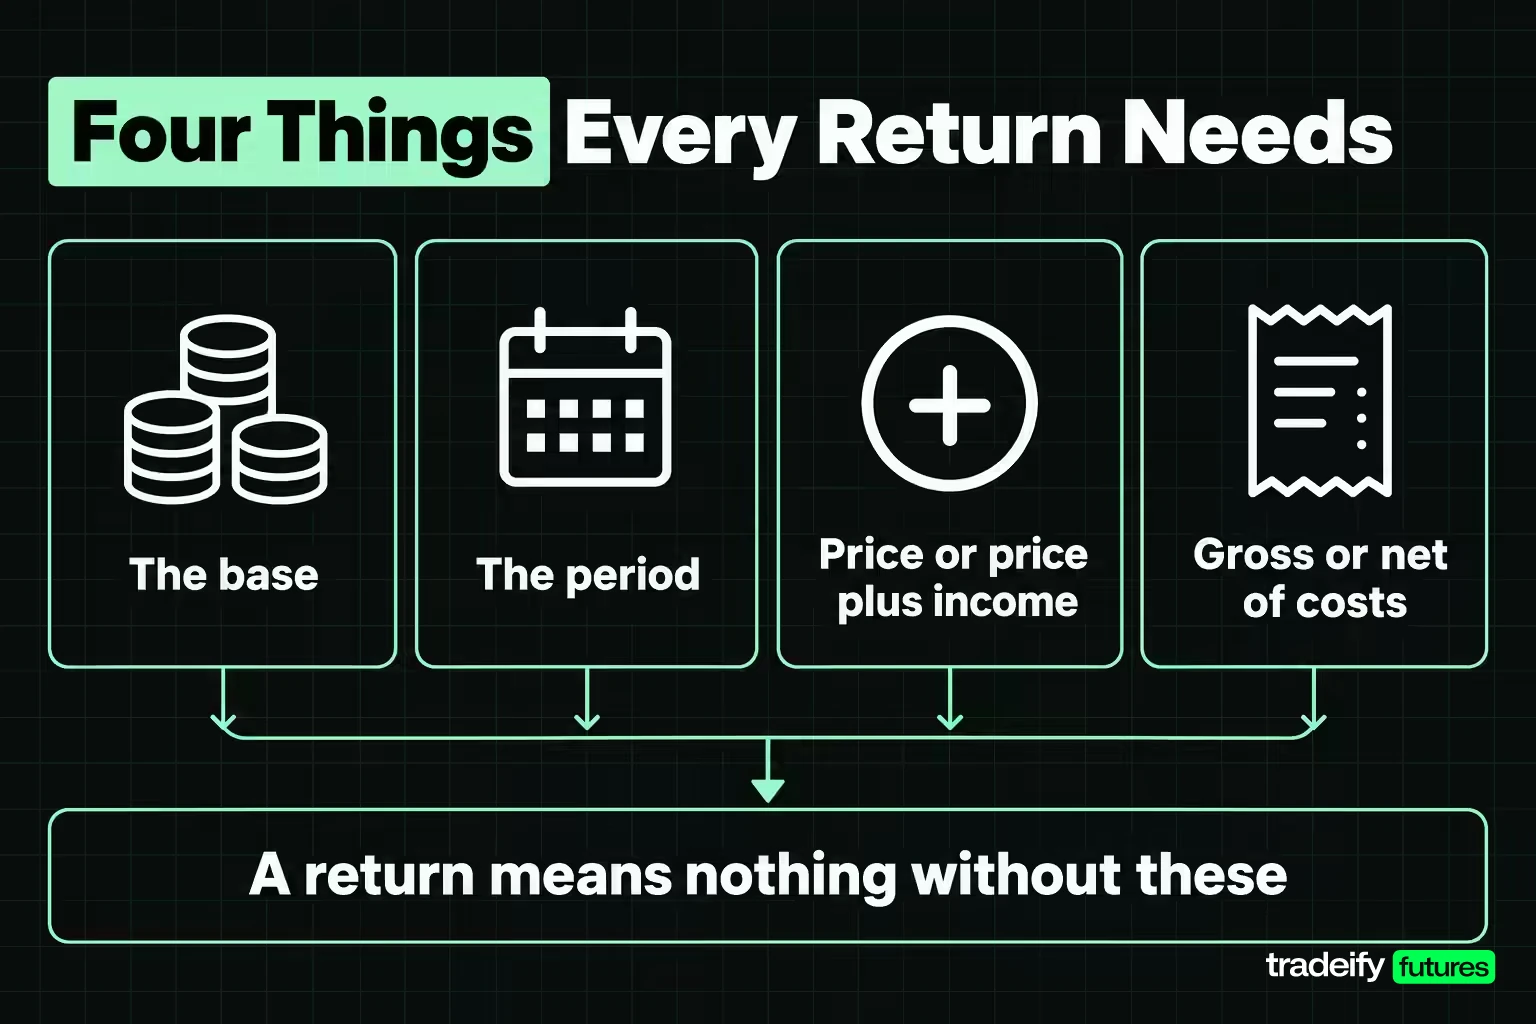
A return figure only means something when four things are stated alongside it.
- The base: what the gain is divided by.
- The period: a day, a year, a decade.
- What is included: price only, or price plus dividends and interest.
- Whether costs are in: gross (before fees and taxes) or net (after).
These are the terms every return formula uses.
| Term | Meaning | Common mistake |
|---|---|---|
| Beginning value | What the investment was worth, or cost, at the start | Leaving out the purchase commission |
| Ending value | What it was worth, or sold for, at the end | Using a price that was never actually received |
| Income | Dividends, interest or distributions paid during the period | Ignoring it, which understates the result |
| Cost basis | Purchase price plus buying costs | Using the quoted price instead |
| Gross return | Result before fees and taxes | Comparing it to someone's net figure |
| Net return | Result after fees, and sometimes taxes | Forgetting which costs were taken out |
| Holding period | How long the money was committed | Quoting a percentage with no period |
Investment return does not measure risk. Two positions can both return 20%, one from a broad index over a decade and one from a single volatile stock over a week. The percentage alone cannot tell them apart, which is why a return figure is never read by itself.
How to Calculate Investment Return
The basic rate of return formula is short.
Rate of return = (ending value − beginning value + income) ÷ beginning value × 100
Here is a worked example with round, illustrative prices.
- Buy 100 shares at $50. Beginning value is $5,000.
- Sell them later at $56. Ending value is $5,600.
- Price gain is $600. Divided by $5,000, the price return is 12.00%.
- Add dividends of $1.20 per share, or $120. Total gain is $720, and $720 ÷ $5,000 is a 14.40% total return.
- Now add a $5 commission on each side. The cost basis becomes $5,005, net proceeds $5,595, and the net gain $710. The net total return is $710 ÷ $5,005, or 14.19%.
Three investment return figures came out of one trade: 12.00%, 14.40% and 14.19%. None is wrong. Each answers a different question, and only the last one is the money that actually reached the account. When you compare yourself with anyone else, make sure you are both quoting the same one.
The rate of return formula gives a total for the holding period. If that period was three months or three years, convert the percentage to a yearly rate before you compare it with an annual figure.
Total Return Includes Income, Not Just Price
Total return is the full gain or loss on an investment over a period, counting price changes plus interest, dividends and other distributions. Price return counts only the change in price.
For a growth stock that pays nothing, the two measures of investment return are the same. For a dividend stock, a bond or a fund, the gap can be most of the result. A bond bought and sold at the same price still produced a return if it paid interest along the way.
Total return also assumes something about reinvestment. Published total-return figures usually treat each dividend as reinvested on the day it was paid, so the income itself starts compounding. If you spent the dividends instead, your personal result is lower than the published total return, even though you held the same thing.
This matters every time someone quotes an index figure. A stock index's price level and its total return are different series, and long-run averages for stocks are usually total-return figures with dividends reinvested. Comparing your price-only result to a total-return benchmark understates how you did; comparing a total-return result to a price index overstates it.
ROI Versus Rate of Return
ROI, or return on investment, is the simplest profitability ratio: net gain divided by the cost of the investment. The cost should include fees and expenses, not just the purchase price.
ROI = (current value − cost of investment) ÷ cost of investment
In practice ROI and rate of return use the same arithmetic. The difference is in how the terms get used. ROI is common for business projects, property and one-off decisions. Rate of return is more common for securities over a stated period.
As a measure of investment return, ROI has three blind spots: it ignores time, inflation and risk. Consider two investments.
- Investment A returns 20% in one year.
- Investment B returns 30% over three years.
On ROI alone, B looks better. Converted to a yearly rate, B earned 9.14% a year compounded, less than half of A's yearly pace. The bigger number won the headline and lost the comparison. ROI is a fine first look, and a poor way to choose between two holding periods of different lengths.
Annual Return and Annualized Return
An annual return measures how much an investment grew, on average, each year during a period, and it is the usual way to compare investment return across holdings. The key word is average, because there are two kinds and they disagree.
The arithmetic average adds up each year's return and divides by the number of years. The annualized return, also called the geometric average, finds the single constant yearly rate that would turn the starting value into the ending value. Annualized return accounts for compounding, so it is the one that matches what happened to the money.
Why Average Annual Return Overstates Growth
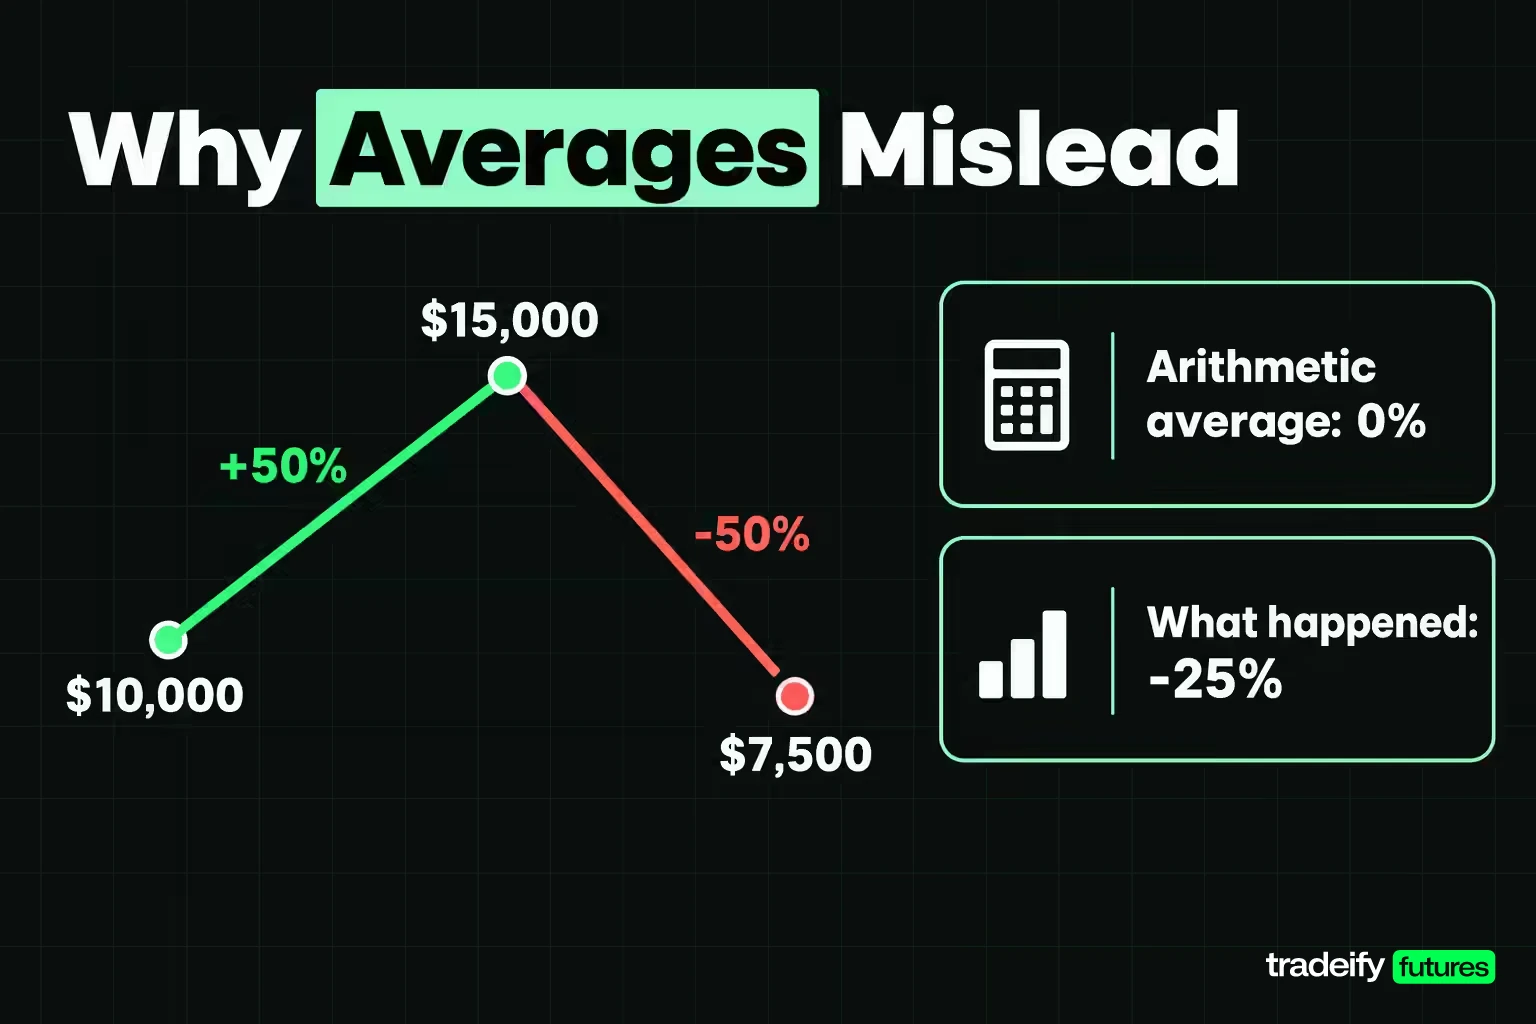
A simple example shows the gap. An investment rises 50% one year and falls 50% the next.
- Arithmetic average: (+50% − 50%) ÷ 2 = 0%.
- What happened: $10,000 became $15,000, then $7,500. That is −25%.
- Annualized return: −13.40% a year.
The arithmetic average says nothing happened. The account says a quarter of the money is gone.
The same gap shows up in real long-run data. Using the annual S&P 500 total returns (dividends included) for 1928 through 2025 in NYU Stern professor Aswath Damodaran's historical returns dataset, the arithmetic average is 11.9% a year, while the compound annualized return is 10.0%. The bigger the swings, the wider that gap. A fund that quotes its "average annual return" without saying which kind may be printing the larger number.
Why Losses Hurt Returns More Than Gains Help
Losses and gains are not symmetric, because the recovery is earned on a smaller balance. A 20% loss followed by a 20% gain ends at 96% of where it started.
| Loss | Gain needed to get back to even |
|---|---|
| 10% | 11.1% |
| 20% | 25% |
| 50% | 100% |
| 43.8% | about 78% |
The last row is the S&P 500's worst calendar year in the Damodaran data, 1931. The deeper the drawdown, the harder the math works against you, which is why risk control and return are the same conversation.
Annualizing a Short Period
Annualizing a short result is where returns get fake, and the temptation is strongest right after a good stretch. A 1% week, multiplied by 52, looks like 52% a year; compounded, it looks even bigger. Either way the math assumes the same result, at the same size, every week for a year, with no losing weeks. One strong week is one line in the sample, not a rate. Report it as the period return it is.
CAGR for Multi-Year Returns
CAGR, the compound annual growth rate, converts a multi-year total return into one constant yearly rate. It is the same idea as an annualized return, written as a formula.
CAGR = (ending value ÷ beginning value)^(1 ÷ years) − 1
Worked example: $10,000 grows to $16,000 over five years. The total return is 60%. CAGR is (16,000 ÷ 10,000)^(1 ÷ 5) − 1, which is 9.86% a year. Check it: $10,000 × 1.0986 five times lands at about $16,000.
CAGR is what makes a five-year investment return comparable with a two-year one. It also hides the path. The S&P 500 lost 9.03%, 11.85% and 21.97% in 2000, 2001 and 2002, about 37% cumulative, and a long-period CAGR that includes those years still prints as one smooth number. CAGR also cannot handle money moving in and out of the account; that needs a time-weighted or money-weighted method.
How Compound Interest Builds Returns
Compound interest is interest paid on the principal and on the interest already earned. Simple interest is paid on the original principal only. Over short periods the two look alike. Over decades they separate sharply.
The compound formula is A = P × (1 + r ÷ n)^(n × t), where P is the starting amount, r the annual rate, n the number of compounding periods per year and t the years.
Here is $10,000 at an illustrative 6% a year.
| Years | Simple interest | Compounded annually |
|---|---|---|
| 10 | $16,000 | $17,908.48 |
| 20 | $22,000 | $32,071.35 |
| 30 | $28,000 | $57,434.91 |
By year 30, compounding has more than doubled the simple-interest result, even though the yearly investment return never changed. Compounding monthly instead of yearly at the same 6% rate lifts the 30-year figure to $60,225.75, because each month's interest starts earning a little sooner.
The Rule of 72
The Rule of 72 is a quick way to estimate doubling time: divide 72 by the annual rate. At 6%, money doubles in about 12 years (the exact answer is 11.9). At 8% it is about 9 years, and at 10% about 7.2 years. It is an estimate for a steady rate, which real markets never deliver, so treat it as a sense-check rather than a plan.
Using an Investment Return Calculator
An investment return calculator projects what money could grow to under assumptions you supply. Most use the same inputs as the SEC's Investor.gov compound interest calculator.
| Input | What it means | What to watch |
|---|---|---|
| Initial investment | Money invested at the start | Use what you will actually invest, after costs |
| Monthly contribution | Amount added each month, or withdrawn if negative | Missed months change the result |
| Length of time | Years the money stays invested | Short horizons swing far more |
| Estimated rate | Annual return you assume | The single biggest driver, and a guess |
| Variance range | Rates above and below your estimate | Run it, because the estimate will be wrong |
| Compound frequency | How often growth is added | Matters less than the rate and the years |
A Worked Calculator Projection
Take an illustrative case: $10,000 invested, $200 added every month, 20 years, 6% a year compounded monthly. The projection is $125,510.22. Of that, $58,000 is money you put in ($10,000 plus $48,000 of contributions) and $67,510.22 is growth.
Now run the variance range of 2 percentage points either side. At 4% the same plan ends at $95,580.75. At 8% it ends at $167,072.11. The rate assumption moved the answer by more than $70,000, while every dollar you contributed stayed the same. That is the honest output of any return calculator: a range driven by an assumption, not a forecast.
Lump Sum Versus Regular Contributions
Contribution timing changes the result. Compare $24,000 invested at once with $200 a month for 10 years, which is the same $24,000 in total, both at an illustrative 6%.
- Lump sum: $43,665.52 after 10 years.
- Monthly: $32,775.87 after 10 years.
The lump sum ends higher because more money is invested for longer. That only holds if the rate is positive and steady, and nobody gets to choose that in advance. Regular contributions spread the entry points, so a sharp fall soon after investing hurts less. Many people contribute monthly simply because that is when they have the money, and the comparison only matters when the full amount is available today.
Planning an Investment Goal With Return Assumptions
An investment return calculator can also run backwards. Start from the amount you need and the date, then see what contribution each rate assumption requires. Plan with a conservative rate and treat a better result as surplus. If the plan only works at the high end of the range, the plan is fragile.
Real Return After Inflation
Nominal return is the investment return you see on a statement. Real return is what that gain buys after prices have risen.
Real return = (1 + nominal return) ÷ (1 + inflation rate) − 1
As of November 2026, the latest US CPI release (September 2026 data, published October 14) showed consumer prices up 3.7% over the prior year. At that rate, an 8% nominal return is a 4.15% real return. The shortcut of simply subtracting (8% − 3.7% = 4.3%) is close at low rates and drifts as inflation rises.
The practical point is about comparison. A 5% savings yield and a 5% bond yield look identical on paper, and in a year with 3.7% inflation both are only about 1.25% in real terms. A return that does not beat inflation still grew the number while shrinking what it buys.
How Taxes and Fees Shrink Investment Return
Taxes and costs turn a gross investment return into the net return you keep. Both compound against you the same way growth compounds for you.
Capital Gains Tax on Returns
In the US, the IRS treats an asset held more than one year as long-term and one held one year or less as short-term. Net short-term gains are taxed as ordinary income. Long-term gains get lower rates of 0%, 15% or 20%, depending on taxable income, and the IRS notes that for 2025 most individuals paid no more than 15%.
On an illustrative $1,000 gain, a 15% rate leaves $850. If the same gain were short-term and your ordinary rate were a hypothetical 24%, you would keep $760. Same trade, different holding period, $90 apart.
Regulated futures contracts follow a separate rule under Section 1256 of the tax code: gains and losses are treated as 60% long-term and 40% short-term no matter how long the position was held, and open positions are marked to market at year end. With the same illustrative 15% and 24% rates, that blends to 18.6%. Losses also have limits: net capital losses beyond your gains can reduce other income by up to $3,000 a year ($1,500 if married filing separately), with the rest carried forward. Tax rules depend on your situation, so check with a tax professional before relying on any of this.
Fees and Investment Return Over Time
A 1% annual cost looks small. Here is $10,000 compounding for 30 years at an illustrative 7% gross, against the same 7% with 1% a year taken out in fees.
| Annual cost | Value after 30 years |
|---|---|
| 0% (7% net) | $76,122.55 |
| 1% (6% net) | $57,434.91 |
The fee took $18,687.64, nearly a quarter of the ending value. Fund expense ratios, advisory fees, commissions and spreads all sit in this column.
How Deposits and Withdrawals Distort Account Returns
Account returns get bent the moment money moves in or out. The account grew, but how much of that growth came from the market and how much came from you?
Take an illustrative account that starts the year at $50,000, receives a $10,000 deposit at mid-year and ends the year at $63,000. There are five reasonable ways to report it.
| Method | Calculation | Return |
|---|---|---|
| Endpoints, deposit ignored | $13,000 ÷ $50,000 | 26.00% |
| Deposit removed from the gain | $3,000 ÷ $50,000 | 6.00% |
| Deposit added to the base | $3,000 ÷ $60,000 | 5.00% |
| Half-year weighting of the deposit | $3,000 ÷ $55,000 | 5.45% |
| Time-weighted | 1.0400 × 1.0161 − 1 | 5.68% |
The first row is the flattering one, because $10,000 of the ending balance came from a deposit, not the market. It is also the number most people quote without thinking. The spread between 26.00% and 5.00% is 21 percentage points on identical facts.
The time-weighted row needs one more piece of data: the account value just before the deposit. Here it was $52,000, so the first half returned 4.00%. After the deposit the account held $62,000 and ended at $63,000, a 1.61% second half. Linking the two halves removes the effect of the deposit completely, which is why funds report time-weighted returns. A money-weighted return, the half-year weighting row, instead reflects when your money was in, so it describes your own result, timing included.
For your own records, the fix is simple. Log every deposit and withdrawal on its own dated line and never let it fall into the gain.
Measuring Return on a Leveraged Futures Trade
Leveraged instruments make the base problem obvious, because a futures contract controls far more value than the money it ties up. One trade can honestly print as a tiny percentage or a big multiple.
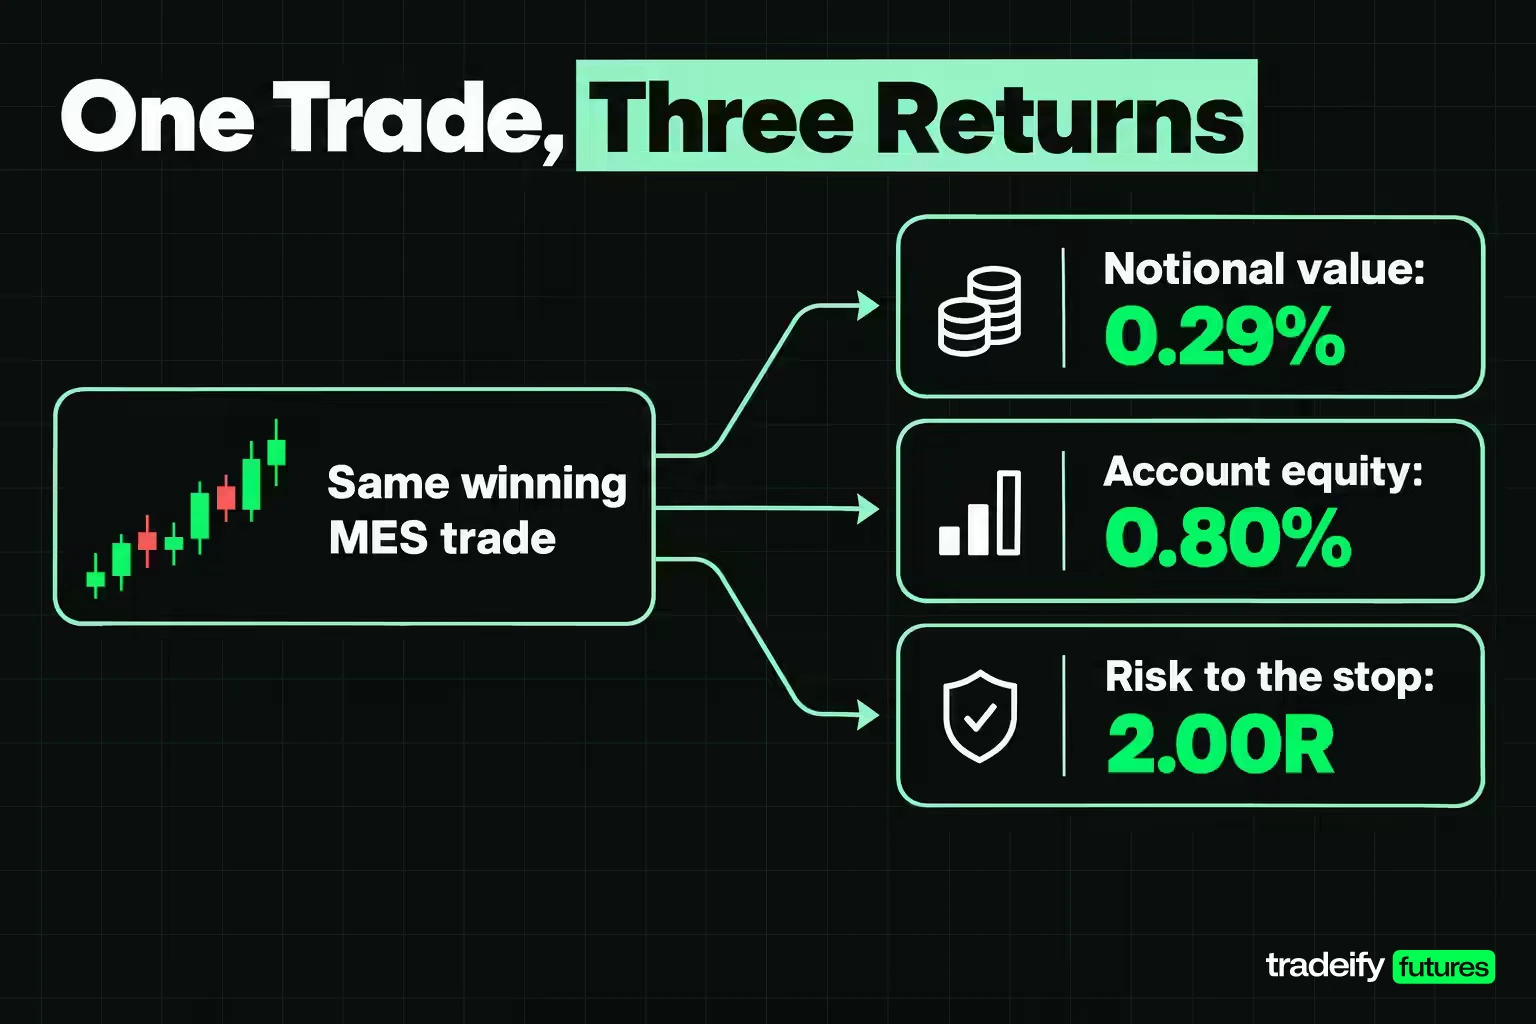
The Micro E-mini S&P 500 (MES) is valued at $5 times the S&P 500 index, with a minimum tick of 0.25 index points, or $1.25, per CME Group's contract specifications. Take an illustrative trade: 4 MES bought at 7,000.00 and sold at 7,020.00, with a 10-point stop, in a $50,000 account. The gain is 20 points × $5 × 4 = $400.
| Base | Value | Return |
|---|---|---|
| Notional value controlled | 4 × 7,000 × $5 = $140,000 | 0.29% |
| Account equity | $50,000 | 0.80% |
| Capital risked to the stop | 4 × 10 points × $5 = $200 | 2.00R |
Every row is true. A trader quoting 2R and an investor reading it as 200% are talking about different things, and a reader comparing 0.80% of an account to a stock fund's yearly return is comparing a single trade to a year. Pick the base before you judge the trade, not after you see which one looks best.
Costs in R and the Break-Even Win Rate
Costs change the R figure on a futures trade. Take the same illustrative 4-contract MES trade: a 20-point gain worth $400, a 10-point stop risking $200, so 2.00R before costs. With an assumed $1.50 per contract round-turn commission (illustrative, not a quote), four contracts cost $6.00. The net gain is $394.00, or 1.97R. A losing trade to the stop costs $406.00, or 1.03R.
That small difference moves the break-even win rate. With no costs, a 2R target needs to win 33.33% of the time to break even. With these costs it needs 34.33%: a full point of win rate, bought by six dollars a trade. Slippage adds to the same column and is often larger than commission.
Each base serves a different decision.
| Question | Return to use |
|---|---|
| Was the decision good? | R multiple, since it ignores position size |
| Did the account grow? | Percent of account equity |
| Am I inside my risk rules? | Percent of equity or dollars, matching how the rule is written |
| How big was the exposure? | Notional value |
Related lesson: What Is Notional Value?
Historical Returns by Asset Class
Historical returns give a starting point for a reasonable investment return assumption, not a promise. Here are compound annual returns and volatility for 1928 through 2025, computed from the annual figures in Damodaran's dataset (updated January 2026).
| Asset class | Compound annual return | Standard deviation | Worst year | Losing years of 98 |
|---|---|---|---|---|
| S&P 500 with dividends | 10.0% | 19.4% | −43.8% (1931) | 26 |
| US small caps | 12.0% | 38.0% | −53.9% (1937) | 34 |
| Baa corporate bonds | 6.6% | 7.7% | −15.7% (1931) | 16 |
| Gold | 5.6% | 21.5% | −32.6% (1981) | 34 |
| 10-year Treasury bonds | 4.5% | 7.9% | −17.8% (2022) | 20 |
| Real estate | 4.2% | 6.2% | −12.0% (2008) | 15 |
| 3-month Treasury bills | 3.4% | 3.0% | +0.03% (2014) | 0 |
Higher long-run return came with bigger swings and deeper bad years. The averages also hide how rarely an average year shows up: only 17 of the 98 S&P 500 years landed between 5% and 15%, while 36 were above 20%.
How Time Horizon Changes the Range of Returns
Time horizon is how long the money stays invested, and it changes how wide the range of outcomes is. In the same S&P 500 series, 26 of 98 single years were negative. Over rolling five-year windows, 11 of 94 were negative, the worst at −12.7% a year. Over 10-year windows, 5 of 89 were negative, the worst being 1929 through 1938 at −1.7% a year. Over 20-year windows, none of 79 were negative; the worst, 1929 through 1948, still returned 2.4% a year.
Longer horizons narrowed the range in this history. They did not remove the risk of a bad decade, and history is not a guarantee about the next 20 years.
Diversification and Portfolio Return
A portfolio's return is the weighted mix of what each holding returned. Diversification, as Investor.gov puts it, is spreading money among different investments to reduce risk, across asset classes and within them. In the Damodaran data, 2008 shows why: the S&P 500 fell 36.55% while 10-year Treasury bonds gained 20.10%. A portfolio holding both fell less than one holding stocks alone.
Diversification lowers the chance that one holding drives the whole result. It does not guarantee a gain or protect against every loss; in 2022 stocks and bonds fell together.
Which Investment Return Figures to Track in a Journal
A usable investment return record keeps a few figures apart instead of blending them into one headline number.
- For each closed trade or sale: the dollar result, the net return after costs and, for active trading, the R multiple.
- For the account: percent change per period, with deposits and withdrawals on their own dated lines.
- For multi-year holdings: total return including income, and CAGR.
- For planning: real return after inflation and after tax.
- Realized and unrealized results in separate columns.
It takes a few seconds per entry. The alternative is a record that flatters you in good months and confuses you in bad ones.
Here is one thing to do before your next review: take the last 20 closed results and compute each one three ways, against the account, against the amount risked and against the full position value. If the three tell different stories about the same month, you have found the base problem, and you now know which number answers which question.
On our accounts, evaluations and Sim Funded accounts are simulated, and the key rules are written in dollars, not percent. A 50K Growth funded account, for example, has a $2,000 end-of-day trailing drawdown, which works out to 4% of the starting balance. So on our accounts the return figure that matters most each day is how much of that dollar drawdown a trade used, alongside its R multiple.
Investment Return FAQ
Is 5% a good return on an investment?
A 5% return is solid for low-risk cash or bonds and modest for stocks, once you account for the period and inflation. Over 1928 to 2025, 3-month Treasury bills compounded at 3.4% a year and 10-year Treasury bonds at 4.5%, so a low-risk 5% would have been strong by that history. With inflation at 3.7% (September 2026 CPI), a 5% nominal return is only about 1.25% in real terms.
What is a diversified portfolio?
A diversified portfolio spreads money across different asset classes, such as stocks, bonds and cash, and across many holdings within each class. The goal is that one weak holding or sector does not drive the whole result. It reduces risk but does not eliminate losses.
How much do I need to invest in stocks to make $1000 a month?
At an illustrative 4% annual yield you would need about $300,000, because $1,000 a month is $12,000 a year. At 5% it takes about $240,000. Dividends and prices change, so income from stocks is never fixed.
What is the best investment for beginners?
The best investment for a beginner is one that fits the goal, the time horizon and the losses they can tolerate, and no single product fits everyone. Many beginners start by learning how diversified, low-cost funds work before choosing individual assets, because one fund can spread money across many holdings. Whatever you choose, judge its investment return net of costs and inflation over a stated period.
How much return do I need to recover a loss?
You need a larger percentage gain than the loss, because the recovery is earned on a smaller balance. A 20% loss needs a 25% gain, and a 50% loss needs a 100% gain to get back to even.
This article is educational and is not financial, tax or investment advice. Historical and illustrative returns do not predict future results. Futures and other leveraged products can lose money quickly, losses can exceed what you expect, and evaluations and funded accounts described here are simulated. Verify current rules, costs and tax treatment before acting on any figure.


