



TL;DR: Calendar spreads sell a near-term option and buy a later one at the same strike, so price location and time decide the result. A long calendar risks only its debit, $134 in this guide's 30/60-day example, and peaks near the strike at the front expiration. It is long vega, so falling back-month implied volatility can erase the time-decay edge. Close or roll before the short option expires.
Calendar spreads pair two expirations on the same underlying. You sell the nearer option, buy a later one of the same type and strike, and pay a net debit for the difference. The pitch sounds simple: the short option bleeds time value faster than the long one, so you collect the difference.
That is only half the trade. A calendar spread needs price to sit near a chosen strike on a specific date, and it needs the later option to still be worth something when the near one expires. You can read the market correctly, see the move come a week early, and still lose money. Timing is the whole trade here, not a detail.
This guide covers long and short option calendars, the Greeks, implied volatility, expiration choices and order entry, then how calendar spreads work in futures markets, where the same name means something different.
What Calendar Spreads Are
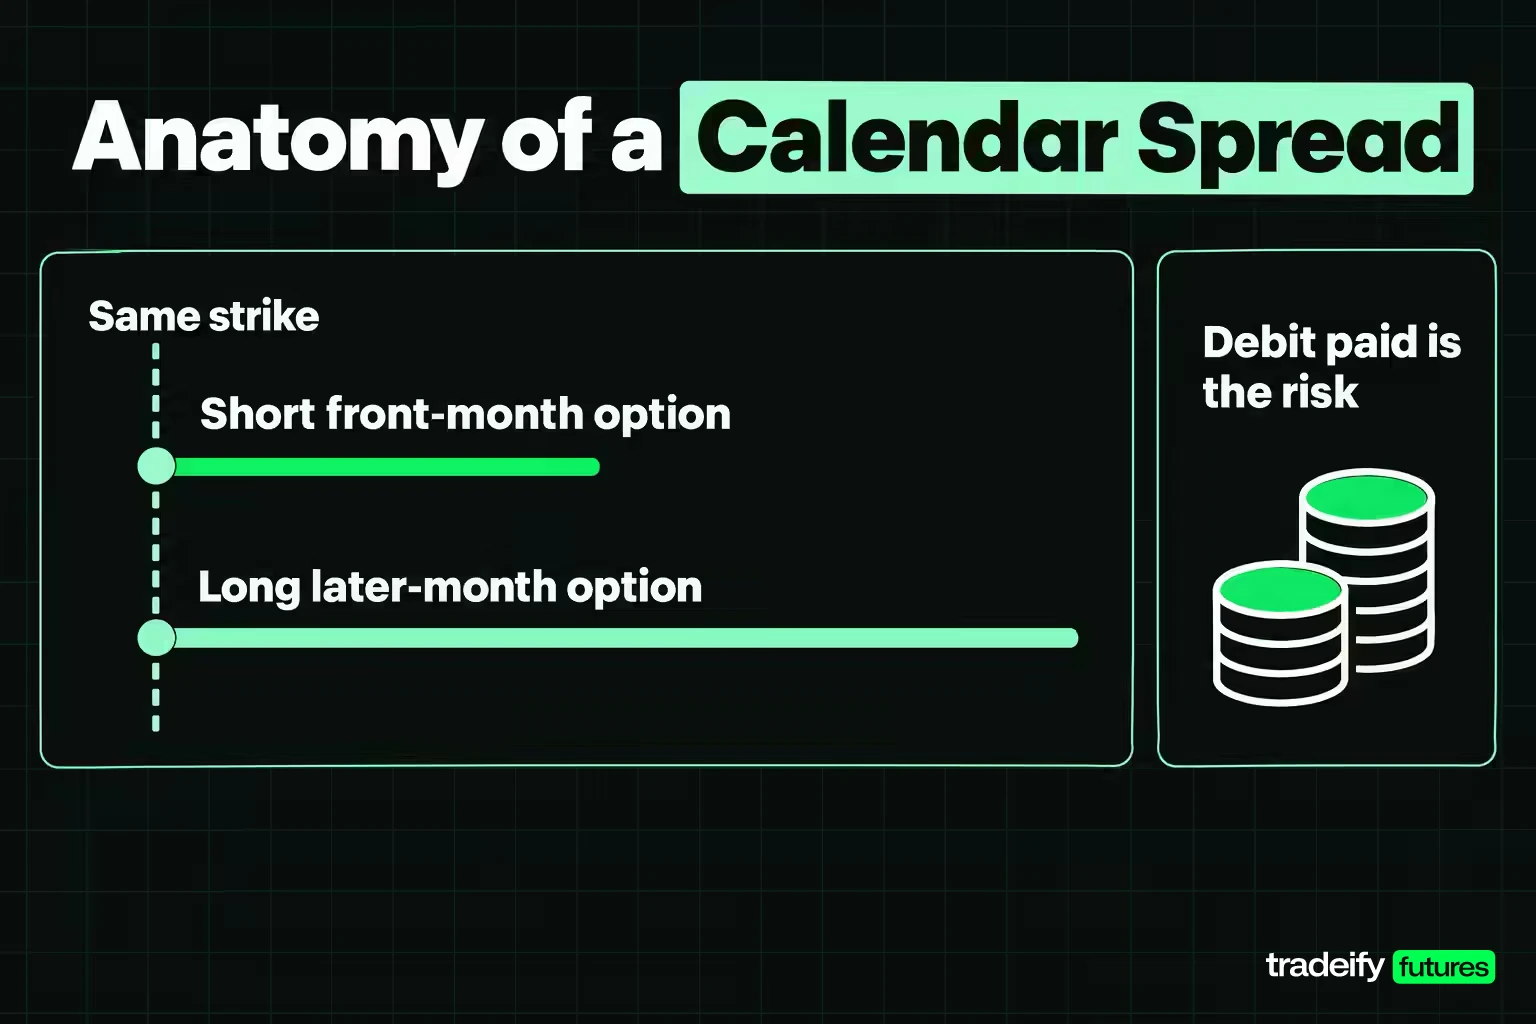
A calendar spread, also called a time spread or horizontal spread, combines a short option and a long option that differ only in expiration. The Options Industry Council (OIC) describes the long call calendar as short one call and long a second call with a more distant expiration, most commonly at the same strike. CME Group uses the same structure for options on futures.
A standard long calendar has four matching details and one deliberate difference:
- Same underlying.
- Same option type (both calls or both puts).
- Same strike price.
- Same contract quantity.
- Different expiration dates, with the short leg expiring first.
Because the later option has more time value, buying it and selling the nearer one at the same strike always costs a premium. OIC notes that a same-strike long calendar "will always require paying a premium to initiate the position." That debit is what you put at risk.
How a calendar spread works over time
The two legs age at different speeds. As the front option nears expiration its time value drains quickly, while the later option, with weeks still to run, loses value more slowly. If price stays near the strike, the gap between the two options widens, and that widening is the profit.
At the front expiration the short option either expires worthless, carries intrinsic value, or gets assigned. The long option is still alive. What the trade is worth at that point depends almost entirely on what the market will pay for that remaining option.
A Worked Calendar Spread Example
A calendar spread is easier to judge with real arithmetic in front of you. The prices below are illustrative values from a Black-Scholes model (stock at $100, 25% implied volatility, 4% interest rate, no dividends), not market quotes.
- Sell one 30-day 100 call at $3.02.
- Buy one 60-day 100 call at $4.36.
- Net debit is $1.34, or $134 per spread because a standard equity option covers 100 shares.
Calendar spread value at the front expiration
At the 30-day expiration the short call is settled at intrinsic value and the long call has 30 days left. Assuming implied volatility stays at 25%, the spread is worth:
| Stock at front expiration | Spread value | Profit or loss per spread |
|---|---|---|
| $90 | $0.24 | -$110 |
| $95 | $1.05 | -$29 |
| $100 | $3.02 | +$168 |
| $105 | $1.33 | -$1 |
| $110 | $0.62 | -$72 |
Max profit, max loss and breakeven for a calendar spread
Max loss is the $134 debit plus costs, as long as both legs stay intact. OIC says the maximum loss comes when the two options reach parity: price falls far enough that both are nearly worthless, or rises far enough that both trade near intrinsic value.
Max profit is not fixed at entry. It peaks when price sits at the strike on the front expiration, here a modeled $168 on $134 risked. That figure depends on the 30-day call's value at that moment, which no one can know in advance.
The modeled breakevens are about $96 and $105. They are estimates, not formulas like the strike-plus-premium breakeven of a single long call, because they move with the implied volatility assumption.
Why direction alone does not pay a calendar spread
Look at the $105 row in the illustrative 30/60-day call calendar. The stock rose, a call buyer would be happy, and the calendar still lost a dollar. Both calls held similar intrinsic value at $105, so the gap between them shrank. Direction alone does not pay a calendar spread; location on the right date does.
Reading a Calendar Spread Profit and Loss Diagram
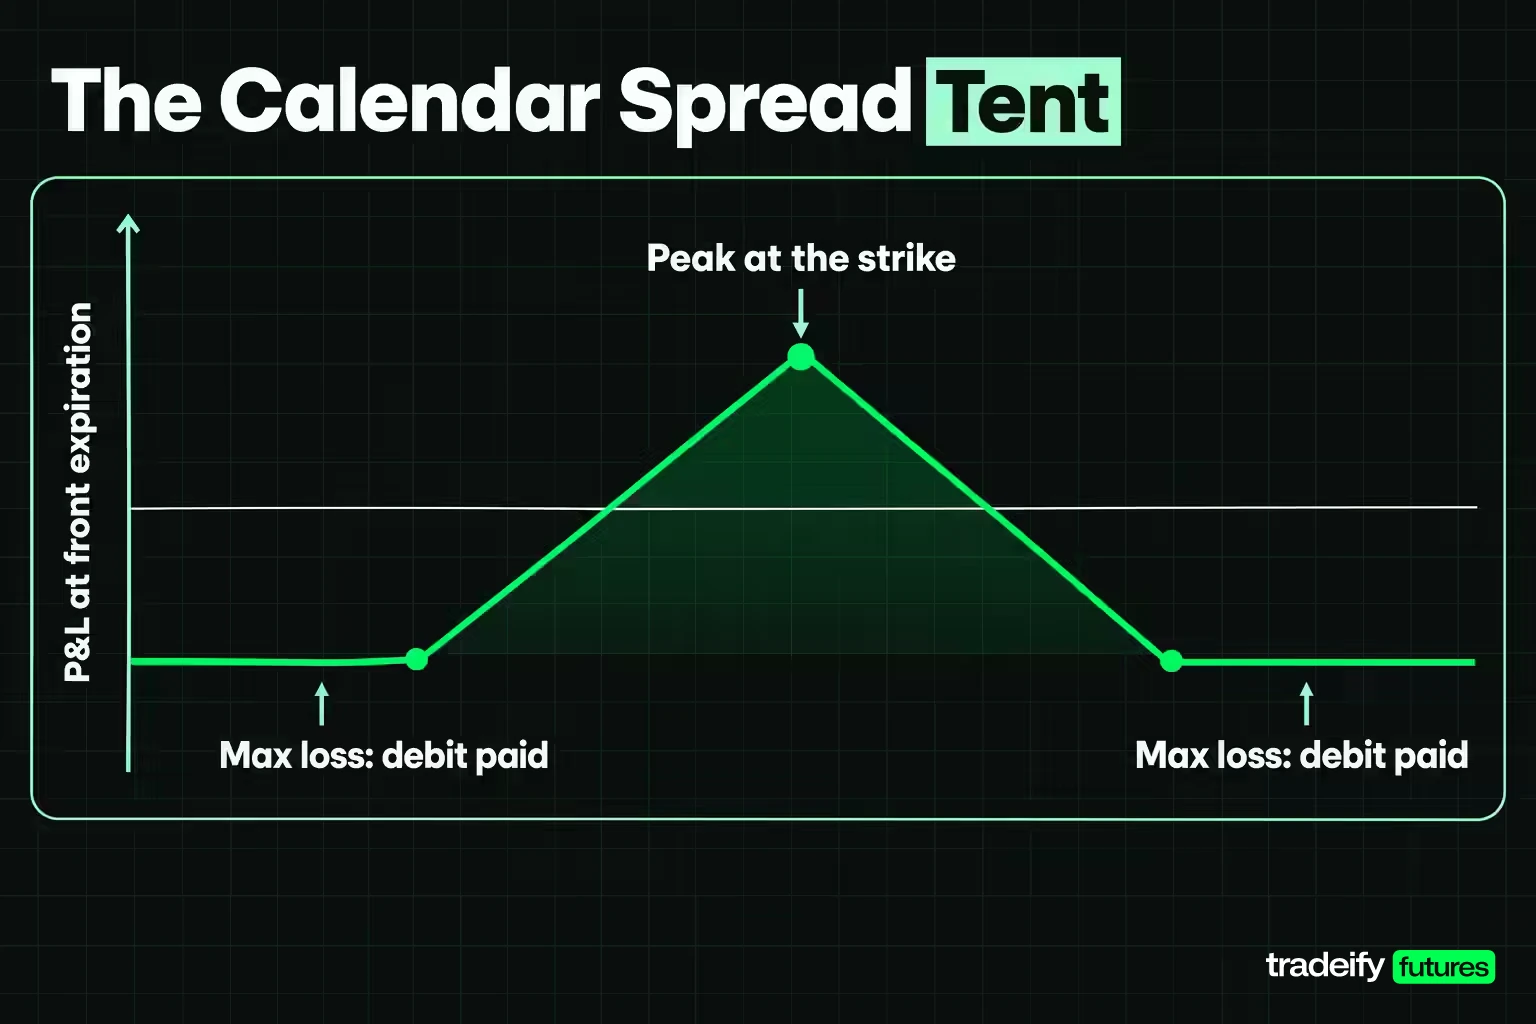
A calendar spread profit and loss diagram is drawn at the front expiration, not at the final one, and it looks like a tent. The peak sits at the strike, losses grow as price moves away in either direction, and the floor is the debit paid.
The tent is a model output. Change the implied volatility you assume for the remaining option and the whole shape moves:
| Remaining option IV | P&L at $90 | P&L at $95 | P&L at $100 | P&L at $105 | P&L at $110 | Approximate breakevens |
|---|---|---|---|---|---|---|
| 20% | -$126 | -$71 | +$111 | -$43 | -$91 | $97.50 and $103 |
| 25% | -$110 | -$29 | +$168 | -$1 | -$72 | $96 and $105 |
| 30% | -$87 | +$17 | +$225 | +$46 | -$45 | $94.40 and $107 |
Same trade, same prices, and the profit zone more than doubles in width between the 20% and 30% rows. A risk graph without a stated volatility assumption is a guess dressed as a chart. If your thesis only works on the 30% row, it is a volatility bet, and you should know that before you click buy.
Why an early move hurts a calendar spread
A calendar spread payoff diagram drawn at the front expiration hides timing. Take the illustrative 30/60-day 100-strike call calendar bought for $1.34 with the stock at $100. If the stock jumps to $110 on day 10, with 20 days left on the short call and 50 on the long, the spread is worth about $0.88, a $46 loss. A drop to $90 on day 10 leaves it near $0.54, an $80 loss.
Most broker platforms can draw extra curves for dates before expiration. Look at at least one. A calendar can sit underwater for most of its life and only reach the peak in the last few days, and that stretch is where traders bail on a trade that was working as designed, or hold one that already broke.
Calendar Spread Greeks
The Greeks explain why calendar spreads have a tent-shaped payoff. These are model values for an illustrative 30/60-day 100-strike call calendar on a $100 stock at 25% implied volatility (per contract, 100 shares):
| Greek | Short 30-day call | Long 60-day call | Net calendar spread |
|---|---|---|---|
| Delta | 0.53 | 0.55 | +0.01 |
| Gamma | 0.056 | 0.039 | -0.016 |
| Theta per day | -$5.34 | -$3.91 | +$1.43 |
| Vega per IV point | $11.40 | $16.07 | +$4.67 |
What each Greek means for a calendar spread
- Delta near zero means the at-the-money calendar starts close to direction-neutral. That changes fast once price moves.
- Negative gamma is the cost of the trade. The short near-term option gains delta faster than the long one, which is why large moves either way hurt. OIC notes the near-term at-the-money call has the lower delta but higher gamma.
- Positive theta is the income engine. The short call loses $5.34 a day in this model while the long call loses $3.91, so the spread gains about $1.43 a day if nothing else changes.
- Positive vega is the hidden exposure. The longer option carries more vega, so the spread gains about $4.67 for each one-point rise in implied volatility and loses about the same for each one-point fall.
The practical read: an at-the-money long calendar is long time, long volatility and short movement. If you expect a big move soon, this is the wrong structure, no matter how cheap the debit looks.
Related lesson: How the option Greeks work together
How Implied Volatility Moves Calendar Spreads
Implied volatility often matters more to calendar spreads than the clock. OIC calls a rise in implied volatility "extremely positive" for the long calendar, because longer-dated options have higher vega. It also warns that the near and far options "could and probably will trade at different implied volatilities."
That warning is the key to reading calendar spreads in practice. You are not trading one volatility number. You are trading the gap between two points on the volatility term structure.
Calendar spreads around scheduled events
Front-month options often carry extra implied volatility ahead of a known event such as an earnings release or an economic report. A calendar that sells that inflated front month and buys a calmer back month is a common setup.
Illustrative model: the 30-day 100 call trades at 35% IV ($4.16) and the 60-day call at 28% IV ($4.85), for a $0.69 debit. The day after the event, the front month falls to 22% IV and the back month to 24%.
- Stock unchanged at $100: spread worth $1.54, a gain of $85.
- Stock at $108: spread worth $1.10, a gain of $41.
- Stock unchanged, but the back month also drops to 18% IV: spread worth $0.58, a loss of $11.
The last line is the trap. The front-month crush you expected happened, and the trade still lost because the back month deflated too. You were right about the event and wrong about the spread. Check how much event premium sits in the back month before assuming it will hold.
When falling volatility hurts calendar spreads
Volatility can also fall without an event. In the base example, a five-point drop in both legs right after entry (25% to 20%) costs the spread about $0.23, or $23, before any time passes. Calendars do best when implied volatility is low relative to its own history and the back month has room to hold or rise.
Are Calendar Spreads Bullish, Bearish or Neutral
An at-the-money calendar spread is a neutral trade for the life of the front option. The strike you choose turns it into a directional one. OIC frames the long call calendar as near-term neutral to slightly bearish with a longer-term bullish view, and the long put calendar as the reverse.
Market conditions that suit a long calendar spread:
- A range or slow drift expected through the front expiration.
- Implied volatility that is low or steady, with no reason for the back month to deflate.
- A known event that may move the market less than the front-month premium implies.
- A view that a larger move comes later, after the short option expires (CME's own course example).
Conditions that work against it: an expected breakout soon, a back month already rich in event premium, or a schedule that keeps you from watching the position into the front expiration. If you cannot say where price should be and when, waiting is a valid decision.
Strike selection for calendar spreads
The strike on a calendar spread is a price target for the front expiration, not a default. Illustrative model values for 30/60-day calendars on a $100 stock at 25% implied volatility, with P&L measured at the front expiration:
| Calendar spread | Debit | P&L if stock at $95 | P&L if stock at $100 | P&L if stock at $105 |
|---|---|---|---|---|
| 100 call (at the money) | $1.34 | -$29 | +$168 | -$1 |
| 105 call (out of the money) | $1.16 | -$87 | +$1 | +$201 |
| 95 put (out of the money) | $0.84 | +$172 | +$6 | -$60 |
An out-of-the-money call calendar is a mildly bullish bet on price drifting up to the strike. An out-of-the-money put calendar is the mildly bearish version. Pick the strike where you think price will be on the front expiration date, then check whether the debit is worth that target.
Call vs Put Calendar Spreads
Call and put calendar spreads at the same strike behave almost identically on paper. In the model, the 100 put calendar costs $1.02 against $1.34 for the call calendar, yet its front-expiration P&L (-$30 at $95, +$167 at $100, -$2 at $105) nearly matches the call version. Put-call parity links the two.
The differences show up in practice:
- Dividends and early assignment. OIC notes early assignment of a short call generally comes around an ex-dividend date, while a short put is generally assigned early only when deep in the money.
- What assignment leaves you holding. A short call assigned leaves you short shares; a short put assigned leaves you long shares.
- Skew and liquidity. Put and call implied volatilities at the same strike can differ, and one side of the chain may have tighter markets.
A common habit is to use calls for strikes above the current price and puts for strikes below it, so the short leg starts out of the money. That keeps assignment risk lower early in the trade.
Choosing Expiration Dates for a Calendar Spread
The expiration pair sets how fast calendar spreads gain or lose value. A short-dated front month decays fast but brings heavy gamma; a longer back month adds vega and cost. Model values for an at-the-money 100 call calendar at 25% IV, per spread:
| Front and back days | Debit | Net theta per day | Net vega per IV point | Net gamma |
|---|---|---|---|---|
| 7 and 35 | $1.86 | $5.81 | $6.79 | -0.064 |
| 14 and 42 | $1.58 | $3.06 | $5.67 | -0.035 |
| 30 and 60 | $1.34 | $1.43 | $4.67 | -0.016 |
| 30 and 90 | $2.41 | $2.06 | $8.21 | -0.024 |
| 60 and 120 | $1.99 | $1.01 | $6.50 | -0.012 |
How to read the table:
- Very short front months (7 days) collect the most theta but carry about four times the gamma of a 30/60 pairing. A small move can wipe out a week of decay.
- Stretching the back month (30/90 versus 30/60) raises the debit and the vega. You are making a bigger volatility bet.
- Longer pairs (60/120) are slower and calmer, with less daily decay to show for it.
Check the calendar before choosing dates. Know which earnings release, economic report or dividend falls inside each leg's life, because an event inside the back month but outside the front month changes how the spread reacts.
How to Place a Calendar Spread Order
Enter calendar spreads as one spread order, not two separate trades. The OCC's options disclosure document warns that it "may at times be impossible simultaneously to execute transactions in all of the options involved in the combination," and that one leg can fill while the other does not.
- Confirm both legs: same underlying, same type, same strike, same quantity, short leg expiring first.
- Check the bid-ask width on each leg. Two wide markets mean two costs on the way in and two on the way out.
- Choose the spread order type (often labelled calendar or time spread) and enter the net debit as a limit price, usually starting near the midpoint of the spread's own bid and ask.
- Review the risk graph at the front expiration with at least two volatility assumptions.
- Write down the exit plan, including what you will do before the short option expires.
Calendar spread margin and approval
Under FINRA Rule 4210, a spread qualifies for spread margin only when the short option expires on or before the long option, and the long option must be paid for in full. Brokers may set stricter house rules and usually require a higher options approval level for spreads than for buying single options. Check your broker's requirements before placing the order.
Related lesson: Liquidity and bid-ask spreads in options
Managing a Calendar Spread at Front-Month Expiration
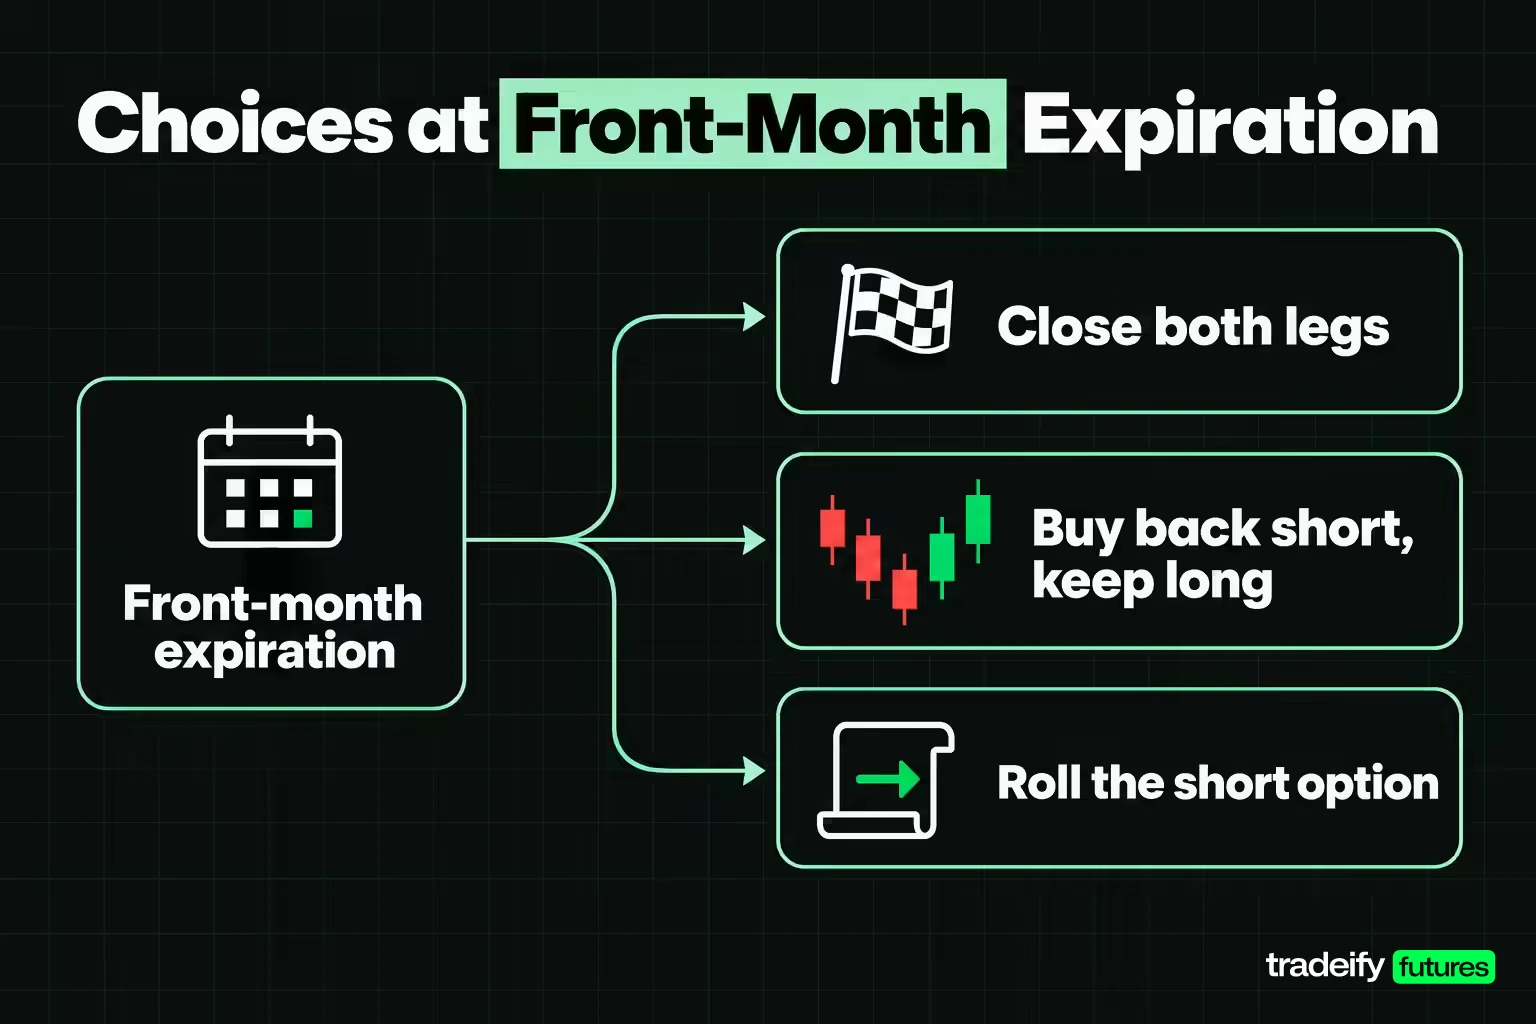
The front-month expiration is the decision point for all calendar spreads. Pick a default action before entering:
- Close both legs before the short option expires. This is the cleanest way to take the result and avoid assignment.
- Buy back the short option and keep the long option. The position becomes a plain long call or put, with new directional risk and full time decay.
- Roll the short option to a later expiration. Treat this as closing one trade and opening another; it needs its own reason.
Assignment risk in calendar spreads
A short American-style option can be assigned on any day before expiration. OIC notes that for a short call this usually happens around an ex-dividend date, and that covering the assignment with the long option means holding a short stock position for one business day. For a short put, early assignment generally comes when it is deep in the money and leaves you holding long stock.
Assignment does not end the trade cleanly. It turns a defined two-option position into stock plus a long option, with a different risk profile and possibly a margin call. Brokers allocate assignments by fixed procedures, often random selection, so you cannot predict who gets assigned.
On options on futures, exercise and assignment create futures positions instead of stock. An E-mini S&P 500 option, for example, exercises into one E-mini S&P 500 futures contract worth $50 per index point. Check which futures month each leg is tied to before trading a futures-option calendar.
Related lesson: Options assignment risk
Calendar Spread Risks and Common Mistakes
Long calendar spreads limit dollar risk to the debit while both legs stay intact. That limit is real, but losing the full debit is still a 100% loss of the money committed.
Common mistakes traders make with calendar spreads:
- Treating theta as guaranteed income. Price and volatility moves can overwhelm it in a day.
- Ignoring the term structure. A back month that deflates can sink a trade even if the front month behaves.
- Trusting one risk graph. Each graph assumes a volatility level; test more than one.
- Choosing a strike without a target. An at-the-money strike is a choice, not a default.
- Holding the short option into expiration with no plan for assignment.
- Rolling automatically. Each roll adds debit and extends a thesis that may already be wrong.
- Trading illiquid chains. Four fills (two in, two out) on wide markets can eat most of the modeled profit.
- Sizing up because the debit looks small. Ten $134 spreads are $1,340 at risk, and they all lose together.
- Calling the trade wrong too late. Decide in advance what invalidates it: price leaving a range, the back month losing a set amount of implied volatility, or the spread losing a set share of the debit.
Short calendar spread risk
A short calendar reverses the legs: buy the near option, sell the later one, and collect a credit. OIC lists its maximum gain as the net premium received, and warns that if the near option expires and no action is taken, the short call calendar becomes a naked call "and there is no limit to the potential loss." A short calendar is not a mirror image of the long calendar's limited risk.
Calendar Spreads vs Diagonal, Vertical and Butterfly Spreads
Calendar spreads are one of several multi-leg option structures. The difference is which variable they change between legs.
| Spread | Legs differ by | Typical view | Volatility exposure | Risk on a long (debit) version |
|---|---|---|---|---|
| Calendar | Expiration only | Price near strike at front expiration | Long vega | Debit paid |
| Diagonal | Expiration and strike | Directional drift plus time decay | Long vega, more delta | Debit paid, varies with strikes |
| Vertical | Strike only | Directional | Small net vega | Debit paid |
| Butterfly | Three strikes, one expiration | Price pinned near the middle strike | Short vega | Debit paid |
A diagonal calendar spread changes the strike as well as the date, which adds directional exposure. OIC notes it has a "slightly different profit/loss profile," so do not apply calendar breakeven logic to it unchanged. A butterfly and a calendar can both profit from a quiet market, but the butterfly usually gets hurt by rising volatility where the calendar benefits.
Calendar Spreads in Futures and Commodities
In futures markets, a calendar spread usually means something different: buying one delivery month and selling another of the same contract. The CFTC glossary defines it that way and notes it is also called a time spread. No options are involved; you trade the price difference between two months.
CME quotes many futures calendar spreads as their own instruments. An E-mini S&P 500 calendar spread trades in 0.05 index point steps worth $2.50, against 0.25 points and $12.50 for an outright contract. CME says spreads tend to have lower margin requirements than outright positions, and hedgers use calendar spreads to roll from one month to the next.
Illustrative crude oil example: December WTI at $80.00 and January at $79.40, a $0.60 spread. If the spread widens to $0.90, a trader long December and short January gains $0.30 x 1,000 barrels, or $300 per spread, whether crude itself rose or fell.
Options on futures and calendar spread options
Option calendars also trade on futures. CME's course example sells a September 2440 call and buys a December 2440 call for a net 33.75, against 70.50 for the December call alone. If futures are unchanged at September expiration, the December call is worth about 50.00, a 16.25 profit. A rally to 3000 before September leaves both calls near 560.00 and the spread worthless.
CME also lists calendar spread options (CSOs) on corn, soybeans, soybean meal, soybean oil and wheat. A CSO is an option on the spread between two futures months, exercises into one long and one short futures position, and is European-style, so it cannot be exercised early.
Calendar spreads and intraday futures accounts
We do not offer options on Tradeify accounts, so the option calendars in this guide cannot be traded with us. Futures calendar spreads do not fit either. Every position must be closed by 4:45 PM ET, so a spread designed to be held for weeks has nowhere to live, and our hedging rule prohibits opposing positions on the same instrument or within one Product Group (long ES against short ES is our Help Center's own example), which is exactly what two months of the same contract are.
Related lesson: Futures spreads
Calendar Spreads FAQ
How does a calendar spread work?
A calendar spread sells a near-term option and buys a later option of the same type and strike. The short option loses time value faster, so if price stays near the strike, the spread widens. The result is decided mostly at the front expiration.
Are there spreads in futures trading?
Yes. Futures calendar spreads buy one delivery month and sell another of the same contract, and many trade as single instruments on the exchange. Intermarket spreads pair different but related contracts.
What is a short call spread?
A short call spread, or bear call spread, sells a call and buys a higher-strike call with the same expiration for a net credit. OIC lists the maximum gain as the credit and the maximum loss as the strike difference minus the credit.
What is the riskiest option strategy?
Selling uncovered (naked) calls carries the most open-ended risk, because OIC notes an uncovered writer may face unlimited risk. A short call calendar held past the near expiration turns into exactly that position.
What is the 3-5-7 rule in trading?
The 3-5-7 rule is an informal risk rule of thumb, not an exchange or regulatory rule. A common version keeps risk per trade at 3% or less, total open risk at 5% or less, and aims for winners of at least 7%, though versions differ.
Is a calendar spread a debit or a credit?
A long calendar at one strike is always a debit, because the later option costs more. A short calendar is a credit but carries much larger risk once the near option expires.
Options and futures involve substantial risk, and a calendar spread can lose its entire debit, or more once assignment, legging or a short calendar is involved. Model values here are illustrative estimates, funded prop-firm accounts are simulated, and none of this is financial advice, so read the OCC options disclosure document and your broker's policies before trading options.


