
The ascending triangle is widely recognized as a bullish continuation pattern in technical analysis. But what happens when the expected breakout doesn’t occur — when price fakes out or reverses instead of breaking higher? This situation is known as a failed ascending triangle pattern, and it presents a powerful opportunity for traders who know how to recognize and capitalize on it.
In this article, we’ll break down how to identify a failed ascending triangle pattern, why it occurs, and how you can trade it profitably using a disciplined, rule-based approach.
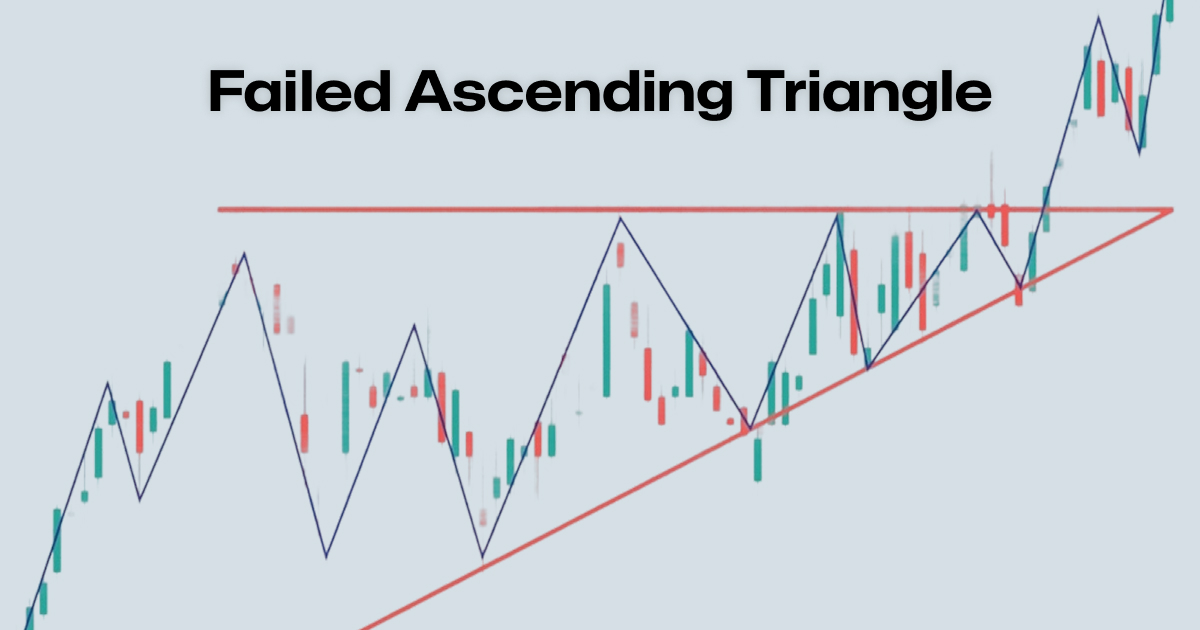
What Is an Ascending Triangle Pattern?
Before we understand the failure, let’s quickly recap what the pattern looks like:
- Flat Resistance Line: Price repeatedly hits a horizontal resistance level.
- Higher Lows: Each pullback is shallower than the last, forming an upward-sloping trendline.
- Expectation: Eventually, the price breaks above the resistance, continuing a bullish trend.
The ascending triangle reflects rising demand and a tightening price range — classic signs of an imminent breakout. But not all triangles resolve as expected.
It’s important to recognize that the strength of an ascending triangle depends not just on the pattern itself, but on the market context around it. This is where a failed ascending triangle pattern provides unique insight.
What Is a Failed Ascending Triangle Pattern?
A failed ascending triangle pattern occurs when price breaks below the ascending trendline instead of breaking out above the resistance. Instead of signaling strength, the failure reveals underlying weakness in the market, often triggering a sharp move downward.
This failed breakout often:
- Catches bullish traders off guard
- Triggers stop-loss orders clustered under the trendline
- Sparks aggressive selling from smart money and breakout traders reversing direction
The failed ascending triangle is not necessarily a rare event — in volatile or news-driven markets, it can be surprisingly common. The key is in your ability to read it as a potential signal rather than a failed opportunity.
Why Do Ascending Triangles Fail?
Understanding the causes can help you anticipate failure:
- ❌ Lack of Volume on Retests: Weak volume on higher lows can indicate fading momentum.
- ❌ False Breakouts: Price may briefly break resistance but fail to hold above.
- ❌ Market Context Ignored: Bearish macro conditions can overpower bullish patterns.
- ❌ Overcrowded Trade: Too many traders expecting a breakout can create one-sided sentiment.
Sometimes a failed breakout is manufactured — smart money triggers the breakout to absorb liquidity, only to reverse direction once retail traders are trapped.
How to Spot a Failed Ascending Triangle Pattern
Here’s your checklist for identifying a potential failure:
- 📉 Trendline Break: Price breaks and closes below the rising support line.
- 📊 Volume Spike: Increase in selling volume confirms bearish intent.
- 🕯️ Bearish Candlestick Confirmation: Engulfing candle, pin bar, or strong bearish close under trendline.
- ⏱️ Failed Retest: Price tries to retest the broken trendline and gets rejected.
Bonus Signal:
- Look for divergence on RSI or MACD near the pattern’s apex — a sign momentum is weakening.
Another way to gain confidence in the failure is to check multiple timeframes. If the failure is forming on a lower timeframe but contradicts a higher timeframe trend, exercise caution.
Trading the Failed Ascending Triangle Pattern
Now for the practical part — how to trade this setup when you spot it.
Entry:
- Enter a short position when price breaks and closes below the trendline with confirmation.
- A more conservative approach is to wait for a failed retest of the trendline.
Stop-Loss:
- Place it above the last lower high or just above the horizontal resistance line.
Take-Profit:
- Measure the height of the triangle and project it downward from the breakdown point.
- Alternatively, target the nearest key support level or use trailing stops.
Example Trade Setup:
If the triangle height is 100 pips, and the breakdown occurs at 1.2000, a 1.1900 target is reasonable. Combining this with a stop-loss of 50 pips gives a 2:1 risk-reward — a solid basis for repeatable success.
Real-World Example: EUR/USD
Setup:
- Price forms an ascending triangle with resistance at 1.0950.
- Multiple higher lows, but volume decreases as price nears apex.
- Price breaks below the trendline at 1.0910 and closes beneath.
Execution:
- Entry: 1.0905 after a bearish engulfing candle.
- Stop-Loss: 1.0960 (above resistance).
- Target: 1.0830 (based on pattern height).
Result: Price drops steadily, hitting the target within hours.
Pro Tips for Trading Pattern Failures
- 🧠 Stay Objective: Avoid marrying the bullish thesis. Trade what the market shows.
- 🔍 Use Multi-Timeframe Analysis: Confirm failure on a higher timeframe for better reliability.
- 💡 Combine with Indicators: Use RSI/MACD divergences and volume spikes as confirmation.
- 📈 Backtest Your Setup: Practice spotting and trading failed ascending triangle pattern scenarios across different markets.
- 📊 Log Every Trade: Documenting your entry, reason, and result is critical for pattern mastery.
Common Mistakes to Avoid
- ❌ Entering too early before a confirmed break
- ❌ Setting tight stops right under trendline support
- ❌ Ignoring major news events that can reverse price quickly
- ❌ Trading without a defined exit plan or trailing stop system
- ❌ Assuming all failed triangles lead to big moves — filter your setups carefully
Bonus: Using the Failed Ascending Triangle in Trend Reversals
This pattern failure is not just useful for intraday or swing trades. It often signals:
- 🔄 End of a bullish trend
- 📉 Start of a broader downtrend
- 🔁 Momentum shift before a macro reversal
You can also pair it with macroeconomic indicators or sentiment data. If a failed ascending triangle pattern aligns with weak fundamentals or dovish central bank commentary, the likelihood of follow-through increases.
By recognizing a failed ascending triangle pattern early, you can position yourself at the beginning of a new trend, maximizing your profit potential.
Master the Market with Tradeify
Trading pattern failures like the failed ascending triangle pattern requires precision, timing, and the right tools. That’s where Tradeify comes in.
Join Tradeify today to access:
- Real capital through funded trading accounts
- Daily trade ideas and pattern analysis
- Proprietary trading tools for price action and liquidity gaps
- A seasoned community of traders sharing setups and strategy
- Live coaching, webinars, and mentorship to strengthen your edge
Don’t just react to the market. Anticipate it — with Tradeify.
Final Thoughts
A failed ascending triangle pattern might seem like a loss of opportunity to the untrained eye. But to the informed trader, it’s a profitable setup waiting to happen. By spotting failed structures and understanding what they tell you about market sentiment, you’re one step ahead of the crowd.
This is not just a pattern — it’s a mindset shift. Learning to embrace failure patterns opens the door to trades most others miss.
Add this to your playbook and practice it until it becomes second nature. Reversals and breakdowns can be just as powerful as breakouts — if not more so.
See the failure. Seize the opportunity. Trade with Tradeify.
.svg)
.svg)
.svg)


.webp)

