




TL;DR: Carry trade strategies borrow a low-rate currency and hold a high-rate one, so the real question is what drawdown the rate gap must pay for. As of November 4, 2026, USD/JPY pays a 2.625-point gap, about $1.04 per session on $10,000. Its worst 20-session drop in five years cost 55.8 times the carry earned over 20 sessions. Size from that drawdown first, and treat several yen crosses as one position.
What a carry trade strategy is and how it earns
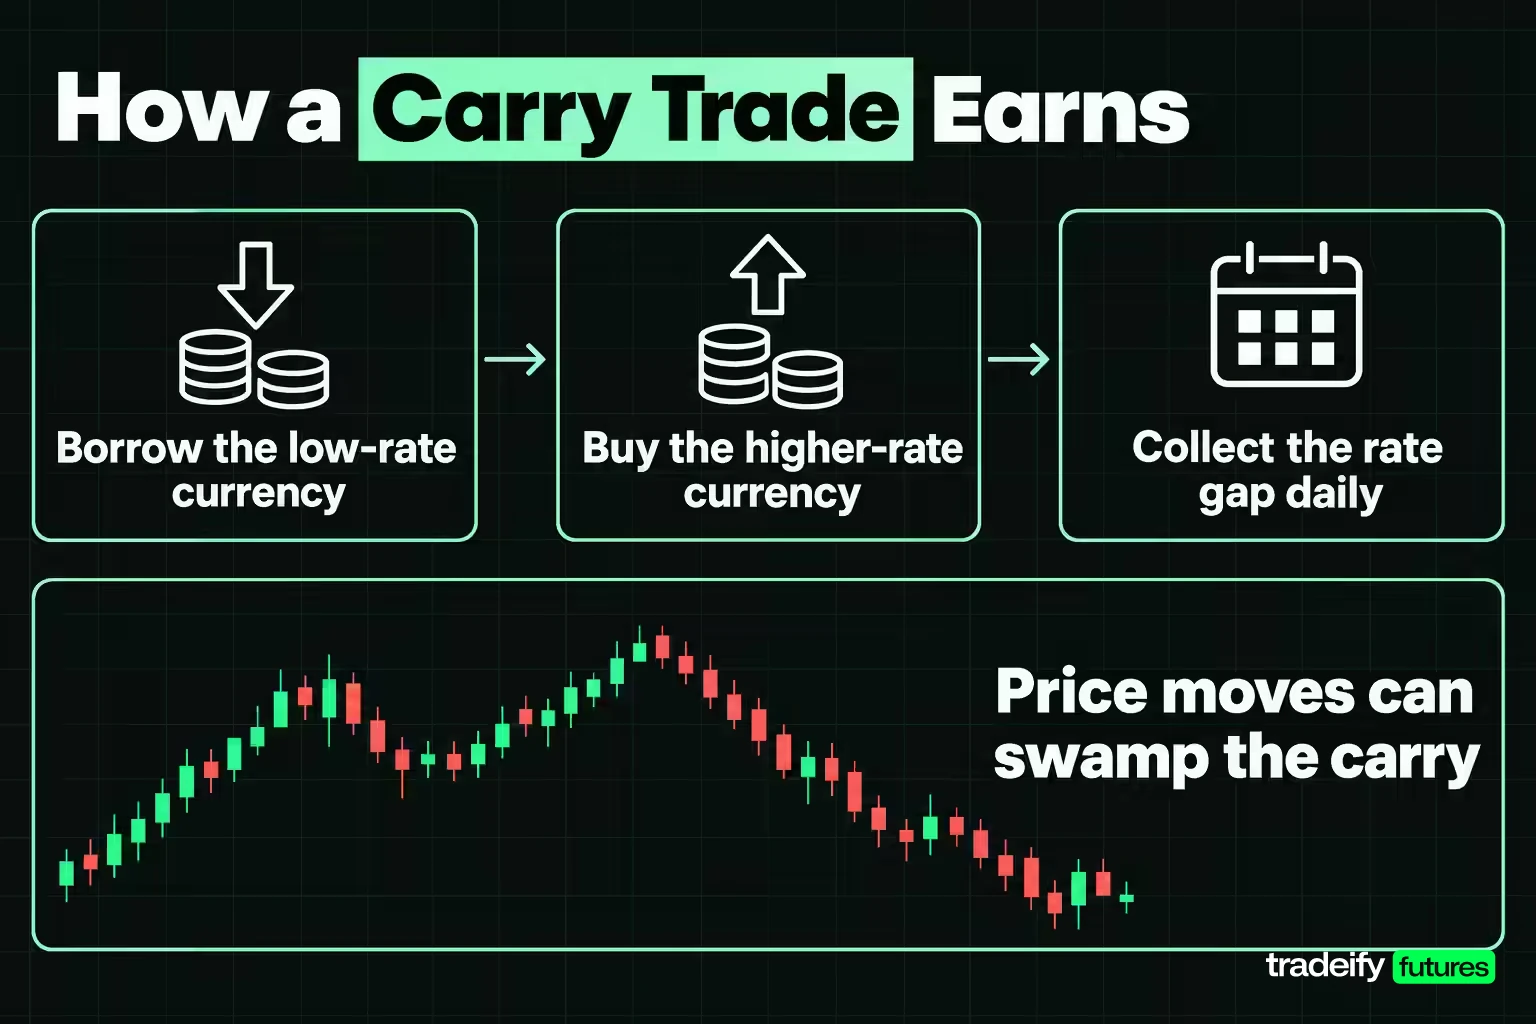
A carry trade strategy pays you to wait. You borrow, or sell, a currency with a low policy rate (the funding currency) and buy a currency with a higher rate (the target currency). The gap between the two rates is the carry, and you collect it for as long as the position stays open.
The pitch sounds easy, and that is the trap. The interest is small and steady, so the position feels safe right up to the session when the funding currency jumps.
The yen has been the classic funding currency because the Bank of Japan has kept its policy rate low for a long time. Even after hikes, the Bank of Japan's call-rate guideline sits at around 1.25% as of November 4, 2026, while the US federal funds target range is 3.75% to 4.00%. Long USD/JPY therefore means holding dollars funded by yen, and the gap pays you each day the trade is on.
That is the definition. The decision is harder, because the trade has two return sources and only one of them behaves.
- The rate gap. It arrives in small, steady pieces, and you can calculate it in advance.
- The exchange rate. It arrives unpredictably, and it can erase months or years of interest in a few sessions.
Most explanations of carry spend their time on the first source. This guide spends its time on the second, because that is where carry trades actually fail. The Bank for International Settlements described the August 2024 episode as a carry trade unwind amplified by "procyclical deleveraging and margin increases", which is a polite way of saying many positions were closed at the same moment and for the same reason.
A carry trade is also a holding-period strategy. It earns per day held, so it only makes sense over weeks or months. That makes it a different animal from intraday futures trading, where positions are flat every evening and no interest accrues to the trader.
Interest rate differentials and swap rates
An interest rate differential is the gap between the short-term rates of two currencies. In a carry trade it is the income line. If you hold the higher-rate currency against the lower-rate one, the differential works for you (positive carry). If you hold the lower-rate currency against the higher-rate one, you pay it (negative carry).
How swap rates pay carry in spot forex
Policy rates are the anchor for that gap, but they are not exactly what a trader receives. In spot forex the carry is paid through a swap, also called rollover or overnight funding. Each time a position stays open past the broker's daily cut-off, the broker credits or debits an amount based on the overnight interbank rates of the two currencies. Three details decide what you actually collect.
- The broker's markup. Brokers set the swap from market rates and then add their own spread, so the long side of a carry pair usually earns less than the headline gap and the short side pays more.
- Weekends and holidays. Spot settlement skips weekends, so the weekend's interest is posted in one larger swap on a weekday. Check which day your broker uses before judging a single day's credit.
- Changes in the gap. The swap moves whenever either central bank moves, so a carry position opened at one gap can be holding a smaller one a month later.
How the rate gap shows up in futures prices
In currency futures there is no daily swap at all. CME Group's education material explains that a futures price equals spot adjusted for the short-term rate gap until expiration, so the gap is already inside the futures price as the basis (futures minus spot). The basis shrinks toward zero as the contract approaches expiration, and that convergence is how a futures holder earns or pays the carry.
Here is the practical rule. Read the policy rates to understand the gap, then read your broker's swap table or the futures basis to see what you will actually be paid. If those two numbers are far apart, the broker's number is the one your account sees.
Carry trade calculations with a USD/JPY example
The carry trade calculation needs three inputs: the notional size, the rate gap and the number of periods held.
Carry earned = notional × rate gap × (sessions held ÷ 252)
The 252 is a common count of trading sessions in a year. Spot swaps are posted per calendar day, so a calendar version divides by 365 days instead. Both give the same annual figure, they just slice it differently.
Worked carry trade example
Take long USD/JPY, funded in yen, with the policy rates as of November 4, 2026. The Federal Reserve's target range of 3.75% to 4.00% has a midpoint of 3.875%. The Bank of Japan's guideline is around 1.25%. The gap is 2.625 points.
| Notional (illustrative) | Carry per session | Carry per 20 sessions | Carry per year |
|---|---|---|---|
| $10,000 | $1.04 | $20.83 | $262.50 |
| $100,000 | $10.42 | $208.33 | $2,625 |
At an illustrative USD/JPY price of 150, one session of carry is worth about 1.56 pips (150 × 2.625% ÷ 252 = 0.0156 yen). That is the whole daily reward. A normal day's price noise is many times larger, so one ordinary red session can wipe out a month of interest. That is why carry traders talk about the gap as income and the exchange rate as risk.
Limits of a policy-rate carry calculation
Carry figures built from policy rates are a ceiling rather than a quote. A real position earns the broker's swap or the futures basis, minus spread and commissions, and the gap changes every time either central bank changes its rate. The calculation is still worth doing, because it tells you how small the income is next to the risk you are carrying.
The calculation also answers a common question about making $100 a day in forex from carry alone. At a 2.625-point gap and calendar-day accrual, $100 a day needs about $1.39 million of notional. Sized so a repeat of the worst five-year drawdown costs 5% of equity (a cap of 0.43 times equity), that is roughly $3.23 million of account equity. Carry is not a small-account income plan.
Central bank policy and rate gaps in November 2026
Central bank policy sets the income side of every carry trade. When the target currency's central bank hikes, the gap widens and the trade pays more. When the funding currency's central bank hikes, the gap narrows from the other end, and the yen side of a yen carry trade usually moves first and hardest.
These are the policy rates in force as of November 4, 2026, taken from each central bank's own decision page or statement.
| Currency | Central bank | Policy rate as of November 4, 2026 | Latest decision | Gap over the yen |
|---|---|---|---|---|
| US dollar | Federal Reserve | 3.75% to 4.00% target range (3.875% midpoint) | Held October 28, 2026, after a hike on September 16, 2026 | 2.625 points |
| Australian dollar | Reserve Bank of Australia | 4.85% cash rate target | Raised 0.25 point, effective November 4, 2026 | 3.60 points |
| British pound | Bank of England | 3.75% Bank Rate | Held September 17, 2026; next decision November 5, 2026 | 2.50 points |
| Euro | European Central Bank | 2.50% deposit facility rate | Raised 0.25 point, effective September 16, 2026 | 1.25 points |
| Japanese yen | Bank of Japan | Around 1.25% call-rate guideline | Raised September 18, 2026; held October 30, 2026 | Funding side |
What the November 2026 rate decisions signal for carry
Three policy facts in the November 2026 rate table matter more than the gap figures themselves.
First, the funding side is rising. The Bank of Japan moved its guideline to around 1.25% on September 18, 2026 by a 7-2 vote, and at the October 30, 2026 meeting one board member proposed going to around 1.5%. A funding rate that rises shrinks every yen carry trade at once.
Second, the target side is also rising. The Reserve Bank of Australia has raised its cash rate five times in 2026, to 4.85%, which is why AUD/JPY has the widest gap in the table.
Third, rates are only half the signal. Guidance, dissents and surprise data move currencies before rates change. A carry position is a bet that the gap stays wide and the funding currency stays quiet, so a hawkish turn from the funding central bank is the event to watch, even before it acts.
Rates in this table will go stale. The Bank of England decides again on November 5, 2026, and the Federal Reserve meets on December 8-9, 2026. Re-check each rate on the central bank's own site before using it.
The carry-to-drawdown test on four yen crosses
The carry-to-drawdown test asks one question: how many sessions of carry does the worst historical move erase? It turns a vague warning ("carry trades can unwind") into a number you can compare across pairs.
How the test was measured
This is an illustrative study computed for this guide from the European Central Bank's daily euro reference rates (the 2:15 PM CET fixings), which give USD/JPY, AUD/JPY and GBP/JPY as crosses and EUR/JPY directly.
- Samples. Five years from November 4, 2021 to November 4, 2026 (1,281 common daily fixings), and the full series from January 4, 1999 to November 4, 2026 (7,129 fixings).
- Rate gap. Each target currency's policy rate as of November 4, 2026 minus the Bank of Japan's 1.25%.
- Volatility. Annualised standard deviation of daily log returns (252 sessions).
- Worst move. The largest percentage fall over any 20 consecutive fixings, measured as a simple price change because that is what a position records as profit and loss.
- Move-to-carry ratio. The worst 20-session fall divided by 20 sessions of carry at today's gap.
The ratio uses today's gap against historical moves. In 2008 the gaps were different, so the full-history column says what a past shock would cost a position opened at today's rates, not what it cost traders at the time.
| Pair | Gap over yen | Annualised volatility, 5 years | Gap divided by volatility | Worst 20 sessions, 5 years | Move-to-carry ratio, 5 years | Worst 20 sessions since 1999 | Move-to-carry ratio since 1999 |
|---|---|---|---|---|---|---|---|
| USD/JPY | 2.625 points | 10.39% | 0.25 | -11.62% | 55.8 | -12.48% | 59.9 |
| AUD/JPY | 3.60 points | 11.92% | 0.30 | -15.50% | 54.2 | -34.39% | 120.4 |
| GBP/JPY | 2.50 points | 10.01% | 0.25 | -12.08% | 60.9 | -24.98% | 125.9 |
| EUR/JPY | 1.25 points | 9.33% | 0.13 | -10.55% | 106.3 | -24.00% | 241.9 |
What the carry-to-drawdown numbers say
The gap is a small fraction of the risk. Gap divided by volatility runs from 0.13 to 0.30. Even the best pair pays less than a third of one year's typical price swing.
One bad month costs years of carry. A ratio of 55.8 means the worst 20-session fall on USD/JPY erased 55.8 twenty-session blocks of carry, which is roughly four and a half years of trading sessions.
The worst windows line up. In the five-year sample, all four crosses had their worst 20 sessions over the same dates, July 8 to August 5, 2024. Since 1999, all four bottomed in late September to late October 2008. That is not four separate markets having bad luck. It is one funding currency moving.
A wider gap did not buy safety. AUD/JPY pays the most and has the best gap-to-volatility ratio, yet its full-history worst window (-34.39%) is nearly three times the USD/JPY figure. EUR/JPY pays the least, so its ratio is the worst in both samples.
How to choose currency pairs for a carry trade
Choosing carry trade pairs starts with the two legs, then checks whether the gap is worth the volatility, then checks what else you already hold.
Funding and target currency traits
A good funding currency has a low policy rate, a central bank that is not expected to raise it soon, and deep liquidity. The yen and, historically, the Swiss franc fit that description. A target currency has a higher policy rate and enough liquidity to exit in a hurry. Commodity-linked currencies such as the Australian dollar often pay the widest gaps among the majors, and they tend to fall hardest when risk appetite breaks.
Practical filters for a carry pair:
- Gap divided by volatility. Compare income with risk directly. In the five-year test, the range was 0.13 to 0.30, so a pair outside that range deserves a second look at either the rates or the data.
- Direction of policy. A gap that is widening because the target central bank is hiking is a different trade from a gap that is narrowing because the funding central bank is hiking.
- Liquidity and spread. Major pairs and their CME futures equivalents trade with tighter spreads, which matters because spread costs come straight out of a thin carry.
- Event calendar. A pair with a central bank decision or major data release next week carries a known jump risk.
Why yen crosses behave as one carry position
Correlation is what turns a basket of yen carry trades into one bet. Computed for this guide from the European Central Bank's daily reference rates over five years (November 4, 2021 to November 4, 2026), the correlation of daily log returns among four yen crosses ran from 0.56 to 0.86.
| Correlation of daily returns, 5 years | USD/JPY | AUD/JPY | GBP/JPY | EUR/JPY |
|---|---|---|---|---|
| USD/JPY | 1.00 | 0.56 | 0.66 | 0.70 |
| AUD/JPY | 0.56 | 1.00 | 0.78 | 0.74 |
| GBP/JPY | 0.66 | 0.78 | 1.00 | 0.86 |
| EUR/JPY | 0.70 | 0.74 | 0.86 | 1.00 |
Every pair in that table is short the same yen. Spreading $40,000 across four yen crosses is much closer to one $40,000 yen position than to four independent $10,000 trades, and the shared funding leg is the yen, which drove the worst 20-session window of all four crosses in July and August 2024. Diversifying target currencies does not diversify funding risk. If you want real diversification, the funding side has to differ too.
Carry trade examples from 2008 and August 2024
The two largest carry trade unwinds in the ECB data show the same pattern at different scales: a long, crowded build-up, a change in the funding side or in risk appetite, and a fall far larger than the carry that came before it.
The 2008 yen carry unwind
Carry trades had a long run in the mid-2000s, and the yen crosses peaked in 2007 and 2008. The fall that followed was the deepest in the ECB series.
| Pair | Peak fixing | Trough fixing | Peak-to-trough change |
|---|---|---|---|
| USD/JPY | 124.06 on June 22, 2007 | 88.41 on December 18, 2008 | -28.74% |
| AUD/JPY | 107.46 on July 20, 2007 | 56.13 on February 2, 2009 | -47.77% |
| GBP/JPY | 250.61 on July 20, 2007 | 121.07 on January 23, 2009 | -51.69% |
| EUR/JPY | 169.75 on July 23, 2008 | 113.65 on January 23, 2009 | -33.05% |
The sharpest stretch was the autumn of 2008. AUD/JPY fell 34.39% over the 20 fixings from September 26 to October 24, 2008, and lost 10.85% on October 24 alone. Research published by the National Bureau of Economic Research in 2008 (Brunnermeier, Nagel and Pedersen, "Carry Trades and Currency Crashes") documents this as a general feature: moves between high-rate and low-rate currencies are negatively skewed, and the crashes tend to come when risk appetite and funding liquidity dry up.
The August 2024 yen carry unwind
The 2024 episode was smaller but faster. By early July 2024, USD/JPY was near 161 and yen-funded positions were widely held. The Bank of Japan raised its guideline to around 0.25% on July 31, 2024, and a weak US data release followed within days. The Bank for International Settlements estimated carry positions going into the event at a rough middle ballpark of ¥40 trillion ($250 billion).
From July 8 to August 5, 2024, measured on the ECB fixings:
- USD/JPY fell from 160.93 to 142.24, a drop of 11.62%.
- AUD/JPY fell from 108.53 to 91.71, a drop of 15.50%.
- GBP/JPY fell from 206.58 to 181.63, a drop of 12.08%.
- EUR/JPY fell from 174.37 to 155.98, a drop of 10.55%.
On August 5, 2024 alone, the four crosses fell 4.49%, 5.49%, 4.33% and 3.34%. The daily standard deviation of USD/JPY over the five-year sample is 0.653%, so August 5 was close to a seven-standard-deviation day. At today's gap it would take about 431 sessions of carry to earn back that one day.
How carry trade cycles build and break
The 2008 and 2024 carry unwinds follow the cycle that makes carry trades frustrating. The good years are long and quiet, the strategy looks like steady income, positions grow, and then one funding shock reprices everything in weeks. A backtest that starts after a crash and ends before the next one will make carry look far safer than it is, which is why the test in this guide reports a five-year sample and the full series side by side.
Carry trade risks and how to manage each one
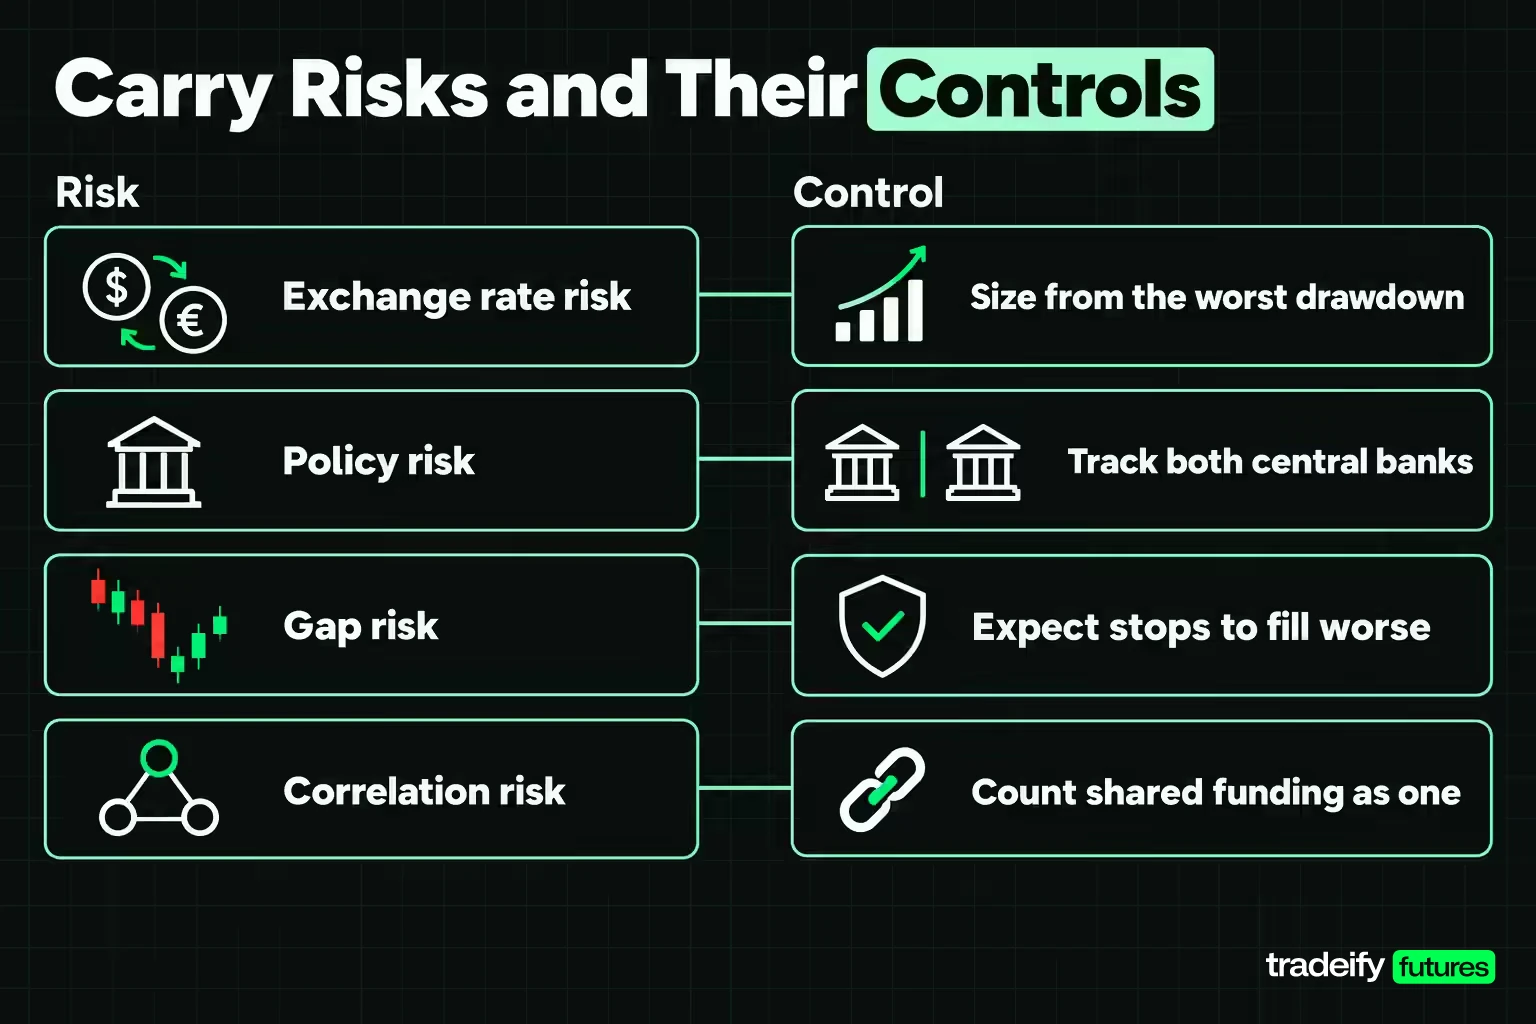
Carry trade risk comes from the fact that the income is small and certain while the losses are large and sudden. Each risk below has a control, but none of the controls makes the trade safe.
| Carry trade risk | What happens | Control |
|---|---|---|
| Exchange rate risk | The funding currency strengthens and the price loss swamps the carry | Size from the historical worst window, not the yield |
| Policy risk | Either central bank changes rates and the gap narrows or flips | Track both central banks' calendars and guidance |
| Liquidity and margin risk | Spreads widen and margin rises during stress, forcing exits at bad prices | Keep notional well below the account and leave margin headroom |
| Gap risk | Prices jump over stops between sessions or on weekends | Expect stops to fill worse than planned in an unwind |
| Correlation risk | Several carry pairs fall together because they share a funding currency | Count all pairs with one funding currency as one position |
| Funding cost risk | The broker's swap changes or its markup eats the gap | Read the actual swap table, not the policy rate |
The margin row is the one that turns a paper loss into a forced exit. The Bank for International Settlements pointed to procyclical deleveraging and margin increases as amplifiers in August 2024. A position that could survive the price move on its own may not survive being cut at the worst moment because the margin call arrives first.
Stops are harder than they look. The daily standard deviation of USD/JPY over five years was 0.653%, so a three-standard-deviation day is about 1.96%. At today's gap, one such day gives back about 188 sessions of carry. A stop tight enough to protect a few weeks of carry gets hit by ordinary noise, and a stop wide enough to survive noise lets the trade give back years of income before it acts.
Hedging a carry trade
Hedging a carry trade always costs some of the carry, because the hedge pays for the protection out of the income.
- Smaller size. The cheapest hedge is less notional. It cuts income and drawdown in the same proportion.
- Options on the pair. A put on the target currency limits the loss, but its premium can absorb a large share of a year's carry, especially when volatility is high.
- A different funding leg. Funding part of the position in a second low-rate currency spreads the funding risk, at the cost of a smaller or different gap.
- Exit rules tied to events. Closing or cutting the position ahead of a funding-side central bank meeting gives up some carry to skip a known jump.
Related lesson: Leverage explained
Position sizing from the worst drawdown
Position sizing for a carry trade should start from the drawdown and work back to the income. Starting from the yield produces positions that look conservative and are not.
The method takes two numbers: the worst historical move for the pair and the share of equity you accept losing if it repeats. Maximum notional is the risk limit divided by the worst move. The carry income then follows.
| Pair and lookback | Worst 20-session fall | Risk limit, % of equity | Maximum notional per $1 of equity | Annual carry, % of equity |
|---|---|---|---|---|
| USD/JPY, 5 years | 11.62% | 5% | 0.43 | 1.13% |
| USD/JPY, 5 years | 11.62% | 10% | 0.86 | 2.26% |
| AUD/JPY, 5 years | 15.50% | 5% | 0.32 | 1.16% |
| AUD/JPY, since 1999 | 34.39% | 5% | 0.15 | 0.52% |
| AUD/JPY, since 1999 | 34.39% | 10% | 0.29 | 1.05% |
Read the last column honestly. If you will not accept a double-digit equity loss from a repeat of a known episode, the carry you can collect is around 1% to 2% of equity a year before costs. That is not a flaw in the math. It is the actual trade on offer. Carry figures use the unrounded notional, so they may differ slightly from the displayed notional times the gap.
Gearing works the other way. The 11.62% USD/JPY fall becomes 34.86% of equity at three times notional, 58.10% at five times and 116.20% at ten times, which wipes out more than the account. A geared carry trade rarely fails because the carry disappears. It fails because the funding currency moves while the position is sized as though it will not.
Related lesson: Position sizing
Pros and cons of carry trading
Carry trading's advantages and disadvantages come from the same source: a small, known income held against a large, unknown price move.
| Carry trading pros | Carry trading cons |
|---|---|
| The income is known in advance and can be calculated from published rates | The income is small, about 2.625 points a year on USD/JPY as of November 4, 2026 |
| Carry accrues every day the position is held, even in a quiet market | One bad month erased 55.8 twenty-session blocks of carry on USD/JPY |
| Central bank decisions are scheduled, so policy risk has a calendar | Unwinds come from risk appetite and margin, which have no calendar |
| The idea extends to futures, bonds and commodities | Popular carry pairs share a funding currency and fall together |
| Rising target-currency rates can add price gains on top of carry | Brokers' swap markups and spreads cut the realised gap |
The pros are about predictability of income. The cons are about the size and timing of losses. A carry trade is worth considering only when you can survive the cons at the size you trade.
How to execute a carry trade
Executing a carry trade takes one order. The work is in the checks you do before it, because each one is harder to do calmly once the position is losing.
- Write down both policy rates, the central bank source and the date of each last change.
- Check the actual swap rate for the pair at your broker, long and short, or the futures basis for the contract month you would hold.
- Look up the pair's worst historical drawdown over at least one full rate cycle, and divide it by the carry for the same period.
- Choose a risk limit and size the notional from the drawdown, not from the yield.
- List every open position that shares the funding currency and count them together.
- Decide the exit triggers in advance (a funding-side hike, a volatility spike, a price level) and write them down.
- Enter with a limit order during liquid hours, since a market order in a thin session adds spread to a thin income.
- Review the swap and the policy calendar on a schedule, and keep the accrued carry out of the risk budget so it is not quietly turned into extra size.
Carry trades in currency futures
A carry trade in CME currency futures earns the gap through the basis instead of a daily swap. CME's Japanese yen futures (6J) cover 12,500,000 yen, quoted in US dollars per yen, with a minimum tick of 0.0000005 worth $6.25. Being long dollars against yen in futures means selling 6J.
Here is the arithmetic with illustrative numbers. Take USD/JPY at 150, so 1 yen is worth 0.0066667 dollars, and a contract 90 days from expiration. Using the rates as of November 4, 2026 (3.875% for the dollar and 1.25% for the yen, simple interest on a quarter of a year), the theoretical 6J price is 0.0066667 × (1 + 3.875% × 0.25) ÷ (1 + 1.25% × 0.25) = 0.0067103.
The futures price sits about 0.0000436 above spot, which is about 87 ticks or $545 per contract on roughly $83,333 of notional. If spot does not move, that premium converges to zero by expiration and the short 6J position earns it. That $545 is the same carry as 2.625% on $83,333 for a quarter year, delivered through the price instead of a swap. Real 6J prices also reflect market rates for the exact period and supply and demand, so the live basis will differ from this sketch.
Related lesson: Currency futures
When to avoid a carry trade

Avoiding a carry trade at the wrong time matters more than finding the best pair, because the losses come in clusters. Staying flat is a valid decision when the evidence points the wrong way.
- The funding central bank turns hawkish. A Bank of Japan hike or a strong dissent for one narrows every yen carry gap at once. The July 31, 2024 hike came days before the August 5 drop.
- The gap is narrowing from both ends. A target central bank signalling cuts while the funding bank signals hikes squeezes the income from two sides.
- Volatility is rising. The gap does not change when volatility doubles, but the gap-to-volatility ratio halves. If the pair's realised volatility is climbing, the carry is paying for less of the risk.
- Positioning is crowded. When a carry pair is described as a one-way trade and has run for years, the exit door is crowded. Both unwinds in the ECB data followed long runs higher.
- A known shock is close. A central bank meeting, a major data release or an election can move a currency more in one session than months of carry.
- The trade only works with high gearing. If the income only looks meaningful at five or ten times notional, the drawdown at that size is the real answer.
Advanced carry trade strategies
Advanced carry trade strategies try to keep the income while cutting the shared crash risk. None of them removes it.
Carry baskets and funding diversification
A carry basket goes long several high-rate currencies and short several low-rate currencies, rather than one pair. The point is to diversify the funding side as well as the target side. Yen crosses correlated at 0.56 to 0.86 over five years in the ECB data, so a basket with one funding currency is still one bet.
The common construction ranks currencies by policy rate, buys the top group, sells the bottom group in equal weights and rebalances on a schedule. With the five rates as of November 4, 2026, a two-and-two basket would hold the Australian dollar (4.85%) and US dollar (3.875%) against the yen (1.25%) and euro (2.50%). The average rate on the long side is 4.3625% and on the funding side 1.875%, so the basket gap is about 2.49 points.
That gap is slightly below the 2.625 points on USD/JPY alone, which is the honest trade-off. Adding the euro as a second funding currency gives up a little income in exchange for not having the whole position short yen. The basket still holds currencies that tend to fall together in a risk-off move, so the drawdown test applies to the basket as a whole, run on its combined daily returns.
Rebalancing rules matter as much as the ranking. A basket rebalanced only when a central bank changes rates can drift toward whichever currency has rallied most, and a rule that rebalances too often pays spread on every turn. Write the rule down before the first trade, including what happens when two rates tie.
Volatility and trend filters for carry trades
Some traders cut or close carry positions when realised volatility rises above a threshold or when the pair's trend turns down. A volatility filter reacts to the ratio problem directly: if volatility doubles, the gap pays for half as much risk. A trend filter tries to step aside early in an unwind. Both give up carry in quiet periods and both can be late, because unwinds start with a few large days. Test any filter on 2008 and 2024 before trusting it.
Negative carry and carry beyond forex
Negative carry is the reverse position, holding the low-rate currency against the high-rate one and paying the gap. Traders accept it when they expect the funding currency to strengthen by more than the cost, which is effectively betting on the unwind.
The carry idea also exists outside forex. In commodity futures it shows up as roll yield between contract months, in bond markets as the yield earned over the funding rate, and in equity index futures as the dividend yield against the financing rate. Each has the same shape: a known income stream against an unknown price move.
The forward premium puzzle
Uncovered interest parity says a high-rate currency should weaken by roughly the rate gap, which would leave carry trades earning nothing on average. Over long samples that has tended not to happen, and economists call the gap between theory and data the forward premium puzzle. The Brunnermeier, Nagel and Pedersen paper links part of the puzzle to crash risk: carry earns a premium in normal times because it loses heavily in sudden unwinds. That is the most useful way to think about the strategy. The steady income is payment for holding crash risk.
This also answers the broader question of the most effective trading strategy. No strategy is most effective in general. A strategy is effective when its edge is measured honestly, including the bad windows, and sized so you survive them.
Related lesson: Cost of carry
Why carry trades don't fit intraday futures accounts
A carry trade needs time. It earns per day held, and the test in this guide measured risk over 20-session windows, so the position is meant to stay open for weeks or months. An account that requires every position to be flat each evening cannot hold a carry trade at all, because no position survives long enough to collect the gap.
On our accounts, every position must be closed by 4:45 PM ET, with no overnight, weekend or swing holds, so a carry trade can't be run on a Tradeify account. We list the CME currency futures 6E, 6B, 6J, 6A, 6C, 6S, M6E and M6A for intraday trading. Our hedging rule matters too: opposing positions on two products in the same Product Group are prohibited, and currencies form one group, so a futures version of AUD/JPY carry (long 6A against short 6J) would breach it even within one session.
The useful part of carry for an intraday trader is the knowledge, not the position. Central bank decisions that change a carry gap are also the events that move currency futures within the day.
Carry trade strategy FAQ
What does carry trade mean in finance?
A carry trade means borrowing or selling a low-interest-rate currency and holding a higher-rate one to earn the gap between the two rates. The income is the interest differential. The risk is that the exchange rate moves against the position by more than the interest earned.
Can you make $100 a day on forex with a carry trade?
Yes, but only with a very large account. At a 2.625-point gap, $100 a day of carry needs about $1.39 million of notional. Sized so a repeat of the five-year worst window costs 5% of equity, that needs roughly $3.23 million of equity. Smaller accounts can only reach $100 a day through gearing, which multiplies the drawdown by the same factor.
What is the 3-5-7 rule in trading?
The 3-5-7 rule caps risk at about 3% of the account per trade and about 5% across all open positions, and asks winners to be larger than losers. It is an informal guideline, not a formal standard, and versions differ on the 7. For carry trades the 5% cap is the useful part, because all positions sharing a funding currency should count as one.
What is the most effective strategy in trading?
No single trading strategy is the most effective; the best one for you is the one whose edge survives its worst window at your size. The useful test is whether a strategy's edge survives its worst historical window at the size you trade. For carry trades that test is the move-to-carry ratio, which ran from 54.2 to 106.3 on four yen crosses over five years.
Is a carry trade profitable?
A carry trade can be profitable while the rate gap holds and the funding currency stays quiet. The four yen crosses in this guide show why that is not the same as safe: their worst 20-session falls in five years erased 54.2 to 106.3 twenty-session blocks of carry at today's gaps.
What happens when a yen carry trade unwinds?
When a yen carry trade unwinds, traders buy back yen to close positions at the same time, so the yen jumps and every yen cross falls together. In the August 2024 unwind, USD/JPY lost more than a tenth of its value in four weeks, and the worst single day came on August 5.
Carry trades involve currency, interest rate, liquidity and margin risk, and losses can exceed the interest the position was opened to collect. Futures and leveraged forex can lose more than expected, sometimes more than the account. Funded and evaluation accounts are simulated. The study in this guide is illustrative and historical, and the rates shown are as of November 4, 2026. Nothing here is investment advice or a recommendation to enter any position.


