



TL;DR: Position sizing means dividing the dollars you will lose at the stop by the dollars each contract loses there. On a $25,000 account risking 1%, a 5-point ES stop allows 1 contract and a 10-point stop allows 0. The fix for a zero answer is a smaller contract or a tighter setup, never a wider stop. Buying power tells you what you can open, not what you can afford to lose.
What Position Sizing Means in Trading
Position sizing is choosing how many contracts, shares or lots to trade so that a loss at your stop costs an amount you picked in advance. Investopedia defines it as deciding how many units to trade while accounting for account size and risk tolerance. The practical version is narrower: you pick the loss first, then work backwards to the size.
That order is the whole point, and most new traders get it backwards. They look at how many contracts the account can open, or how many shares the cash will buy, and take something close to that. Margin and buying power answer what a broker will let you open. They say nothing about what the trade costs you if it is wrong.
Two traders with the same account, the same chart and the same entry can carry completely different risk. One has a stop 5 points away with one ES contract. The other has the same contract and a stop 10 points away. The chart looks identical. The second trader is risking twice as much, and nothing on the screen says so.
A position sizing rule that returns the same size on every trade is usually not a sizing rule. It is a habit. The size should move every time the stop distance moves, even when nothing about the account changed.
Related lesson: Risk management for traders
The Inputs Behind Every Position Size
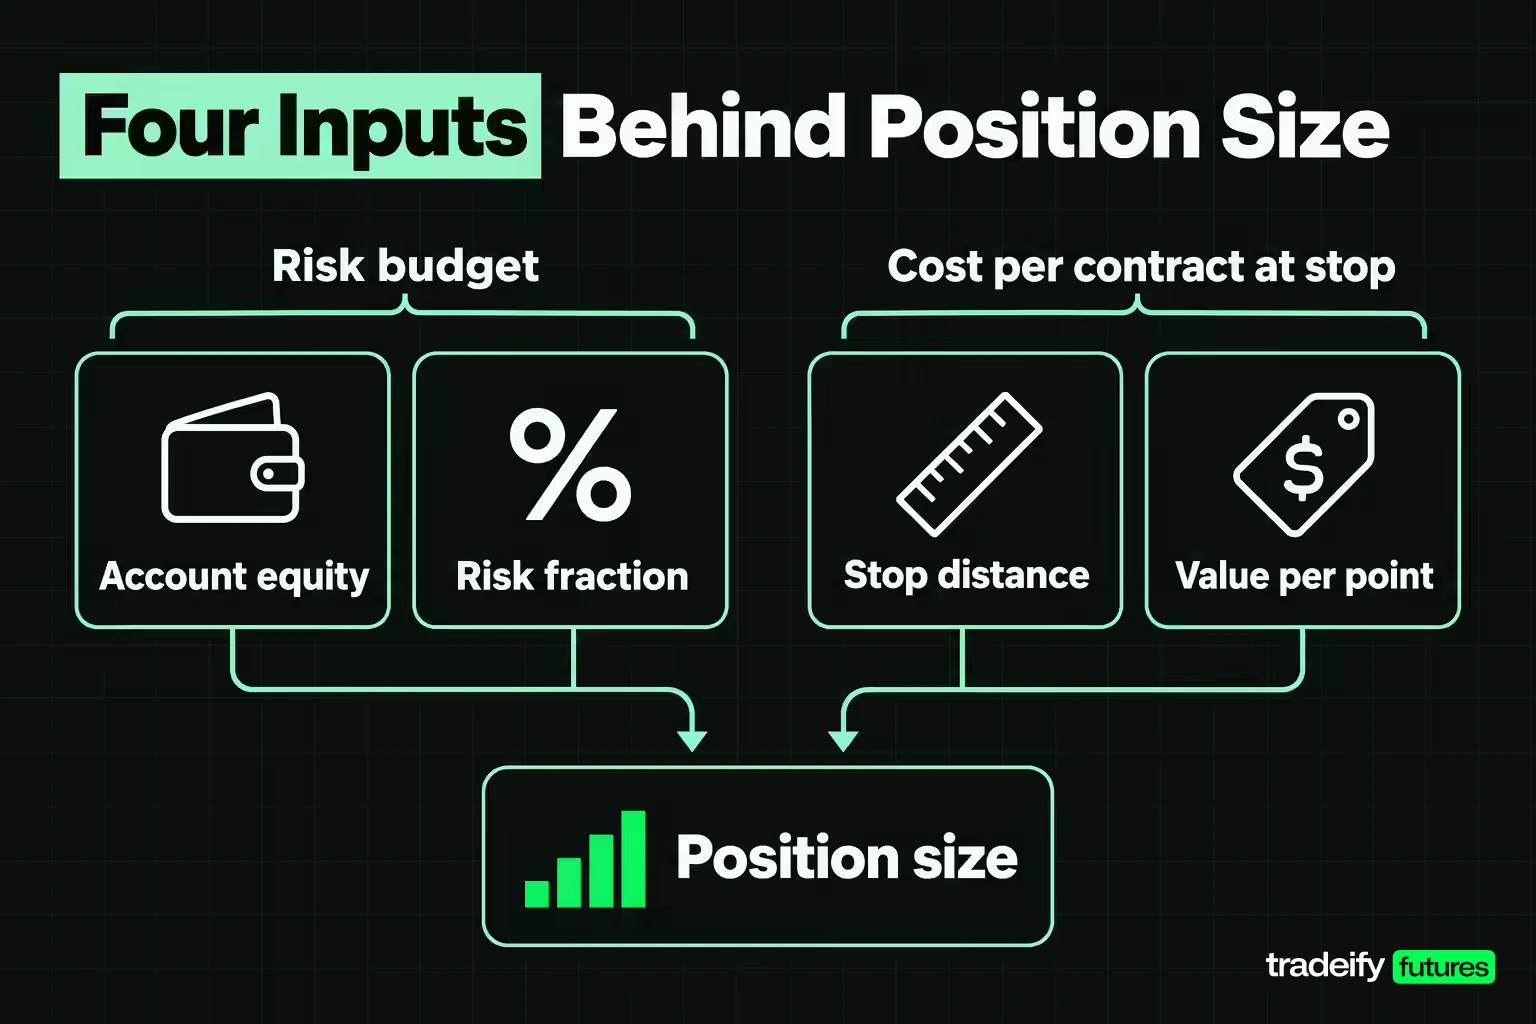
Every common position sizing method, from a flat percent of equity to volatility scaling, comes down to four inputs.
- Account equity. The current balance, not the starting balance. After a loss, the next position is sized from the smaller number, which is why a percent-based rule shrinks size slightly through a losing run.
- Risk fraction. The share of equity you accept losing on one trade, such as 1% or 2%, or a fixed dollar amount. This is the only input that is a personal decision.
- Stop distance. How far the stop sits from entry, in points, ticks, pips or dollars per share. It comes from the chart and the setup, and it is the input traders most often bend to make a desired size fit.
- Value per unit of movement. What one point, tick or pip is worth per contract or lot. ES is worth $50 per index point and its 0.25-point tick is worth $12.50. MES, the micro version, is worth $5 per point. On a standard forex lot of EUR/USD, one pip (0.0001) is worth $10.
The first two inputs set the risk budget. The last two set the cost of one unit at the stop. Position size is simply how many units fit inside the budget.
The Position Size Formula Step by Step
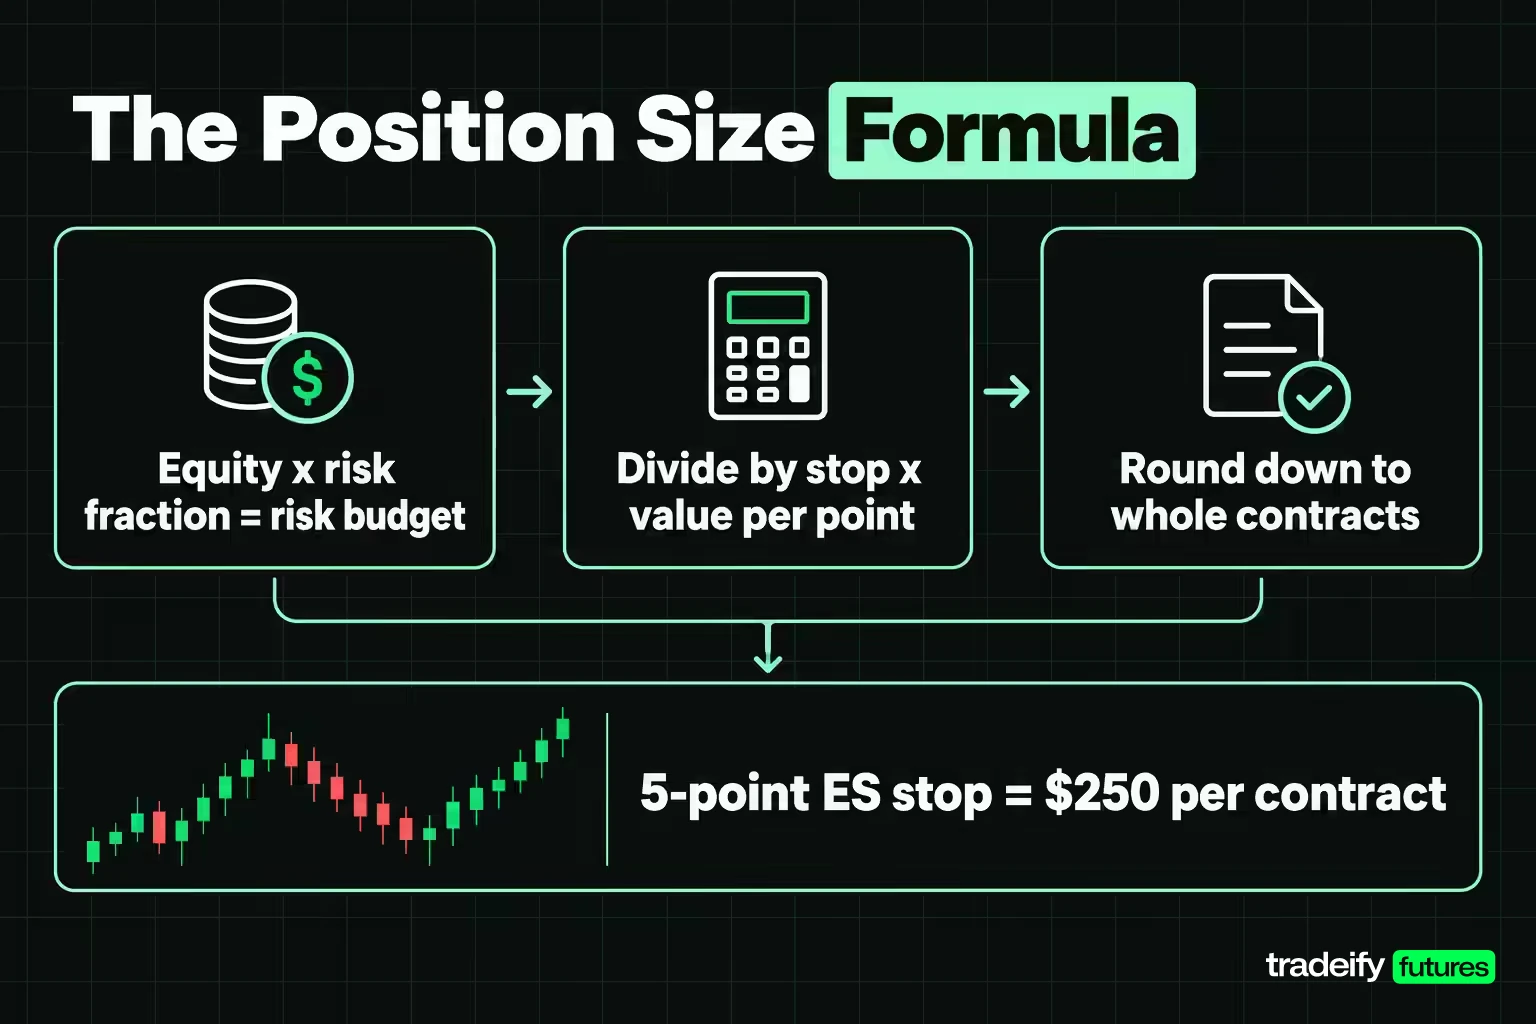
The position size formula has two lines, and it works the same way across futures, stocks and forex.
- Risk budget = account equity × risk fraction.
- Position size = risk budget ÷ (stop distance × value per unit of movement), rounded down to a whole unit.
For a futures contract, the denominator is the stop in points times the point value, or the stop in ticks times the tick value. A 5-point ES stop is 20 ticks, and 20 × $12.50 = $250 per contract. Divide the budget by that and round down.
For shares, the denominator is entry price minus stop price. For forex, it is the stop in pips times the pip value for the lot size you trade.
Rounding and position size calculator tools
Always round down. If the division says 1.6 contracts, the answer is 1. Rounding up means the account is risking more than the rule you wrote, and it does so on exactly the trades where you felt most sure.
Position size calculators and platform risk tools do the same two lines faster. They are useful because they remove arithmetic from the moment when you least want to do arithmetic. They do not choose the stop for you, and most of them return fractional contracts without telling you what rounding does to your actual risk. Check the whole-number result against your cap before you trust it.
How Much to Risk Per Trade
Risk per trade is the one input you choose, and it decides how much of a losing streak you can sit through. There are two common ways to set it.
- Fixed percent. Risk the same share of current equity on every trade, such as 1%. Size shrinks after losses and grows after wins.
- Fixed dollar. Risk the same dollar figure, such as $250, until you deliberately reset it. Simpler to track, but it does not shrink during a drawdown unless you change it.
Investopedia describes a rule of thumb that most retail investors risk no more than 2% of capital on one trade, and notes that fund managers usually risk less. On a $25,000 account, 2% is $500 per trade.
What each risk percentage does to a losing streak
The percentage matters because losses compound. Investopedia's example says 10 consecutive losses at 2% cost 20%, which is the fixed-dollar view. With fixed-percent sizing from current equity, the same streak costs a little less, and the gain needed to get back grows faster than the loss.
| Risk per trade | Drawdown after 10 straight losses | Gain needed to recover | Losses in a row to halve the account |
|---|---|---|---|
| 1% | 9.6% | 10.6% | 69 |
| 2% | 18.3% | 22.4% | 35 |
| 3% | 26.3% | 35.6% | 23 |
| 5% | 40.1% | 67.0% | 14 |
Long losing streaks are not rare, and they are not a sign the strategy broke. For a strategy that wins 45% of the time, treating each trade as independent, the chance of at least one run of 8 losses somewhere in 500 trades is about 85.4%, and the chance of a run of 10 is about 43.3%. Even across 200 trades, a run of 8 shows up about 53.0% of the time. Your risk per trade is really a decision about how deep a streak you are prepared to survive without changing anything.
Related lesson: Maximum risk per trade
Stop-Loss Placement Before Position Size
The stop is set from the chart before you think about size. It belongs where the trade idea is proven wrong: beyond the swing low, outside the range, past the level the setup depends on. Only then do you size to it.
The common mistake runs the other way. A trader wants two contracts, sees that two contracts at the honest stop risk too much, and moves the stop closer so the math works. Now the stop sits somewhere the market can reach on ordinary noise, and the trade gets stopped out before the idea is ever tested. Widening a stop to keep a favourite size is the same error in reverse.
A stop also does not guarantee the fill price. Investor.gov explains that a stop order becomes a market order once the stop price is reached, and the execution price can differ from the stop in a fast market. Investopedia makes the same point about gaps: a security that jumps past the stop can cost more than the intended risk. Some traders cut size ahead of known volatility for exactly this reason. When slippage makes a loss bigger than planned, record the real figure in your journal, not the planned one. Otherwise the record quietly understates how much an oversized position can hurt.
Related lesson: Stop loss orders and placement
Position Sizing Examples in Futures, Stocks and Forex
The examples below use one budget so you can compare them directly. All prices are round, illustrative numbers.
Futures position sizing on a $25,000 account
A $25,000 account risking 1% has a $250 budget. The setup decides the stop, and the stop decides whether the trade is available at all.
| Contract and stop | Risk per contract | Budget divided by risk | Contracts allowed | Actual risk | Unused budget |
|---|---|---|---|---|---|
| ES, 5 points | $250 | 1.00 | 1 | $250 | $0 |
| ES, 10 points | $500 | 0.50 | 0 | $0 | $250 |
| MES, 10 points | $50 | 5.00 | 5 | $250 | $0 |
| MES, 20 points | $100 | 2.50 | 2 | $200 | $50 |
| NQ, 20 points | $400 | 0.625 | 0 | $0 | $250 |
| MNQ, 20 points | $40 | 6.25 | 6 | $240 | $10 |
| MNQ, 40 points | $80 | 3.125 | 3 | $240 | $10 |
Read the ES rows against the MES rows. At a 10-point stop, one ES contract risks $500, which is 2% of this account. The honest answer is zero ES contracts. The same setup on MES fits 5 contracts at exactly the $250 budget.
That zero is the most useful result in the table. An account that cannot express a setup at its stated risk has three honest choices: trade the smaller contract, wait for a setup with a tighter structure, or skip it. Rounding up to one ES contract doubles the risk you said you would take.
Whole contracts also mean you usually land below the cap, not on it. The MNQ rows leave $10 unused and the MES 20-point row leaves $50 unused. Bigger contracts leave bigger gaps, which is the practical case for micros on smaller accounts.
Related lesson: Mini and micro futures contracts
Stock position sizing versus buying power
Take the same $25,000 and $250 budget. A stock bought at $50 with a stop at $47.50 risks $2.50 per share, so the position is 100 shares. That is a $5,000 position, 20% of the account, with 1% at risk.
Now size it by buying power instead. All $25,000 buys 500 shares. At the same stop, that risks $1,250, which is 5% of the account on one idea. Same chart, same stop, five times the risk. Buying power answers what you can open. The stop and the budget answer what you should open.
Forex lot sizes and a 0.2 lot position
Forex size is quoted in lots. A standard lot is 100,000 units of the base currency, a mini lot 10,000, a micro lot 1,000 and a nano lot 100. Platforms usually write these as 1.00, 0.10 and 0.01.
On a $10,000 account risking 1%, the budget is $100. With a 25-pip stop on EUR/USD, you can afford $4 per pip. A standard lot pays $10 per pip, so the size is 0.4 lots, or 40,000 units. A 0.2 lot position is 20,000 units, worth $2 per pip on EUR/USD, so the same 25-pip stop would risk $50.
Leverage, Notional Exposure and Overleveraging
Position size and leverage measure different things. Position size, as used here, is built from the loss at the stop. Leverage compares the full value of what you control (notional exposure) with the money in the account.
At an illustrative S&P 500 level of 7,000, one ES contract controls $350,000 of index exposure (7,000 × $50). On a $25,000 account, that is 14 times the account. One MES contract controls $35,000, or 1.4 times.
Both views matter. A 5-point stop on one ES risks $250, or 1%. But if the stop does not fill where expected, the notional is what you are exposed to. A 1% move in the index at that level is 70 points, which is $3,500 on one ES, or 14% of the account.
Overleveraging is what happens when size is chosen from margin or buying power and the stop is an afterthought. The account looks fine until an ordinary move, a gap or a missed stop turns one trade into a double-digit drawdown. Sizing from the stop keeps the planned loss small. Watching notional reminds you how large the unplanned loss can be.
Building a Position Sizing Strategy
A position sizing strategy is the rule you apply the same way on every trade, plus the conditions under which you change it. The main families are:
- Fixed dollar risk. The same dollar loss per trade. Easy to follow, and size only changes when stop distance changes.
- Fixed fractional. The same percent of current equity per trade. Size drifts with both equity and stop distance, so it shrinks automatically through drawdowns.
- Volatility-based. The stop distance comes from a volatility measure such as average true range, so quiet markets allow more units and fast markets fewer, while dollar risk stays fixed.
Any of these can work if you apply it every time. The part most traders skip is aggregate risk. A 1% cap per trade is not a portfolio policy. Four open positions at 1% each put 4% at risk at once, and if they are all long index futures, they behave like one bigger position. Add up the dollars at risk across everything open before adding the next trade, and treat correlated positions as one.
Adapting to conditions should be written down in advance, not decided mid-session. Common written rules are cutting risk by half after a set drawdown, cutting size before scheduled high-impact news, and returning to normal size only after the account recovers a defined amount.
Related lesson: Fixed fractional position sizing
The Psychology of Position Sizing
Position sizing is mostly a decision about feelings you have not had yet, made while you are calm. The right size is one you can watch go to the stop without moving the stop, closing early, or doubling up. If a normal loss makes your pulse jump, the size is too big for you, whatever the formula says.
Size also drifts with mood. After a loss, it is tempting to go bigger to make it back. After a run of wins, it feels safe to press. Both feel like conviction in the moment, and both are how a good month turns into a bad one. A precommitted rule takes that choice away before the emotion shows up, and the journal tells you whether you kept it.
Position sizing mistakes and the check for each
| Mistake | How it feels in the moment | The check that catches it |
|---|---|---|
| Rounding up | One more contract is close enough | Round down and recompute actual risk |
| Moving the stop to fit the size | The stop was too wide anyway | Write the stop from the chart before sizing |
| Sizing up after a loss | I need to win it back | Fixed risk until the next scheduled review |
| Sizing up after a win streak | I am reading the market well | Size only changes at a planned review |
| Stacking correlated trades | Each one is only 1% | Total open risk across related positions |
| Sizing from buying power | The account can carry it | Compute dollars lost at the stop first |
Related lesson: Trading psychology
Position Sizing Inside a Drawdown Limit
Evaluation and funded accounts add a second constraint. Most run a maximum drawdown limit, and that limit, not your account balance, is the real number you are sizing against.
Take an illustrative $50,000 account with an illustrative $2,400 drawdown limit. Risking 1% means $500 per trade, and $2,400 ÷ $500 = 4.8, so the fifth full loss in a row ends the account. Risking $240 per trade (0.48%) allows 10 full losses. Losing streaks of five to ten trades are ordinary over a few hundred trades, so per-trade risk on a drawdown-limited account usually ends up smaller than on a personal account. The limit is a distance you have to survive, not a target you get to approach.
On our accounts, size is capped by contract limits rather than margin: 1 mini or 10 micros on a 25K account and 4 minis or 40 micros on a 50K, with 10 micros counting as one mini. Our commission schedule shows 10 MES at $18.20 round trip against $5.76 for 1 ES, so once your size reaches ten micros, the mini is cheaper. Our drawdown is end-of-day trailing and enforced in real time, and funded accounts are simulated, so the size that passes a rule check still has to fit the drawdown you can survive.
Related lesson: Maximum drawdown
A Position Sizing Checklist for Every Order
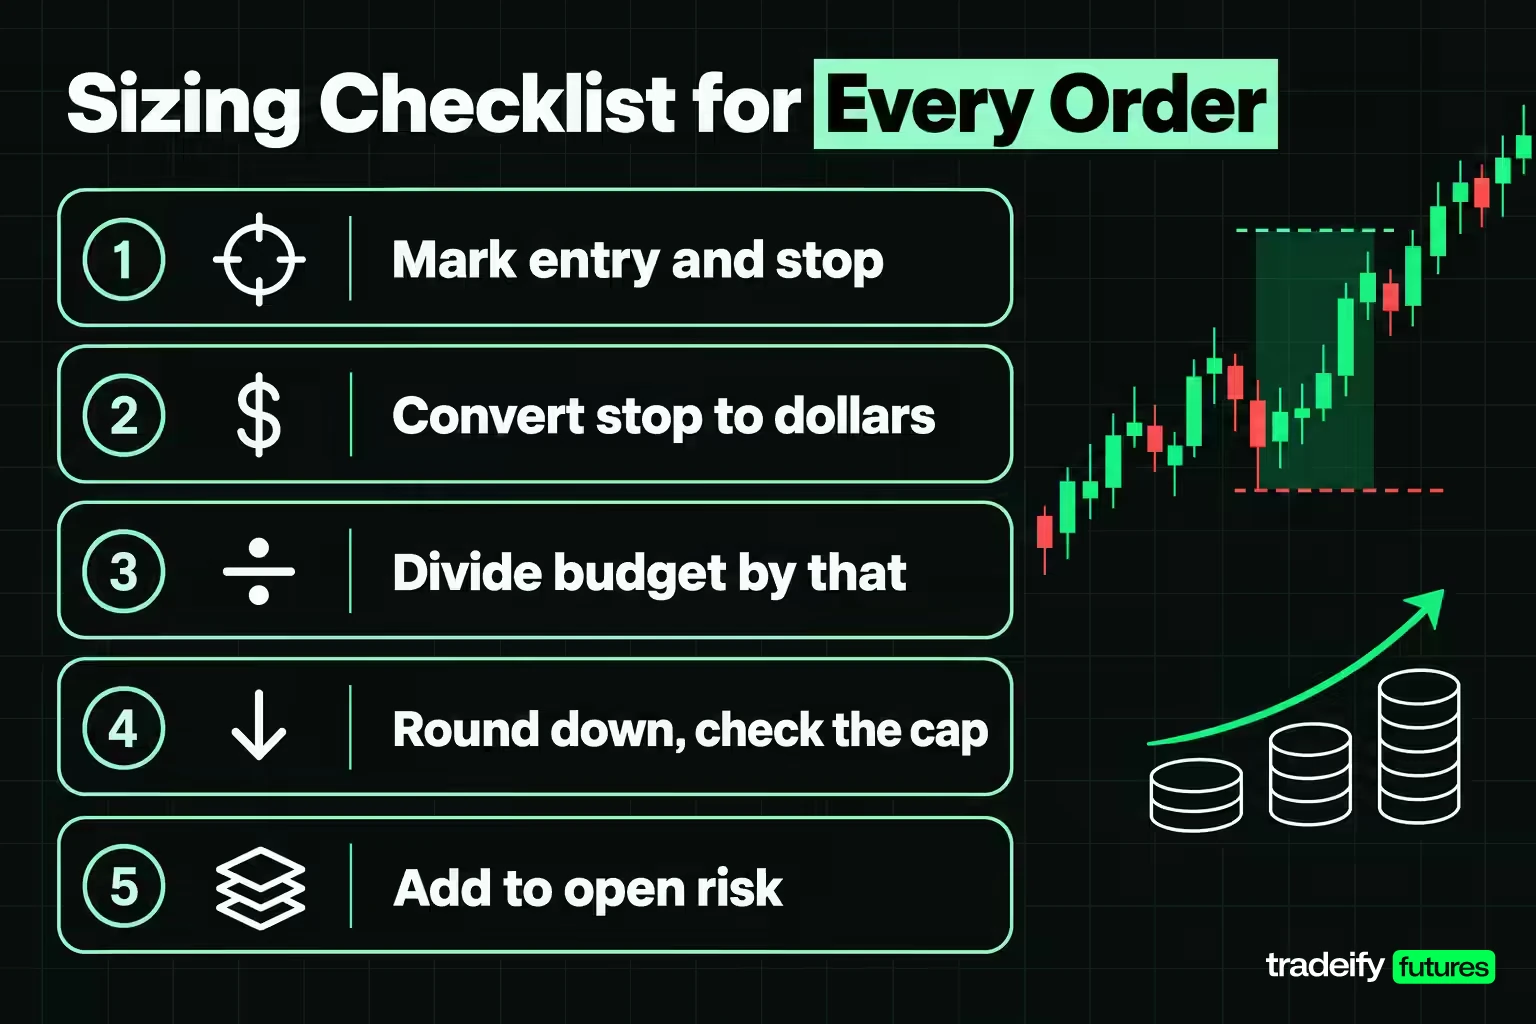
Run these position sizing steps before the order goes in, not after the loss.
- Mark the entry and the stop from the chart before thinking about size.
- Convert the stop distance into dollars per contract, share or lot.
- Divide the risk budget for this trade by that figure.
- Round down, then confirm the actual risk is still inside your cap. If the answer is zero, the trade is not available at this size and product.
- Add this trade's risk to the risk already open, and confirm the total fits your daily and drawdown limits.
Position Sizing FAQ
How do you calculate position size?
Multiply your account equity by your risk percentage to get the risk budget. Divide that by the stop distance times the value per point, tick, pip or share, then round down. On a $25,000 account risking 1%, a 5-point ES stop risks $250 per contract, so the answer is one contract.
What is the 3-5-7 rule in stocks?
The 3-5-7 rule caps risk at 3% on one trade and total open risk at 5%, and aims for winners of at least 7%. It is an informal heuristic, not a regulatory or exchange rule. On a $50,000 account those caps are $1,500 per trade and $2,500 total, and many traders run a tighter per-trade figure.
What is the 5-3-1 rule in forex?
It is an informal framework that limits focus to up to five currency pairs, three defined strategies and one main trading session. It organizes attention but does not set position size or stops. Five pairs that share the US dollar can still behave like one large dollar position.
What does 0.2 lot size mean?
A 0.2 lot is 20,000 units of the base currency, two tenths of a standard lot. On EUR/USD it is worth about $2 per pip, so a 25-pip stop risks $50.
Does position sizing replace a stop loss?
No. Position sizing assumes the stop will be hit at a known distance. Without a stop, the dollar risk is unknown, and the size no longer maps to any risk figure.
Futures, forex and other leveraged products carry substantial risk, and losses can exceed what you planned or deposited, especially when a stop fills beyond its price. No position sizing method prevents losses or guarantees results. Evaluation and funded accounts are simulated, and simulated results are not live trading results. This article is education, not individual investment advice.


