




TL;DR: Payout ratio is dividends per share divided by EPS, so a $1.60 dividend on $3.20 of EPS is a 50% payout ratio. Dividend yield divides the same dividend by the share price, so $1.60 on a $40 stock yields 4%. A yield can rise just because the price fell, so read it next to the payout ratio and the free cash flow payout ratio. Ratios over 100%, the REIT rule to pay out 90% of taxable income and cyclical earnings all need context before you call a dividend safe.
A 7% dividend yield on a screener is hard to ignore. The catch is that yield also rises when a share price falls, even while the business behind it gets weaker. The payout ratio answers the question the yield cannot: how much of the company's earnings the dividend uses up.
Read the two numbers together and you see both sides of a dividend. Yield tells you what the payment looks like against today's price. The payout ratio tells you what it looks like against profit, and whether there is room left if profit drops.
What Is a Payout Ratio
The payout ratio is the percentage of a company's earnings paid to shareholders as dividends. If a company earns $3.20 per share and pays $1.60 per share in annual dividends, its payout ratio is 50%. Half of the profit went out the door as cash to shareholders, and half stayed in the business.
The part that stays is called the retention ratio. Retention ratio and payout ratio always add up to 100% of the earnings figure you used. A company retaining earnings can spend them on equipment, research, acquisitions, paying down debt, buying back shares or simply holding cash.
Investor.gov describes a dividend as a portion of a company's profit paid to shareholders. That wording is why the payout ratio matters: the dividend is supposed to come from profit. When the payout ratio climbs toward or past 100%, the dividend is consuming all of that profit or more, and the money has to come from somewhere else.
The payout ratio does not tell you what return you earn on your purchase price. That is the job of dividend yield. The payout ratio measures the relationship between the dividend and the company's own earnings, so it is a coverage measure, not an income measure.
Related lesson: Dividends explained
How to Calculate the Payout Ratio
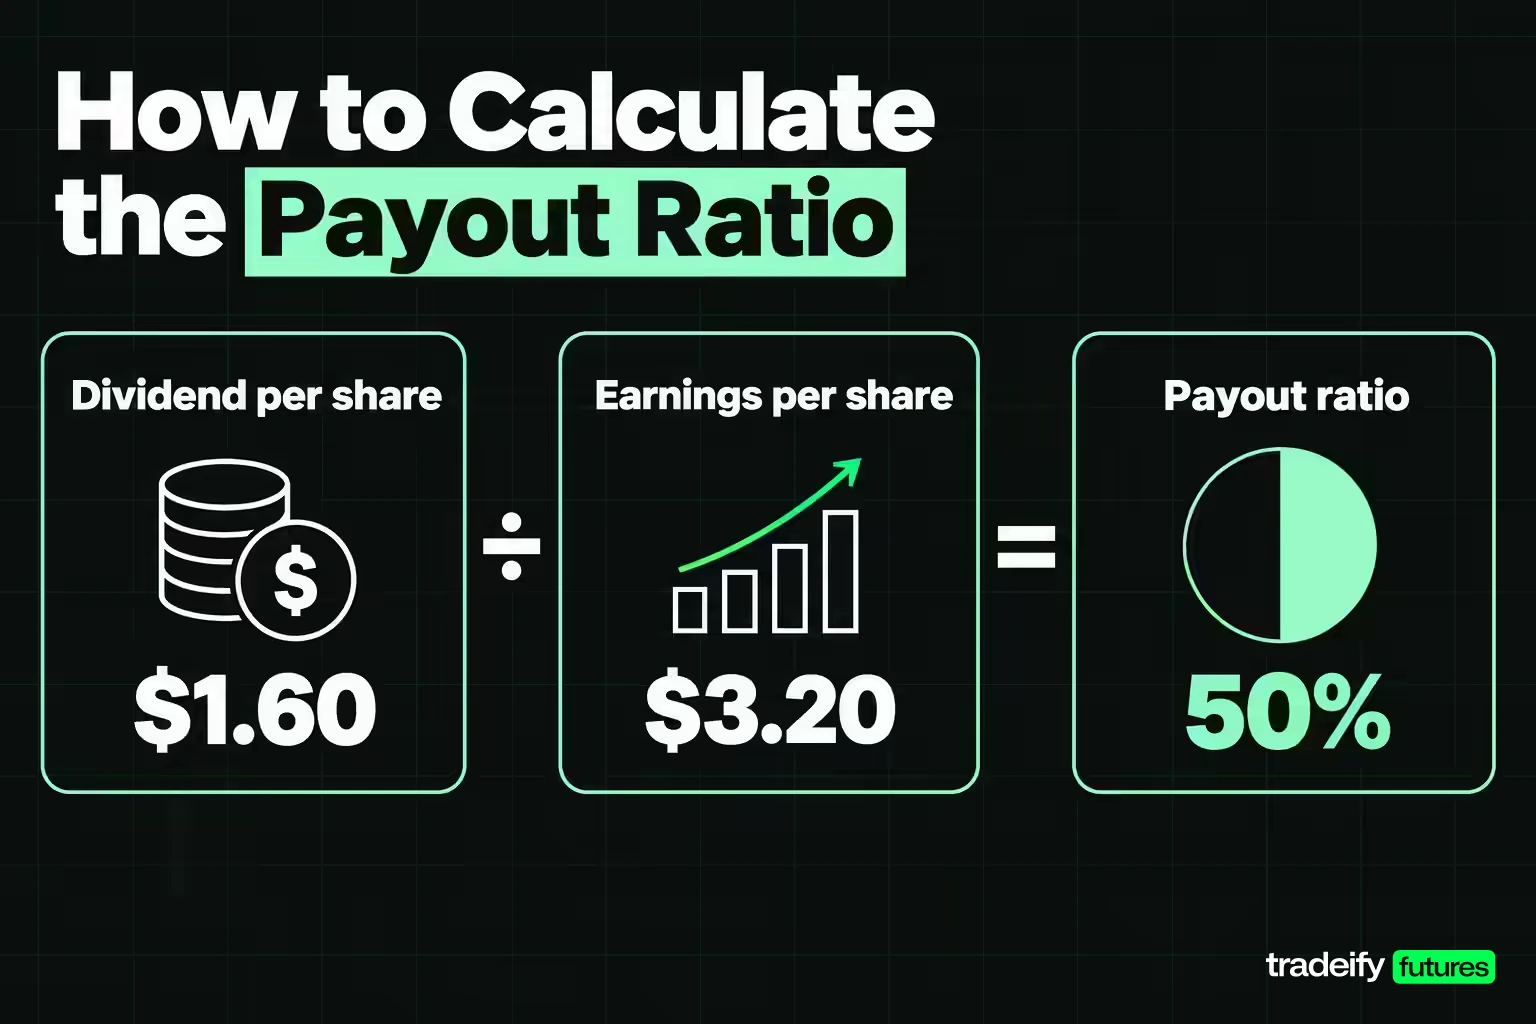
The payout ratio can be calculated three ways. All three give the same answer when the inputs come from the same period.
| Payout ratio formula | Inputs | When it is handy |
|---|---|---|
| Per-share formula | Dividends per share divided by earnings per share | Reading a quote page or screener |
| Company-totals formula | Total common dividends divided by net income available to common shareholders | Working from the income statement and cash flow statement |
| Retention formula | 1 minus the retention ratio | When you already know how much the company keeps |
Per-share payout ratio formula
Payout ratio = Dividends per share ÷ Earnings per share × 100
With an annual dividend of $1.60 and earnings per share of $3.20, the math is $1.60 ÷ $3.20 × 100 = 50%.
Company-totals payout ratio formula
Payout ratio = Total common dividends ÷ Net income available to common shareholders × 100
Take an illustrative company with net income of $500 million. It owes $20 million in preferred dividends, which rank ahead of common shareholders, so net income available to common shareholders is $480 million. It pays $240 million in common dividends. The payout ratio is $240 million ÷ $480 million = 50%, and the company retains $240 million.
Subtracting preferred dividends first matters. Common shareholders only have a claim on what is left after preferred holders are paid, so leaving them in makes the payout ratio look lower than it really is.
Payout ratio from the retention ratio
Payout ratio = 1 − Retention ratio
If a company retains 50% of its earnings, its payout ratio is 50%. This version is handy in growth math, where the retained share drives how fast a business can expand without new money.
How to calculate dividends per share
Dividends per share is total common dividends divided by common shares outstanding. In the illustrative company, $240 million ÷ 150 million shares = $1.60 per share. A company paying $0.40 per quarter pays $0.40 × 4 = $1.60 a year. Use the regular dividend only, and keep any one-time special dividend separate.
The per-share and company-totals formulas agree in this example because 150 million shares turn $480 million of net income into $3.20 of earnings per share and $240 million of dividends into $1.60 per share.
EPS, Dividends per Share and the Payout Ratio
The payout ratio is built from two per-share numbers: dividends per share on top and earnings per share (EPS) underneath. Investor.gov defines EPS as a public company's net profit divided by the number of its common shares. Every quirk in either number flows straight into the ratio.
Dividends per share tends to move slowly. Boards usually set a regular dividend and change it rarely. EPS moves every quarter with sales, costs, interest, taxes and one-off accounting items. That difference is why most big swings in a payout ratio come from the denominator, not the dividend.
Take the illustrative company paying $1.60 a year with EPS of $3.20, a 50% payout ratio. If a bad year drops EPS to $2.00 and the board holds the dividend, the payout ratio jumps to $1.60 ÷ $2.00 = 80%. Nobody touched the dividend policy. The cushion just got thinner, and the ratio is the first place that shows it.
Which EPS figure to use in the payout ratio
Several EPS figures can sit on the same quote page, and each gives a different payout ratio.
- Basic vs. diluted EPS. Diluted EPS counts shares that options, convertibles and similar securities could add. It is lower than basic EPS, so the payout ratio built on it is a little higher and a little more conservative.
- Reported vs. adjusted EPS. Reported (GAAP) EPS includes one-off charges and gains. Adjusted EPS strips some of them out by management's own definition. A ratio on adjusted EPS can look healthier than one on reported EPS.
- Trailing vs. forward EPS. Trailing EPS covers the last twelve months of actual results. Forward EPS is an estimate. A forward payout ratio depends on a forecast that may not arrive.
Pick one definition, write it down and use the same one for every company and every period you compare.
Dividend Yield vs. Payout Ratio
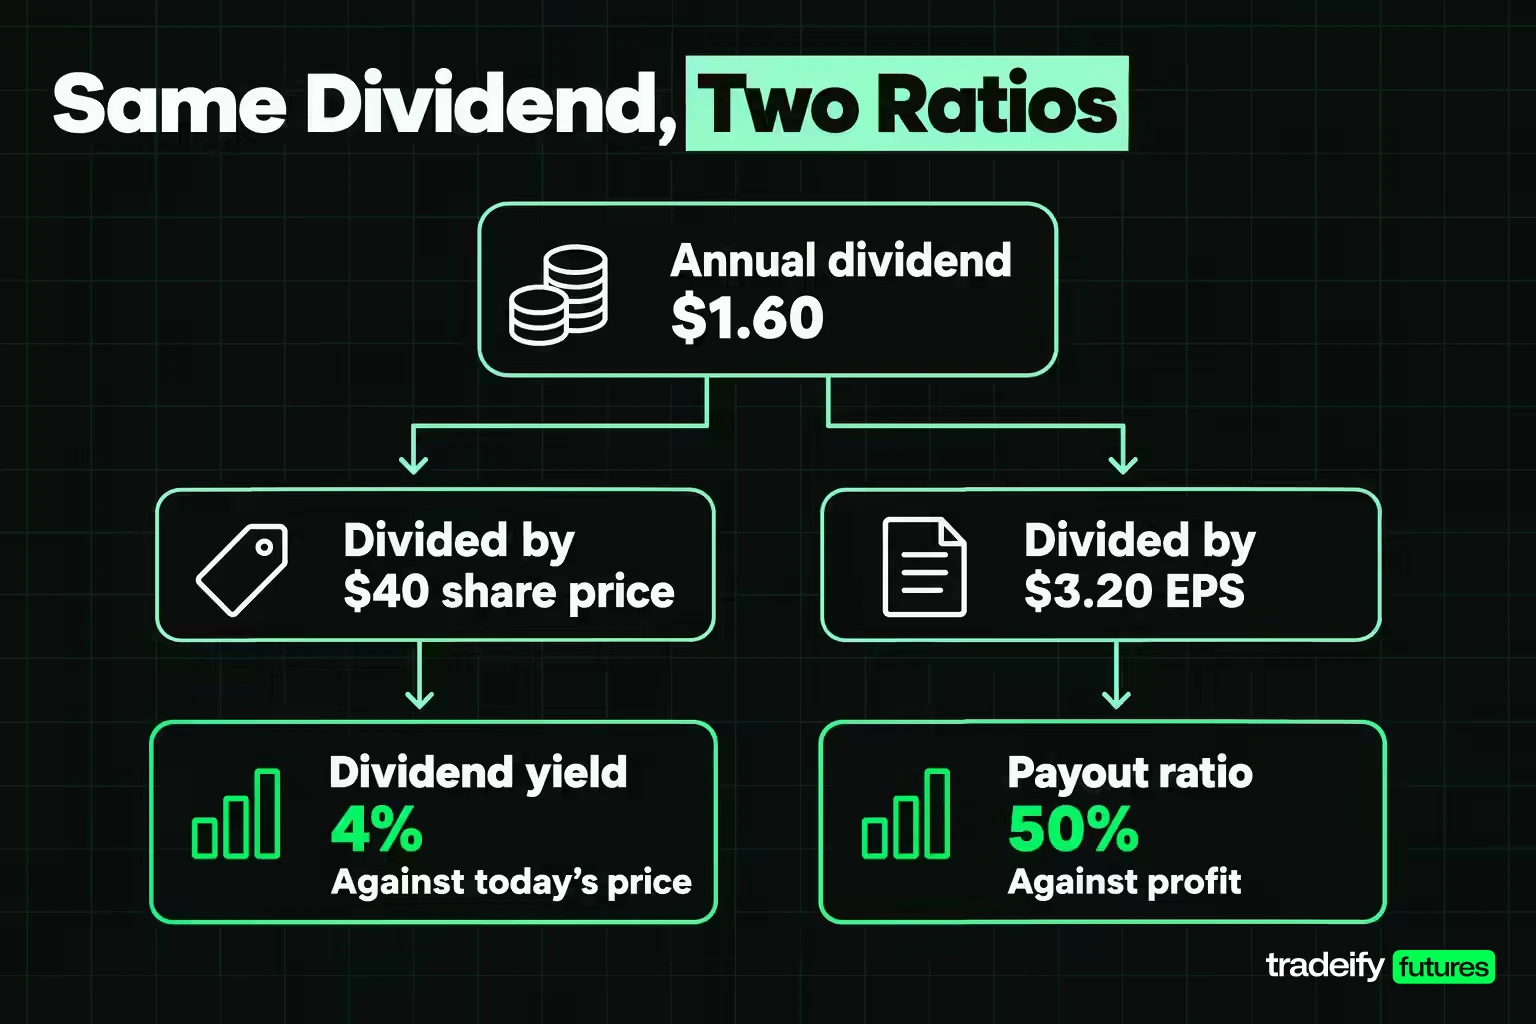
Dividend yield and the payout ratio share the same top number, the dividend, but divide it by different things. That is why they answer different questions.
Dividend yield = Annual dividends per share ÷ Current share price × 100
A stock at $40 paying $1.60 a year yields $1.60 ÷ $40 × 100 = 4%.
| Measure | Formula | Question it answers | What moves it |
|---|---|---|---|
| Dividend yield | Annual dividend per share divided by share price | How large is the dividend against today's price? | Price changes and dividend changes |
| Payout ratio | Dividends per share divided by EPS | How much of profit does the dividend use? | Earnings changes and dividend changes |
| Retention ratio | 1 minus payout ratio | How much profit stays in the business? | Earnings changes and dividend changes |
Worked example of yield and payout ratio moving apart
Use one illustrative company across three snapshots.
| Snapshot | Share price | Annual dividend | EPS | Dividend yield | Payout ratio |
|---|---|---|---|---|---|
| Starting point | $40 | $1.60 | $3.20 | 4% | 50% |
| Price falls | $32 | $1.60 | $3.20 | 5% | 50% |
| Earnings fall | $32 | $1.60 | $2.00 | 5% | 80% |
The yield reads 5% in both the second and third rows. The business behind those two rows is very different. In the second, the market marked the stock down but profit still covers the dividend twice. In the third, the dividend eats 80% of a smaller profit.
The shareholder in the second row did not get a raise. The yield went up because the price went down. Saving all three inputs (price, dividend and EPS) instead of just the two ratios is what lets you see which one moved.
Yield and payout ratio diagnostic
The two numbers together make a quick first-pass diagnostic. It tells you what to investigate, not what to buy or sell.
| Yield and payout combination | What it can mean | What to check next |
|---|---|---|
| Moderate yield, moderate payout ratio | Dividend covered with profit left over | Whether earnings and dividend held up through a full business cycle |
| High yield, moderate payout ratio | Covered today, but the market has marked the price down | Why the price fell, debt, guidance, coming earnings pressure |
| Moderate yield, high payout ratio | Price holding up while the dividend uses most of profit | Whether the earnings dip is temporary and what free cash flow says |
| High yield, high payout ratio | Falling price and falling earnings at the same time | Cash flow, debt, and any hints of a dividend review in filings |
There is a fifth case: no usable payout ratio. When EPS is zero or negative, dividing by it gives a meaningless or negative number, and the analysis has to move to cash flow and the balance sheet.
How to Interpret a Payout Ratio
A payout ratio is easiest to read as a band, then as a trend. The band tells you how much of profit the dividend uses. The trend tells you which way the cushion is moving.
| Payout ratio band | What the math says | Typical reason |
|---|---|---|
| Negative | The company lost money but still paid a dividend | A loss year, often from a one-off charge or a downturn |
| 0% | No dividend | Growth company, a suspended dividend, or a young business |
| Under 50% | More than half of profit is retained | Growth spending, debt paydown, a cautious board |
| 50% to under 100% | Most of profit is paid out | Mature business with fewer places to reinvest |
| 100% | The whole year's profit went to the dividend | Earnings dipped while the board held the payment |
| Over 100% | The dividend exceeded profit | Funded from cash, borrowing or past retained earnings, or the business is better measured another way |
Reading the payout ratio trend
One year's payout ratio is a snapshot. Five to ten years of payout ratios show how the board behaves. A ratio that drifts from 40% to 70% over five years tells a different story from one that bounces between 40% and 70% with the economy.
When the ratio jumps, find out which input moved. If the dividend rose and earnings rose with it, the board is sharing growth. If the dividend held and earnings fell, the cushion shrank. If the dividend rose while earnings were flat, the board is betting on future profit, and that bet is worth watching.
Observation versus confirmation in a payout ratio
A payout ratio over 100% is an observation, not a verdict. It becomes a warning when it lasts, when free cash flow tells the same story, and when debt is rising to fill the gap. A single quarter over 100% after a one-off write-down often says more about accounting than about the dividend.
What Is a Good Payout Ratio
There is no universal good payout ratio. A number that is comfortable for a utility or a property trust can be a red flag for a software company, and a ratio that looks stingy for a mature consumer brand can be normal for a fast-growing business.
The useful question is whether the ratio fits this company. Four comparisons settle most cases:
- Its own history. Five to ten years of payout ratios show the board's normal range. A ratio well above that range needs an explanation.
- Close peers. Compare companies with similar business models, capital needs and accounting.
- Cash coverage. The free cash flow payout ratio should tell a similar story to the earnings payout ratio.
- Stated policy. Many companies describe their dividend or capital return policy in annual reports and earnings materials. A ratio inside the stated policy is less surprising than one outside it.
Hard anchors for a good payout ratio
A few sectors have real rules that push payout ratios to a particular level, and they make better anchors than a screener's default threshold.
US real estate investment trusts must, under the tax code (26 U.S.C. 857), pay dividends at least equal to 90% of REIT taxable income to keep their tax status. A high payout ratio is built into the structure.
Large US banks are a different case. A 2018 Federal Reserve staff memo proposed removing a 30% dividend payout ratio that had been used as a threshold for heightened supervisory scrutiny of large banks' capital plans. Bank dividends are now governed mainly by capital buffers, so a bank's payout ratio says as much about regulation as about choice.
Outside those cases, treat any single "good" percentage as a starting point for questions. A payout ratio is good when profit and cash can cover it through a bad year, not when it clears a fixed line.
Payout Ratios by Industry and Life Cycle
Payout ratios differ between industries because businesses need different amounts of their profit to keep running and growing. They also change as a company ages.
Growth companies and mature companies
Investor.gov notes that growth stocks rarely pay dividends and are bought in the hope of capital appreciation, while income stocks pay dividends consistently, with an established utility as the typical example. A young company with plenty of places to reinvest usually keeps most of its profit. A mature company with steady demand and fewer projects to fund can afford to pay out more.
The life cycle is not one-way. A company that starts a dividend usually begins with a low payout ratio and raises it as growth slows. A company that runs into trouble may cut or suspend the dividend and drop back to 0%.
REIT payout ratios and FFO
Real estate investment trusts are the clearest case where the ordinary earnings payout ratio misleads. Investor.gov notes that most REITs pay out at least 100 percent of their taxable income. Net income for a property owner is reduced by large depreciation charges on buildings, even though many buildings hold or gain value.
Nareit created funds from operations (FFO) in 1991 to deal with that problem. FFO starts from net income and excludes real estate depreciation and amortization, gains and losses on sales of certain real estate, and certain real estate impairment write-downs. REIT investors usually check dividends against FFO per share instead of EPS.
Investor.gov also warns that non-traded REITs frequently pay distributions above their FFO, using offering proceeds and borrowings, which reduces the value of the shares. A REIT distribution above FFO is the property-trust version of a payout ratio over 100%.
Bank payout ratios
Banks run on capital rules that ordinary companies do not face. The Federal Reserve has said that a large bank's capital distributions are normally restricted principally by its stress capital buffer framework, and automatic restrictions apply if a bank falls short of that target. When comparing bank payout ratios, compare banks with banks.
Payout ratios for cyclical companies
Cyclical businesses (autos, chemicals, steel, energy and similar) can show wild payout ratios simply because earnings swing. Take an illustrative company paying a steady $1.50 dividend while EPS moves from $5.00 to $1.00 to $4.00 over three years. The yearly payout ratio reads 30%, then 150%, then 37.5%.
The middle year looks like a crisis and the other two look conservative. Averaging EPS across the cycle gives $3.33, and $1.50 ÷ $3.33 = 45%. For cyclical companies, judge the dividend against average earnings across a full cycle, and check whether the balance sheet can carry the dividend through the trough year.
Dividend Safety Warning Signs
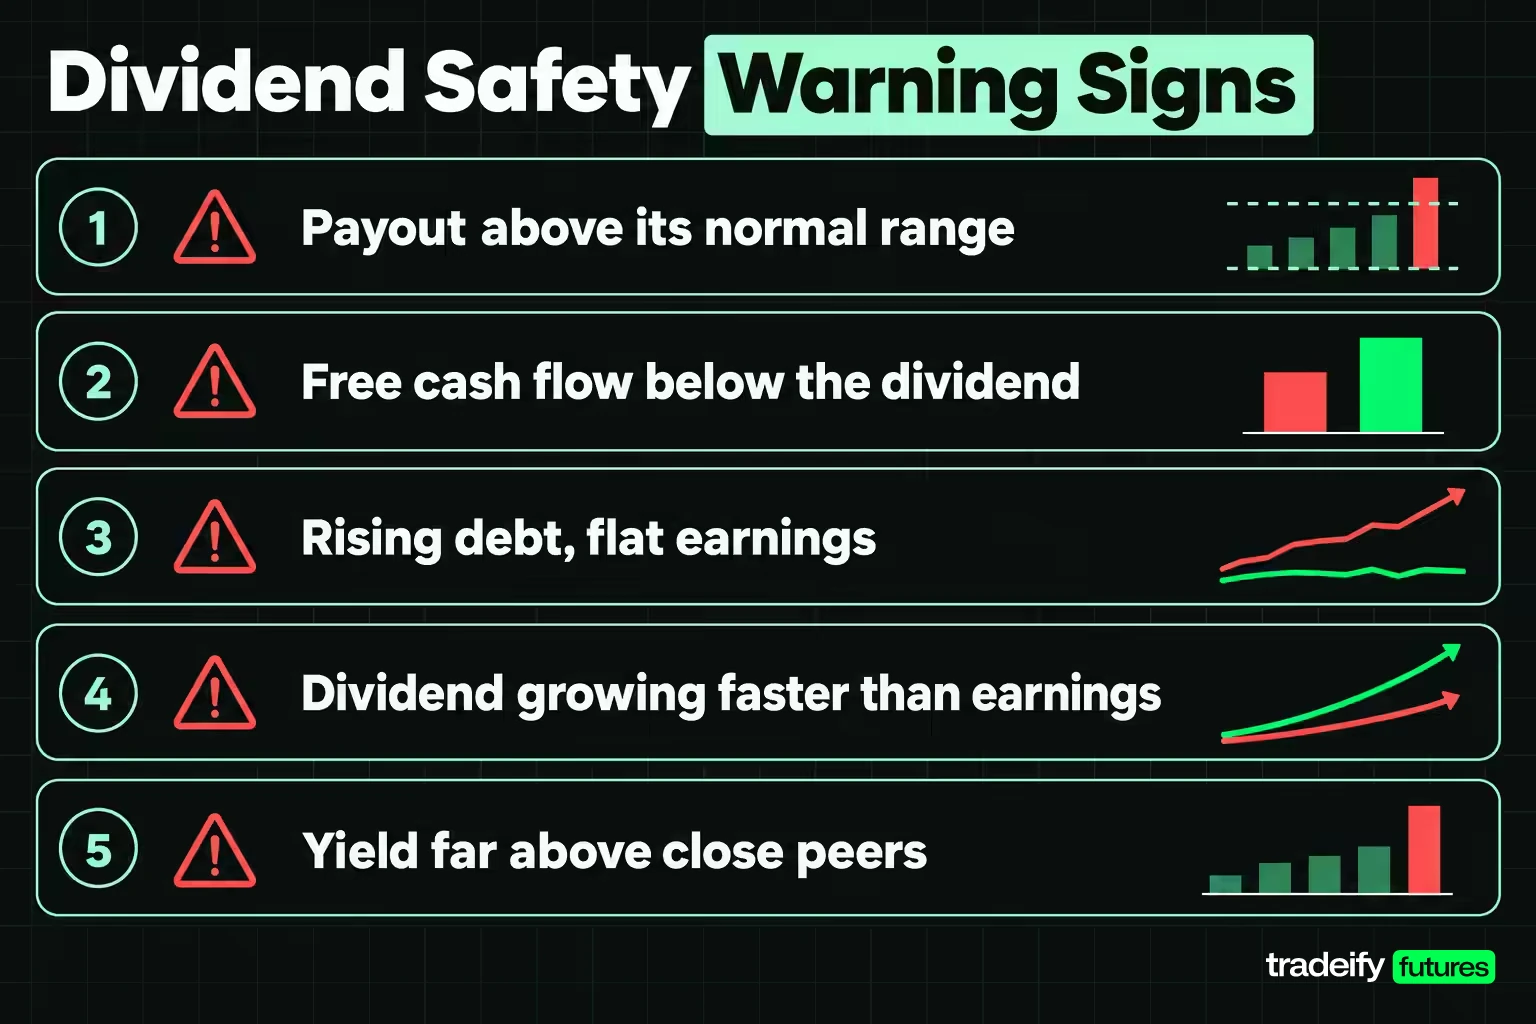
Dividend safety comes down to one question: can the company keep paying this dividend if its next two years are worse than its last two? The payout ratio starts the answer, and these warning signs finish it.
- Payout ratio above the company's own normal range, especially after several years of drift upward.
- Free cash flow below the dividend for more than a year, so the gap is filled by cash reserves or borrowing.
- Rising debt with no matching rise in earnings, or large debt maturities coming up.
- Dividend growth faster than earnings growth for several years in a row.
- A yield far above close peers, which often means the market expects a cut.
- Softer language in filings, such as a board that used to "expect" to raise the dividend now saying it will "review" it.
- Payout ratio built on adjusted earnings while reported earnings tell a weaker story.
No single sign proves a cut is coming. Two or three together deserve a hard look, and that is exactly when a high yield feels most tempting.
What is a dividend trap
A dividend trap is a stock whose high yield draws buyers in just before the dividend is cut. The math is simple. Take an illustrative stock paying $2.50 a year. At $50, it yields 5%. If the price falls to $25 because the business is struggling, the trailing yield doubles to 10%. If the company then cuts the dividend to $1.25, the yield at $25 is back to 5%, and the buyer who came for 10% is holding a stock that has halved.
The trap works because the yield shown on a quote page is usually trailing. It reflects dividends already paid, not the next one. The urge is to lock in the big number before others notice it, but the market usually noticed first. A double-digit yield next to a payout ratio over 100% and shrinking free cash flow is the classic setup.
Write an invalidation condition for the dividend
State in advance what would change your view. For example: "The dividend is covered by trailing earnings and free cash flow today, but two more quarters of falling EPS would push the payout ratio past the company's ten-year high." Writing it down keeps the analysis tied to evidence instead of to the income you were hoping for.
Free Cash Flow Payout Ratio
The free cash flow payout ratio compares dividends with free cash flow instead of earnings. Dividends are paid in cash, and earnings are an accounting measure, so the cash version is often the stronger test of dividend safety.
Free cash flow payout ratio = Total dividends ÷ Free cash flow × 100
The SEC staff describes free cash flow as a measure "typically calculated as cash flows from operating activities" less capital expenditures. Both numbers come from the cash flow statement.
Two free cash flow payout ratio cases
Take the illustrative company paying $240 million in dividends with an earnings payout ratio of 50%.
| Case | Operating cash flow | Capital expenditures | Free cash flow | Dividends | Free cash flow payout ratio |
|---|---|---|---|---|---|
| Heavy investment year | $600 million | $450 million | $150 million | $240 million | 160% |
| Light investment year | $700 million | $200 million | $500 million | $240 million | 48% |
In the first case the earnings payout ratio says 50%, but the dividend is 160% of free cash flow. The company is funding part of it from cash reserves or borrowing. In the second, cash backs up the earnings ratio.
Limits of the free cash flow payout ratio
The SEC staff notes that free cash flow has no uniform definition and should not be presented as cash left for discretionary spending, because many companies have mandatory debt payments that the measure does not subtract. Check how the company or data provider defines it, and look at several years, since capital spending comes in lumps. A single heavy investment year can make the free cash flow payout ratio look worse than the business is.
Payout Ratio and Dividend Growth
The payout ratio and dividend growth are tied together. A company can only grow its dividend faster than its earnings by paying out a larger share of those earnings, and that cannot go on forever.
Retention and sustainable growth
The share of profit a company retains is what funds growth without new borrowing or new shares. A common shortcut multiplies return on equity (ROE) by the retention ratio. An illustrative company earning a 12% ROE and retaining 50% of earnings could grow at about 12% × 50% = 6% a year from its own profit. Pay out more and that rate drops; keep more and it rises, as long as the company can reinvest at a similar return.
When dividend growth outruns earnings growth
Take the illustrative company with EPS of $3.20 and a $1.60 dividend. Earnings grow 4% a year, while the board raises the dividend 10% a year.
| Year | EPS | Dividend per share | Payout ratio |
|---|---|---|---|
| Year 0 | $3.20 | $1.60 | 50.0% |
| Year 1 | $3.33 | $1.76 | 52.9% |
| Year 2 | $3.46 | $1.94 | 55.9% |
| Year 3 | $3.60 | $2.13 | 59.2% |
| Year 4 | $3.74 | $2.34 | 62.6% |
| Year 5 | $3.89 | $2.58 | 66.2% |
Five years of 10% raises look generous, but the payout ratio climbed from 50.0% to 66.2%. Keep the same pace and the dividend passes EPS in year 13 ($5.52 against $5.33). Long dividend-growth streaks hold up when earnings grow with them. When raises outpace earnings, the payout ratio shows the bill coming due.
Buybacks and the Total Shareholder Payout
Dividends are only one way to return cash to shareholders. Share buybacks are the other, and a company's dividend payout ratio misses them entirely.
Total payout ratio with buybacks
Total payout ratio = (Dividends + Share buybacks) ÷ Net income × 100
Take the illustrative company with $480 million available to common shareholders and $240 million in dividends, a 50% dividend payout ratio. Add a $200 million buyback and the total payout ratio is ($240 million + $200 million) ÷ $480 million = 91.7%. The business is returning almost all of its profit, which the 50% figure alone hides.
How buybacks change the payout ratio inputs
A buyback shrinks the share count, which raises EPS without any rise in profit. At an illustrative $40 share price, a $200 million buyback retires 5 million shares, taking the count from 150 million to 145 million. EPS rises from $3.20 to $480 million ÷ 145 million = $3.31, about 3.4% higher. With the dividend per share unchanged, the dividend payout ratio falls slightly even though nothing about the business improved.
Why boards treat dividends as stickier than buybacks
Boards and investors tend to treat a regular dividend as a commitment and a buyback as optional. A 2018 Federal Reserve staff memo observed that during the financial crisis large bank holding companies reduced share repurchases early but continued to pay dividends at nearly the pre-crisis rate. That is the pattern to expect: when cash gets tight, buybacks usually go first, and the dividend is cut only when there is little else left.
Related lesson: Share buybacks
Limitations of the Payout Ratio
The payout ratio is a quick, useful filter, but it can mislead in several predictable ways.
- One-off items in earnings. A restructuring charge, write-down or asset sale moves net income without changing the regular dividend policy. A spike or dip in a single year may reflect accounting, not dividend safety.
- Different inputs on different websites. One data provider may divide the latest annual dividend by trailing earnings. Another may annualize the latest quarterly dividend and divide by forecast earnings. Both call the result a payout ratio.
- Special dividends. Investor.gov describes unscheduled payments as special or extra dividends. A large one inflates both trailing yield and payout ratio for a year. Strip it out when judging the regular policy.
- Negative earnings. A company that loses money but keeps paying shows a negative payout ratio. That does not mean the dividend carries negative risk; it means the ratio has stopped being useful.
- Earnings are not cash. Non-cash charges can depress earnings while cash stays strong, and heavy capital spending can drain cash while earnings look fine.
- Sector accounting. REITs, partnerships and other structures have their own preferred measures, so an EPS-based payout ratio can be the wrong tool.
- Mismatched periods. A forward dividend over trailing earnings, or one quarter of earnings against a full year of dividends, produces a ratio that describes no real period.
The payout ratio tells you where to look. The filings tell you why the number moved.
How to Check a Dividend Payout Step by Step
Checking a dividend payout takes the same steps every time, and doing them in order catches most bad data before it reaches a decision.
- Confirm the dividend input. Use regular dividends only, decide whether you want trailing or forward figures, and check whether a recent raise has been annualized.
- Match the earnings period. Pair annual dividends with annual earnings, or use one consistent trailing twelve-month window for both.
- Rebuild both ratios yourself. Calculate dividend yield and payout ratio from the raw inputs. This catches stale prices and provider differences.
- Add the cash test. Calculate the free cash flow payout ratio for the same period.
- Study the trend. Record five to ten years of dividends, EPS, payout ratios and free cash flow.
- Compare close peers. Use companies with similar business models and capital needs, and use FFO for REITs.
- Read the filings. Look for causes of earnings changes, debt maturities, capital spending plans and the stated dividend policy.
- Write the invalidation condition. Decide in advance which number would change your view.
Related lesson: How to research a stock
Why Dividend Payouts Matter in Index Futures Pricing
Dividend payouts matter even to traders who never buy a dividend stock, because expected dividends are part of how equity index futures are priced. CME's fair value formula for stock index futures is:
Fair value = Cash index × [1 + r × (days to expiration ÷ 360)] − Dividends
The futures buyer does not receive the dividends the index stocks pay before expiration, so the expected dividends come off the fair value.
Worked index futures fair value example
Use an illustrative index level of 7,000, an interest rate of 4% and 90 days to expiration. The financing part is 7,000 × (1 + 0.04 × 90/360) = 7,070. With 15 index points of expected dividends, fair value is 7,070 − 15 = 7,055.
If expected dividends rise to 20 points, fair value drops to 7,050. On the E-mini S&P 500 (ES), at $50 per index point, those 5 points equal $250 per contract. Dividend changes across the index are usually small next to daily price moves, but they are one reason futures and the cash index do not trade at the same level.
We don't offer cash stocks, options or single stock futures, so the dividend analysis in this guide is not something you would place in one of our accounts. Our accounts trade futures such as ES, NQ, YM and RTY and their micros, funded accounts are simulated, and every position is closed by 4:45 PM ET, so dividends reach our traders only indirectly through index futures pricing.
Related lesson: Cost of carry
Payout Ratio FAQ
Is a high payout ratio good or bad?
Neither by itself. A high payout ratio can fit a mature, steady business or a REIT, or it can mean the dividend has little room if earnings fall. Compare it with the company's history, its peers and its free cash flow.
Can a payout ratio be over 100%?
Yes. It means the dividend was larger than earnings for that period, so the gap came from cash reserves, borrowing or past profit. A single year over 100% can follow a one-off charge, but a ratio that stays over 100% needs another source of money to continue.
Why is a payout ratio negative?
A negative payout ratio appears when a company reports a loss but still pays a dividend. The number is mathematically correct but not useful for judging coverage. Look at cash flow, debt and the reason for the loss instead.
What is the 25% dividend rule?
The best-documented 25% dividend rule is FINRA Rule 11140, which sets ex-dividend dates. For distributions under 25% of the security's value, the ex-dividend date is normally the record date. For distributions of 25% or more, such as a $3 special dividend on a $10 stock, the ex-dividend date is the first business day after the payable date.
How much do you need for $1,000 a month in dividends?
You need about $300,000 at an illustrative 4% yield, because $1,000 a month is $12,000 a year. At 3% the figure rises to about $400,000, and at 6% it falls to about $200,000, before taxes. A higher yield needs less money but often carries a higher payout ratio and more risk of a cut.
How do you calculate dividend payout per share?
Divide total common dividends paid by the number of common shares outstanding. A company paying $240 million across 150 million shares pays $1.60 per share. For a quarterly payer, multiply the regular quarterly dividend by four.
Is dividend yield the same as the payout ratio?
No. Dividend yield divides the annual dividend by the share price and describes income against what you pay. The payout ratio divides the dividend by earnings and describes how much of profit the dividend uses.
This guide is for education only and is not investment, tax or financial advice. Dividends are not guaranteed and can be reduced or stopped at any time, stock prices can fall, and you can lose money you invest. Futures use leverage, so losses can exceed what you expect, and funded prop-firm accounts are simulated.


