




TL;DR: Elliott Wave Theory says trends move in five waves and correct in three, and a count only stands if it passes three hard rules. On three years of ES and NQ daily closes, roughly one in ten five-swing sequences passed all three rules. Use a wave count to set invalidation levels and risk, not to promise exact targets.
Elliott Wave Theory promises a map of where price sits inside a larger move. The catch is timing. A count can look perfect on Friday's chart and still have told you nothing useful on Tuesday, when you had to decide whether to enter, wait or get out.
This guide covers the theory the way the textbooks lay it out: the five-three pattern, the rules, the corrective shapes, the Fibonacci guidelines and the vocabulary. Then it tests those rules mechanically on three years of E-mini S&P 500 (ES) and E-mini Nasdaq-100 (NQ) daily data, so you can see how often a legal count actually appears, which rule does the rejecting, and how close a real count sits to being invalid.
What Is Elliott Wave Theory

Elliott Wave Theory is a form of technical analysis that says collective investor psychology swings between optimism and pessimism in repeating sequences, and that those swings leave recognizable patterns in price.
The basic unit is an eight-wave cycle:
- Motive phase. Five waves in the direction of the larger trend, numbered 1 through 5. Waves 1, 3 and 5 push with the trend. Waves 2 and 4 are smaller pullbacks against it.
- Corrective phase. Three waves against the larger trend, lettered A, B and C. The correction gives back part of the five-wave advance.
- Bear markets. The pattern inverts. The five-wave motive phase runs down and the three-wave correction runs up.
The theory's central claim is that this pattern is fractal. Each motive wave subdivides into five smaller waves and each corrective wave into three, and each completed cycle becomes one wave of a larger cycle. Count every subdivision of a completed pattern at the third level and you get 89 waves for the motive pattern and 55 for the corrective one. Those are Fibonacci numbers, which is how Fibonacci ratios became part of Elliott wave analysis.
In plain terms, Elliott Wave Theory asks you to read a trend as three pushes separated by two pauses, followed by a pullback in three parts. Spotting that shape on an old chart is easy. Deciding which push you are in while it is still unfolding is the actual skill, and the place most counts go wrong.
Where Elliott Wave Theory Came From
Elliott Wave Theory is named for Ralph Nelson Elliott (1871 to 1948), an American accountant who studied stock market price records in the 1930s and concluded that prices moved in repeating patterns rather than at random.
Elliott published the idea in The Wave Principle in 1938, summarized it in a series of Financial World magazine articles in 1939, and gave his fullest account in Nature's Laws: The Secret of the Universe in 1946. He later linked the wave counts to the Fibonacci sequence and said he had developed the wave principle before he had heard of Fibonacci.
After Elliott's death in 1948, others carried the method forward:
- Charles Collins published The Wave Principle and helped introduce it to Wall Street.
- Hamilton Bolton, founder of The Bank Credit Analyst, used wave analysis in his market commentary through the 1950s and 1960s.
- A. J. Frost (1908 to 1999), introduced to the method by Bolton, became one of its best-known practitioners.
- Robert Prechter, according to standard histories of the method, found Elliott's work while working as a market technician at Merrill Lynch in the 1970s, and his newsletter spread wave analysis widely during the 1980s bull market. Frost and Prechter co-wrote Elliott Wave Principle: Key to Market Behavior, a widely used reference text.
That lineage matters for one practical reason. Most of the rules and guidelines traders quote today come from that book and from Elliott Wave International's later material, not from Elliott's own writing alone.
The Crowd Psychology Behind Each Elliott Wave
Elliott wave practitioners describe each wave as having a personality that reflects the crowd's mood at that point. The common descriptions, written for an advancing market, run like this:
- Wave 1. Rarely obvious. The news is still bad and most traders treat the rally as another bounce to sell.
- Wave 2. Often retraces much of wave 1. Fear returns, and many traders are convinced the old downtrend is back.
- Wave 3. Usually the strongest and broadest move. Fundamentals start to improve and the crowd joins the trend partway through.
- Wave 4. Often slow and sideways. Progress stalls and traders get impatient.
- Wave 5. The final push. Sentiment is broadly positive, and momentum indicators often fail to confirm the new high (divergence).
- Waves A, B and C. Wave A is often read as just a pullback, wave B as the trend resuming, and wave C as the move where most traders accept the trend has changed.
These descriptions are useful as a checklist when two wave counts are both legal. They are not evidence on their own. Sentiment can be read into almost any wave after the fact, and it is tempting to read the mood you want into the chart you already hold a position on. Treat wave personality as a tiebreaker between counts, not as the reason for a count.
The Three Elliott Wave Rules for an Impulse
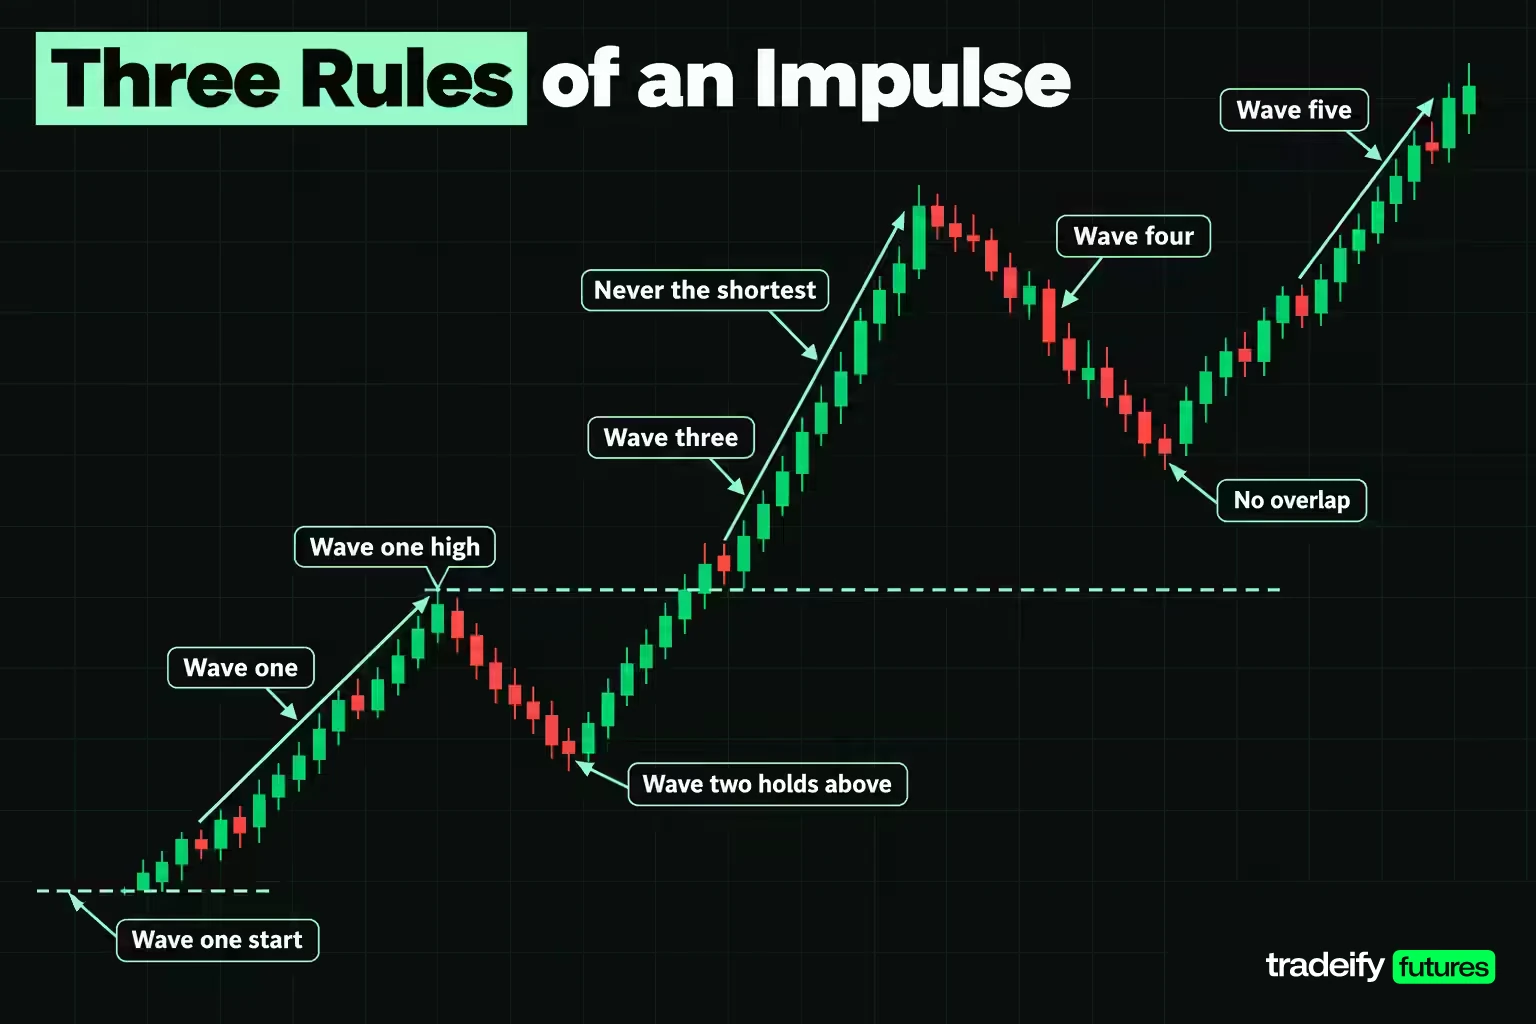
Elliott wave analysis rests on three hard rules for a standard five-wave impulse. A count that breaks any one of them is not an impulse and has to be relabelled.
- Wave 2 never retraces more than 100% of wave 1. If the pullback goes beyond the start of wave 1, what you called wave 1 was not the start of an impulse.
- Wave 3 is never the shortest of waves 1, 3 and 5. It does not have to be the longest. It only cannot be the shortest.
- Wave 4 never enters the price territory of wave 1. In an advance, the wave 4 low must stay above the wave 1 high.
Everything else in the method is a guideline. Wave 3 is often the extended wave. Waves 2 and 4 tend to alternate between sharp and sideways forms. Wave 4 often retraces less than 38.2% of wave 3. A guideline that fails invalidates nothing. A rule that fails invalidates the count.
That split is the most useful thing a trader can take from Elliott Wave Theory. The rules give you a specific price where your reading of the market is wrong. In an advance labelled as waves 1 and 2, the start of wave 1 is that price. Once wave 3 is done, the top of wave 1 becomes the line that wave 4 cannot cross.
One caveat applies to futures traders. Elliott Wave International notes that the no-overlap rule holds for unleveraged cash markets, while futures can produce short-term price extremes that cash markets would not, so overlaps can occasionally appear on daily and intraday futures charts. That is a reason to check a futures count against the underlying index when a rule breaks by a few ticks, not a licence to ignore the rule.
Impulse Wave Structure With Extensions and Truncation
An impulse wave in Elliott wave terms subdivides 5-3-5-3-5. Waves 1, 3 and 5 are themselves motive five-wave structures, and wave 3 is always an impulse. Waves 2 and 4 are three-wave corrections.
Extended Elliott waves
Most impulses contain an extension, which is one motive wave that stretches out with exaggerated subdivisions. Elliott Wave International describes the pattern this way:
- The vast majority of impulses extend in one and only one of waves 1, 3 and 5.
- In the stock market, wave 3 is the most commonly extended wave. Extended fifth waves are common in major commodity bull markets.
- When wave 3 extends, wave 5 tends to look like wave 1 in size and construction. When waves 1 and 3 are about equal, wave 5 is more likely to extend.
- An extended wave can subdivide so clearly that the impulse shows nine waves of similar size instead of five. A count of nine and a count of five carry the same technical meaning.
The practical use is real-time. If what you labelled as wave 3 turns out shorter than both wave 1 and wave 5, or wave 4 overlaps wave 1, Elliott Wave International's guidance is that the move is usually an extended wave 3 still developing, labelled as a series of smaller 1-2 waves inside it.
Truncated fifth waves
A truncation is a fifth wave that fails to move beyond the end of wave 3. It usually still contains the five subwaves a fifth wave needs, and it often follows a particularly strong wave 3. Elliott called it a failure. The message it sends is underlying weakness in an advance (or strength in a decline), and it tends to cut an expected wave 5 target short.
Leading and Ending Diagonals in Elliott Wave Analysis
A diagonal is an Elliott wave motive pattern that moves with the trend but bends two impulse rules. It is a five-wave structure in which wave 4 almost always overlaps wave 1, and all five subwaves are threes, giving a 3-3-3-3-3 count. Like an impulse, no reactionary wave fully retraces the wave before it, and wave 3 is never the shortest.
Diagonals usually take a wedge shape between two converging trend lines. There are two kinds:
- Ending diagonal. Appears mainly in the wave 5 position, occasionally as wave C, when the preceding move has gone too far too fast. It signals exhaustion of the larger move. The fifth wave often ends in a throw-over, a brief break of the line connecting the ends of waves 1 and 3. A rising ending diagonal is usually followed by a sharp decline that retraces at least to where the diagonal began.
- Leading diagonal. Appears occasionally in the wave 1 position of an impulse or the wave A position of a zigzag. It is usually followed by a deep retracement. Elliott Wave International warns that what looks like a leading diagonal is more often a series of first and second waves, which is the start of a powerful wave 3 rather than a tired one.
The trading implication of an ending diagonal is the opposite of a clean impulse. An impulse says the trend has more to give. An ending diagonal says the trend is spent, and a quick reversal is the expected outcome.
Elliott Wave Corrective Patterns
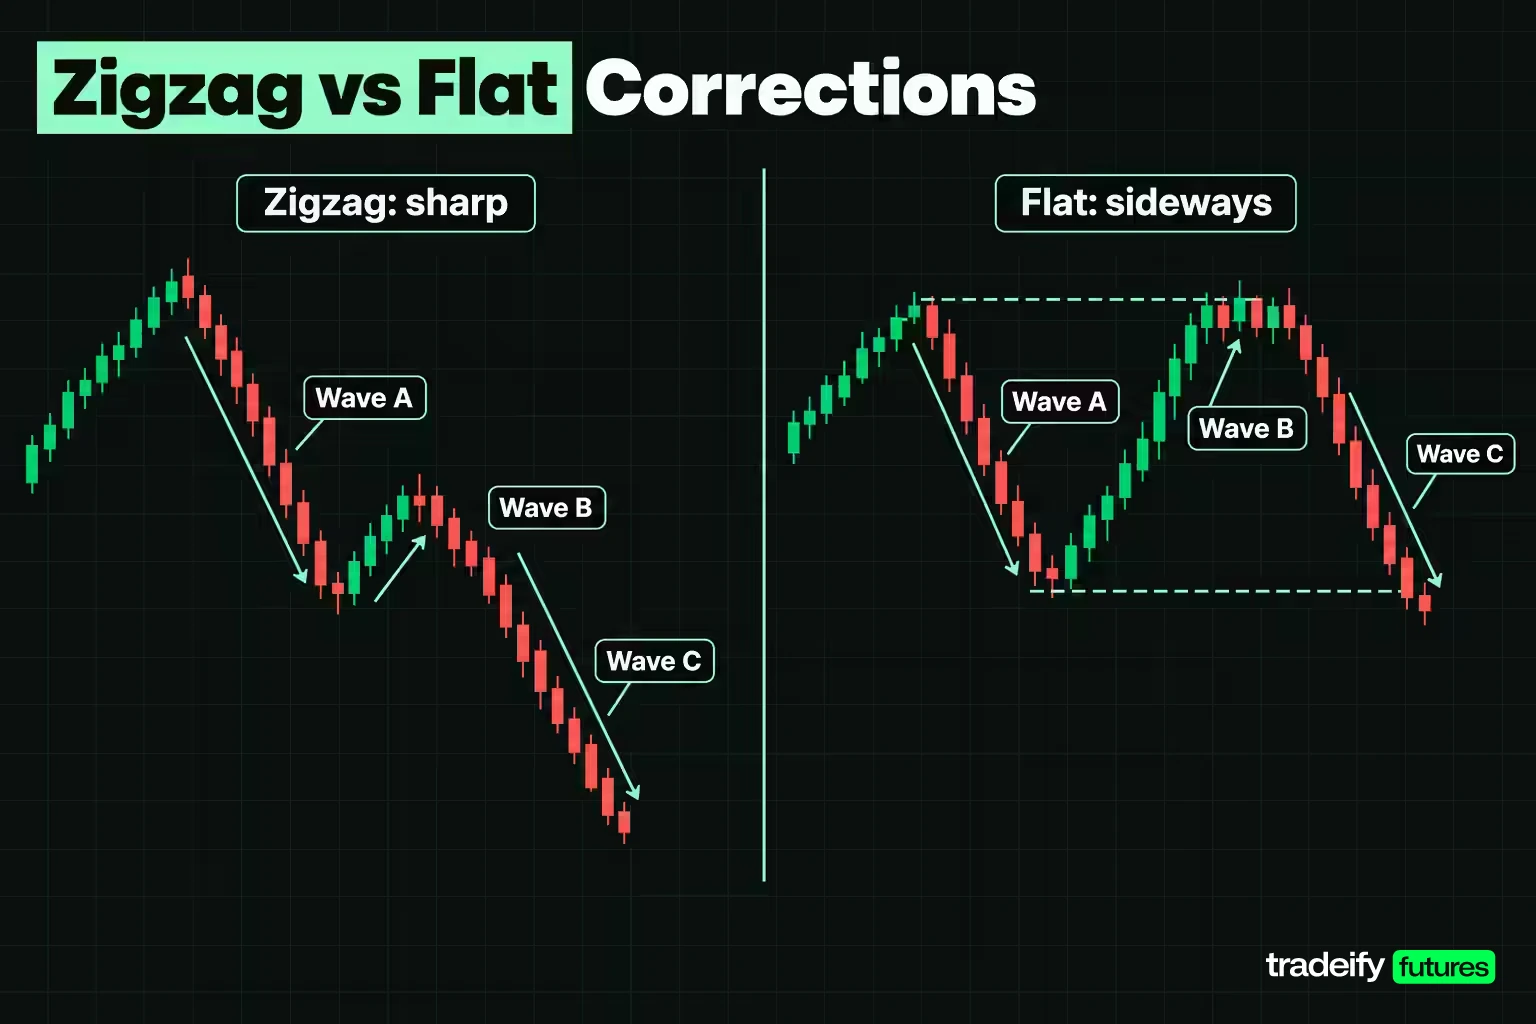
Elliott wave corrections move against the trend of one larger degree, and they are harder to read than impulses because they come in more shapes and often only become clear after they finish. The single firm rule is that a correction is never a five. A five-wave move against the larger trend is only part of a correction, never all of it.
Corrections fall into four families:
| Elliott corrective pattern | Subwaves | Shape | Where it tends to appear |
|---|---|---|---|
| Zigzag (single, double or triple) | 5-3-5 | Sharp, angled against the trend | Wave 2 frequently, wave 4 rarely |
| Flat (regular, expanded or running) | 3-3-5 | Sideways | Wave 4 frequently, wave 2 rarely |
| Triangle (contracting, barrier or expanding) | 3-3-3-3-3 labelled A to E | Sideways, overlapping, narrowing or widening | Wave 4, wave B, or the final X wave of a combination |
| Combination (double three W-X-Y, triple three W-X-Y-X-Z) | Two or three simple corrections joined by X waves | Sideways, extended in time | Wherever a flat extends sideways |
Zigzags
A zigzag is a sharp correction labelled A-B-C. Wave B ends noticeably short of the start of wave A, and wave C travels well beyond the end of wave A. When the first zigzag falls short of a normal target, a second (and at most a third) can follow, joined by an intervening three, forming a double or triple zigzag.
Flats
A flat subdivides 3-3-5. In a regular flat, wave B ends near the start of wave A and wave C ends slightly beyond the end of wave A. In an expanded flat, which is far more common, wave B goes beyond the start of wave A and wave C ends well beyond the end of wave A. In a running flat, wave B goes well beyond the start of wave A but wave C falls short of wave A's end. Elliott Wave International warns that running flats are rare and that labelling one early will usually be wrong.
Triangles
A triangle contains five overlapping waves, A through E, each usually a zigzag. Connecting the ends of waves A and C and of waves B and D draws the boundaries. Triangles reflect a balance of forces and usually come with falling volume and volatility. A triangle appears just before the final move of the larger pattern, which is why a wave 4 triangle is sometimes followed by a swift thrust roughly the width of the triangle's widest part.
Combinations
A combination joins two corrective patterns (a double three, labelled W-X-Y) or three (a triple three, W-X-Y-X-Z) with connecting X waves. It is how a sideways correction extends in time. The components usually alternate in form, such as a flat followed by a triangle.
The guideline of alternation ties the families together. If wave 2 was a sharp zigzag, expect wave 4 to be sideways, and the reverse. It tells you what not to expect more than what will happen.
How to Count and Label Elliott Waves
Counting Elliott waves starts with one decision the theory does not make for you: what counts as a swing. Before you label anything, fix the rule that defines a swing high and a swing low, and write it down. A percentage reversal (for example, a swing ends once price closes 1% the other way), a fixed number of bars, or a volatility-based filter all work. Changing the definition mid-count changes the count.
Elliott wave degrees
Each level of the fractal is called a degree. The customary ladder, from largest to smallest, is grand supercycle, supercycle, cycle, primary, intermediate, minor, minute, minuette and subminuette. Degrees are defined by form, not by fixed size or duration, so waves of the same degree can differ a lot in size and length. Analysts mark each degree with its own symbol style (circled numbers, parentheses, plain numbers and so on) so that a wave 3 of one degree is not confused with a wave 3 of another.
A counting routine that avoids hindsight
- Start at a clear extreme. Begin from an obvious major high or low on the timeframe you trade, not from a random bar.
- Mark only confirmed swings. The last leg on the chart is still running, so it is a candidate, not a wave.
- Run the three rules first. Check wave 2 against the start of wave 1, wave 3 against waves 1 and 5, and wave 4 against the end of wave 1 before you think about Fibonacci ratios or personality.
- Check the next degree. Waves 1, 3 and 5 should subdivide into fives on a lower timeframe, and waves 2 and 4 into threes.
- Keep a preferred count and an alternate. Write the price that kills the preferred count. If that price trades, switch to the alternate rather than defending the first count.
How much an Elliott wave count depends on the swing definition
The swing definition is not a detail. In a measurement on ES and NQ daily closes from November 2, 2023 to November 3, 2026, five-swing sequences that passed all three impulse rules were found at three swing tolerances (1%, 1.5% and 2% reversals). Only some of the larger counts survived a change of tolerance:
- On ES, none of the 6 rule-passing counts found at a 2% tolerance reappeared with the same six turning points at 1%, and 1 reappeared at 1.5%.
- On NQ, 1 of the 6 counts found at 2% reappeared at 1%, and 2 reappeared at 1.5%.
The same market, the same rules and the same dates produced mostly different counts. The smaller tolerance picks up extra swings, so a leg that was one wave at 2% becomes several waves at 1%, and the labels shift. When two traders disagree about a count, check whether they are using the same swing definition before arguing about the market.
Related lesson: Market structure, highs and lows
Elliott Wave Terms Worth Knowing
Elliott wave analysis has its own vocabulary, and much of the confusion beginners run into is terminology. These are the terms used most often:
| Elliott wave term | Meaning |
|---|---|
| Motive wave | Any wave that moves with the trend of one larger degree. Impulses and diagonals are motive. |
| Impulse | A five-wave motive pattern that subdivides 5-3-5-3-5 with no overlap between waves 4 and 1. |
| Corrective wave | A wave that moves against the larger trend. Zigzags, flats, triangles and combinations. |
| Degree | The size level of a wave within the fractal, from grand supercycle down to subminuette. |
| Extension | An elongated motive wave with exaggerated subdivisions, usually only one of waves 1, 3 or 5. |
| Truncation | A fifth wave that fails to move beyond the end of wave 3. |
| Diagonal | A wedge-shaped motive pattern of five threes in which wave 4 overlaps wave 1. |
| Throw-over | A brief break of a channel line or diagonal boundary near the end of a fifth wave. |
| Alternation | The guideline that waves 2 and 4 tend to differ in form, one sharp and one sideways. |
| Equality | The guideline that the two non-extended motive waves tend toward equal length. |
| Double three and triple three | Sideways combinations of two or three simple corrections joined by X waves. |
| Invalidation level | The price at which a count breaks one of the three rules and must be relabelled. |
Fibonacci Ratios in Elliott Wave Analysis
Fibonacci ratios are the measuring tape of Elliott wave analysis. Elliott himself concluded that the Fibonacci summation series was the basis of the wave principle, and two relationships do most of the work: corrections tend to retrace a Fibonacci fraction of the prior wave, and motive waves of the same degree tend to relate to each other by Fibonacci multiples.
The commonly quoted guidelines are:
| Elliott wave | Common Fibonacci guideline |
|---|---|
| Wave 2 | Usually retraces no more than 61.8% of wave 1, with 50% and 61.8% common stopping zones |
| Wave 3 | Often 1.618 times wave 1 |
| Wave 4 | Typically retraces less than 38.2% of wave 3 |
| Wave 5 | Equal to wave 1 when wave 3 extends, with 0.618 the next likely relationship |
| Wave C | At least as large as wave A and often 1.618 times wave A |
Elliott Wave International stresses one condition that many traders skip: Fibonacci ratios only mean something on top of a valid wave count. Measuring ratios between moves that are not related waves is what makes the approach look worse than its supporters say it is.
What ES and NQ swings actually retraced
A Fibonacci retracement target assumes that pullbacks cluster around specific fractions. In ES and NQ daily closes from November 2, 2023 to November 3, 2026, with swings defined by a 1% closing reversal, every counter-swing was measured against the swing before it, with no wave label applied:
| Counter-swing retracement of the prior swing | ES share (122 swings) | NQ share (162 swings) |
|---|---|---|
| Under 38.2% | 12.30% | 14.20% |
| 38.2% to under 61.8% | 19.67% | 14.20% |
| 61.8% to under 78.6% | 6.56% | 10.49% |
| 78.6% to under 100% | 9.84% | 11.11% |
| 100% or more | 51.64% | 50.00% |
| Median retracement | 103.63% | 99.17% |
In this guide's measurement, about half of all counter-swings gave back the entire prior swing or more. The classic 38.2% to 61.8% zone held roughly one counter-swing in five on ES and one in seven on NQ. A pullback that fails to stop in the golden zone is the normal case, not the exception.
Fibonacci ratios inside rule-passing counts
In ES and NQ daily closes from November 2, 2023 to November 3, 2026, the five-swing sequences that passed all three impulse rules (13 on each contract with a 1% closing-reversal swing definition) matched the textbook ratios only loosely:
| Measure in rule-passing Elliott counts | Guideline | ES (13 counts) | NQ (13 counts) |
|---|---|---|---|
| Median wave 2 retracement of wave 1 | 50% to 61.8% | 53.99% | 51.10% |
| Wave 2 inside 50% to 61.8% | Common zone | 23.08% | 23.08% |
| Median wave 3 divided by wave 1 | 1.618 | 2.02 | 1.83 |
| Wave 3 inside 1.618 to 2.618 times wave 1 | Expected zone | 61.54% | 30.77% |
| Median wave 4 retracement of wave 3 | Under 38.2% | 41.93% | 32.23% |
| Wave 4 under 38.2% of wave 3 | Usual case | 38.46% | 69.23% |
| Median wave 5 divided by wave 1 | About 1.0 | 0.90 | 0.71 |
The medians sit near the guidelines, which is why the guidelines feel right when you look at a chart. The spread around them is wide. Only 3 of 13 wave 2s on each contract stopped inside the 50% to 61.8% zone. With samples of 13, treat these as a description of this period, not as stable probabilities.
Related lesson: Fibonacci retracements and extensions
How Often the Elliott Wave Rules Hold on ES and NQ
Most Elliott wave explanations state the rules but never say how often a market actually produces a sequence that passes them. This measurement does that on two futures contracts.
Method. Daily closes for the continuous front-month ES and NQ futures (Yahoo Finance series, not back-adjusted for contract rolls) over 756 completed sessions from November 2, 2023 to November 3, 2026. Swings were defined by a closing zigzag: a swing high or low is confirmed only once a later close reverses by the tolerance (1%, 1.5% or 2%). Every run of five consecutive confirmed swings was treated as a candidate impulse, up or down, and the rules were applied in order. The test checks price rules only. It does not check whether each wave subdivides correctly on a lower timeframe, which a full Elliott analysis would.
| Rule applied in order | ES 1% | ES 1.5% | ES 2% | NQ 1% | NQ 1.5% | NQ 2% |
|---|---|---|---|---|---|---|
| Five-swing sequences found | 119 | 73 | 49 | 159 | 111 | 83 |
| Wave 2 stays inside the start of wave 1 | 57 | 39 | 25 | 79 | 56 | 44 |
| Wave 3 not the shortest of 1, 3 and 5 | 30 | 22 | 16 | 43 | 33 | 21 |
| Wave 3 ends beyond wave 1 | 26 | 19 | 13 | 36 | 28 | 19 |
| Wave 4 stays out of wave 1 territory | 13 | 7 | 6 | 13 | 9 | 6 |
| Share passing all rules | 10.92% | 9.59% | 12.24% | 8.18% | 8.11% | 7.23% |
What the Elliott wave rule funnel shows
Three findings stand out in this guide's ES and NQ measurement:
- A legal count is the exception. Between 7.23% and 12.24% of five-swing sequences passed every rule. At a 1% tolerance that is 13 counts on each contract, or about 4.33 a year.
- The wave 2 rule cuts the most sequences. Roughly half of all candidates failed at the first step, which matches the retracement data: about half of all counter-swings went beyond the start of the prior swing.
- The overlap rule is not a minor detail. Of the ES sequences that cleared the wave 2 and wave 3 tests at 1%, 13 of 26 then failed because wave 4 overlapped wave 1. On NQ it was 23 of 36, or 63.89%.
The share passing stays in a narrow band across tolerances even though the number of candidates drops sharply. The rules are not tuned to one size of swing. They simply reject most sequences at every size.
For a futures trader the takeaway is practical. If you find a clean five-wave count on most charts you open, you are probably bending the rules or the swing definition. Most of the time the honest answer is that no impulse is in view, and doing nothing with the count is a valid decision.
A Worked Elliott Wave Count on Nasdaq Futures
The most recent five-swing sequence to pass all three Elliott wave rules on NQ at a 1% closing tolerance was a decline in July 2026. Here it is leg by leg, using daily closes:
| NQ wave | From close | To close | Points | Rule check |
|---|---|---|---|---|
| Wave 1 down | 30,032.25 on July 10 | 29,475.75 on July 13 | 556.50 | Starting leg |
| Wave 2 up | 29,475.75 | 29,790.25 on July 14 | 314.50 | 56.51% of wave 1, below the 30,032.25 start |
| Wave 3 down | 29,790.25 | 28,773.25 on July 17 | 1,017.00 | 1.83 times wave 1, not the shortest |
| Wave 4 up | 28,773.25 | 29,316.00 on July 21 | 542.75 | Ended 159.75 points below wave 1's end at 29,475.75 |
| Wave 5 down | 29,316.00 | 27,342.00 on July 29 | 1,974.00 | 3.55 times wave 1, the extended wave |
The whole decline covered 2,690.25 points, or 8.96%, in 13 sessions.
Confirming the NQ Elliott wave pivots in real time
The July 2026 NQ count reads cleanly in hindsight. In real time it did not. With a 1% closing rule, the wave 2 high at 29,790.25 was only confirmed on July 16, when NQ closed at 29,225.75. By then price had already fallen 564.50 points from the wave 2 high, more than the whole of wave 1. A trader waiting for confirmation of wave 2 before shorting wave 3 was entering more than halfway through a 1,017.00-point wave 3 that the count only identified afterward.
The intraday data shows how thin the margin can be. The July 10 session high was 30,077.75. On July 15, the day after the wave 2 close, NQ traded up to 30,062.50 intraday, just 15.25 points short of breaking the wave 2 rule on a high-low basis. One more push and the count would have been invalid on an intraday chart while still valid on closes.
What happened after wave 5
Wave 5 was the extended wave here, at 1,974.00 points against 1,017.00 for wave 3. That is legal, since wave 3 only has to avoid being the shortest. The rebound from the July 29 low then ran to 29,863.50 by the August 4 close, a rise of 2,521.50 points that recovered 93.73% of the entire five-wave decline in four sessions. A count that ends at wave 5 tells you a correction is due. It does not tell you the correction will be shallow.
Elliott Wave Price Targets and Projections
Elliott wave price targets come from applying ratio guidelines to waves that are already complete. The standard projections, using the July 2026 NQ decline on daily closes as the worked example, show both how they are built and how far real price can stray from them.
| Projection method | Calculation on the NQ count | Target | Actual close |
|---|---|---|---|
| Wave 3 equals 1.618 times wave 1 | 29,790.25 minus 1.618 times 556.50 (900.42 points) | 28,889.83 | 28,773.25, beyond the target by 116.58 points |
| Wave 4 retraces 38.2% of wave 3 | 28,773.25 plus 38.2% of 1,017.00 (388.49 points) | 29,161.74 | 29,316.00, a 53.37% retracement |
| Wave 4 retraces 50% of wave 3 | 28,773.25 plus 508.50 points | 29,281.75 | 29,316.00 |
| Wave 5 equals wave 1 | 29,316.00 minus 556.50 | 28,759.50 | 27,342.00 |
| Wave 5 equals 0.618 times waves 1 to 3 | 29,316.00 minus 0.618 times 1,259.00 (778.06 points) | 28,537.94 | 27,342.00 |
The wave 3 projection was close. The wave 4 projections were reasonable as a zone, with the 50% level within 34.25 points of the actual turn. The wave 5 projections missed by more than 1,000 points, because wave 5 extended instead of resembling wave 1.
That last miss is the most important lesson about Elliott wave targets. The equality guideline for wave 5 assumes wave 3 was the extended wave. When the extension lands in wave 5 instead, every wave 5 target built on wave 1 is too small, and you only learn which case you are in as wave 5 unfolds.
Channel and wave C projection tools
- Channels. After wave 3 ends, a line connecting the ends of waves 1 and 3, with a parallel through wave 2, gives an estimated boundary for wave 4. After wave 4, a line through the ends of waves 2 and 4, with a parallel through wave 3, estimates where wave 5 may end.
- Wave C targets. Wave C is usually at least equal to wave A and often 1.618 times wave A, measured from the end of wave B.
- Triangle thrusts. After a wave 4 triangle, wave 5 often travels about the width of the triangle's widest part.
- Double zigzags. The second zigzag is often measured against the first, since a double zigzag usually forms when the first one falls short of a normal target.
Use targets as zones where you reassess the position, not as orders you expect to fill. A target that trades is a reason to tighten risk or take partial profits. A target that does not trade is information. It may mean the extension is landing in a different wave than you expected.
Is Elliott Wave Theory Reliable
Elliott Wave Theory is reliable as a description of how trends often look and much weaker as a forecasting tool, and the published evidence supports that split.
Research testing Elliott wave Fibonacci ratios
The most direct test is "Magic numbers in the Dow" by Roy Batchelor and Richard Ramyar of Cass Business School, published in 2006. They took daily Dow Jones Industrial Average data from 1914 to 2002 and found turning points with a rule-based heuristic (a 21 trading day window either side of each turning point, a minimum cycle of 42 trading days and a minimum phase of 10 trading days), which produced 430 turning points. They then measured retracement and projection ratios in price and time and compared how often they landed near Fibonacci and round-fraction values against 2,000 bootstrap replications of the series.
Only 15 of 144 ratio tests exceeded the 0.90 percentile, against 14.4 expected by chance, with no consistent pattern in which ratios were significant. Their conclusion was that there is no significant difference between how often those ratios appear in the Dow and how often they would appear at random.
Main criticisms of Elliott wave analysis
- Subjectivity. Benoit Mandelbrot, whose fractal work is often cited in support of wave patterns, called wave prediction a very uncertain business in which the chartist's subjective judgment matters more than any replicable verdict of the numbers.
- Unfalsifiable flexibility. Technical analyst David Aronson argued that the theory as popularly practised is a story rather than a legitimate theory, because loose rules and an unlimited number of nested waves let an analyst fit any stretch of market history after the fact.
- Dated patterns. Glenn Neely, author of Mastering Elliott Wave, argued that markets have changed since Elliott's time and that strict orthodox application skews forecasting accuracy.
What Elliott Wave Theory does well
- It forces you to define invalidation. The three rules give a specific price where a reading is wrong, which is more than many chart methods offer.
- It organizes market structure. Thinking in impulses and corrections helps you separate a pullback inside a trend from a possible change in trend.
- It shapes expectations about the next leg. A completed five suggests a three against it, and an ending diagonal suggests a sharp reversal, even if the size is uncertain.
A measurement on three years of ES and NQ daily closes points the same way. The three rules rejected about nine in ten five-swing sequences, the ratios hold only as loose central tendencies, and a count changes when the swing definition changes. Use the theory to structure risk, not to predict the precise turn.
Trading With an Elliott Wave Count
Trading with an Elliott wave count means turning a label into an entry area, a stop at the rule-based invalidation level, and a position size that survives being wrong. The label itself is not a signal.
Where Elliott wave traders look for entries
- The wave 3 setup. After a five-wave first leg and a three-wave pullback that holds above the start of wave 1, traders look to join the trend for wave 3. The stop goes beyond the start of wave 1, because a move through it breaks rule one.
- The wave 5 setup. After wave 4 completes without entering wave 1's territory, traders look to join the final push. The stop goes beyond the end of wave 1, because a move through it breaks rule three. Wave 5 targets are smaller and less reliable, and wave 5 can truncate.
- The post-five correction. After a completed five, some traders look for the A-B-C correction against it, often entering on wave B with a stop beyond the wave 5 extreme.
How often a valid wave 2 led to a wave 3
The wave 3 setup can be measured. In ES and NQ daily closes from November 2, 2023 to November 3, 2026, with swings defined by a 1% closing reversal, every pair of swings where the pullback held inside the start of the first swing was treated as a possible wave 1 and wave 2, and the next swing was checked:
- On ES, 58 such setups appeared. The next swing went beyond the end of the first swing 68.97% of the time and reached 1.618 times its length 18.97% of the time.
- On NQ, 80 setups appeared. The next swing went beyond the first swing's end 61.25% of the time and reached 1.618 times its length 13.75% of the time.
Two things follow. A held wave 2 led to a higher high (or lower low) more often than not, which is the part of the theory that holds up. But the textbook 1.618 extension was reached less than one time in five, so a plan that only works if wave 3 hits 1.618 times wave 1 is a plan built on the minority outcome. These counts ignore entry timing, fills, slippage and costs, so they describe structure, not a tradable result.
Sizing from the invalidation level
Position size comes from the distance between entry and the invalidation level, not from the target. The arithmetic is the same as any stop-based trade: risk in points, times the dollar value per point, times the number of contracts, must fit inside the amount you are willing to lose on the idea. If the invalidation level is too far away for your risk limit, the honest answer is a smaller size or no trade, not a tighter stop placed where the count is still valid.
The July 2026 NQ decline on daily closes shows why. Its wave 2 high at 29,790.25 was confirmed only after price had already fallen 564.50 points from the wave 2 high. The rule-based stop sat above the 30,032.25 start of wave 1, 806.50 points from that confirmation close. On a daily count, that is a wide stop, and it is the stop the theory actually gives you.
When an Elliott wave trade plan fails
- The count changes mid-trade. Decide in advance which price makes you switch to the alternate count.
- The extension lands somewhere else. A wave 5 that extends will run past every target built on wave 1.
- Confirmation arrives late. By the time a pivot is confirmed, much of the next wave may already be gone. Chasing that move is a different trade with a worse stop.
Related lesson: Position sizing
Elliott Wave Tools and Charting Platforms
Elliott wave analysis can be done by hand with a few drawing tools, or with software that proposes counts for you. Both have a place, and both need the same rule check.
Manual Elliott wave tools
TradingView offers five Elliott wave drawing tools on its Patterns toolbar: an impulse wave tool (1-2-3-4-5), a correction wave tool (A-B-C), a triangle wave tool (A-B-C-D-E), a double combo tool (W-X-Y) and a triple combo tool (W-X-Y-X-Z). Each lets you set the wave degree so the labels follow the standard notation. Fibonacci retracement and extension tools, available on most charting platforms, handle the ratio measurements.
Automatic Elliott wave indicators
TradingView's built-in Elliott wave indicator scans the last 600 bars, splits them into main waves and sub-waves, ties wave points to pivots, and checks impulse and zigzag rules before drawing the patterns that capture the largest moves. Its degree markings show nesting level only, not Elliott's historical degrees. Automatic counts are useful for consistency because they apply the same swing logic every time. They are also limited by that logic, because a different pivot setting gives a different count.
Testing an Elliott wave approach
A wave method can be tested like any other rule set if you write it down precisely: the swing definition, the rules checked, the entry, the invalidation stop, and the exit. Chart replay tools let you step through historical bars without seeing the future, which is the closest practice gets to real-time counting. Record the count you made before each move, not after.
On our accounts, Elliott wave work happens on the platforms we support. TradingView connects through the Tradovate route, and WealthCharts includes Fibonacci retracement and extension drawing tools plus Chart Replay for practising counts on historical data. Our funded accounts are simulated, and every position must be closed by 4:45 PM ET, so a multi-day count like the NQ example works as context for intraday trades rather than as a position you can hold through the swing.
Related lesson: Backtesting a trading strategy
Common Elliott Wave Mistakes and a Practice Routine
Most Elliott wave mistakes come from the method's flexibility. Because a count can almost always be revised, the discipline has to come from you.
Mistakes that break Elliott wave counts
- Counting before defining a swing. Without a fixed swing rule, the count bends to fit the chart.
- Treating guidelines as rules. A wave 4 that retraces 50% of wave 3 is unusual by the guideline, not invalid. A wave 4 that enters wave 1's territory is invalid.
- Labelling the running leg. The last swing on the chart is not finished. A count that depends on it is a forecast, not a count.
- Defending a broken count. Once the invalidation level trades, the count is wrong. Relabelling to keep the same trade is how a small loss becomes a large one.
- Calling exotic patterns early. Elliott Wave International warns that labelling a running flat prematurely will usually be wrong, and that analysts often label triangles complete too early because triangles take time.
- Mixing timeframes without degrees. A wave 3 on a 5-minute chart and a wave 3 on a daily chart are different waves. Use degree labels or keep separate notes per timeframe.
A weekly Elliott wave practice routine
- Pick one market and one timeframe. For example, ES on a daily chart, with a written 1% closing swing rule.
- Label in replay. Step through bars one at a time and label only confirmed swings. Write the preferred count, the alternate count and the invalidation price in a journal before advancing.
- Score the week. Count how many invalidation levels traded, how often the preferred count held, and how far each target was from the actual turn.
- Review the misses. Note whether each miss came from a rule being broken, a guideline failing, or the swing definition picking up a different leg.
- Change one thing at a time. If you change the swing rule, rerun the same period so you can see what the change did.
Over a few weeks, the journal shows whether your counts help your decisions or only explain them afterward. A count that only works in hindsight is a story. A count written down before the move, with its invalidation price, is something you can actually trade around.
Related lesson: How to keep a trading journal
Elliott Wave Theory FAQ
What is Elliott Wave Theory in simple terms?
It is the idea that markets trend in five waves and correct in three, and that the same pattern repeats at every scale. Waves 1, 3 and 5 move with the trend, waves 2 and 4 pull back, and waves A, B and C correct the whole move.
What are the three rules of Elliott Wave Theory?
Wave 2 never retraces more than 100% of wave 1. Wave 3 is never the shortest of waves 1, 3 and 5. Wave 4 never enters the price territory of wave 1.
How accurate is Elliott Wave Theory?
It describes trend structure better than it forecasts exact turns. A 2006 study by Roy Batchelor and Richard Ramyar of Dow data from 1914 to 2002 found Fibonacci ratios appeared no more often than chance. Wave counts also vary between analysts and with the swing definition used.
What is the best timeframe for Elliott wave analysis?
There is no single best timeframe, because the pattern is meant to appear at every degree. Pick the timeframe that matches how long you hold trades, fix a swing definition for it, and use a higher timeframe only for context.
Does Elliott Wave Theory work on futures?
The rules can be applied to futures like any price series, and a three-year test on ES and NQ daily closes found about one five-swing sequence in ten passing all three rules. Elliott Wave International notes that futures can briefly overlap where cash indexes would not, so check the underlying index when a rule breaks by a few ticks.
How many waves are in a complete Elliott wave cycle?
One basic cycle has eight waves, five motive and three corrective. Counting every subdivision three levels down, a completed motive pattern has 89 waves and a completed corrective pattern has 55.
Elliott wave analysis is an interpretive charting method, and the ES and NQ figures in this article are historical measurements and illustrative arithmetic, not predictions of future results. Futures trading uses leverage and can lose more than you expect on a single trade, funded and evaluation accounts are simulated trading accounts, and nothing here is investment advice.


