




TL;DR: How to keep a trading journal comes down to writing the plan before the trade and the result after it, then reading it weekly. Record results in R, not dollars, so every row compares. Add MAE and MFE, the worst and best point of each trade. Change a rule only after 100 or more trades per setup.
Your memory is a bad trading journal. It keeps the clean winners and the painful losers, and it quietly drops the dull middle where most of the useful information sits.
Plenty of traders start a written journal and stop within a few weeks. Usually it is not laziness. The journal was built as a scoreboard, so every review felt like a verdict, and nothing in the rows pointed to a change the trader could actually make.
This guide shows how to keep a journal that avoids that trap: what to record before and after each trade, a template to copy, how to review it, and how much data a conclusion needs before it deserves a rule change.
Why a Trading Journal Is Worth Keeping
A trading journal earns its place in three ways: accountability, pattern recognition and progress tracking. Each one only works if the journal records decisions, not just money.
Accountability comes from writing the plan down before the trade. If the stop, the target and the reason exist on the page before the entry, the review can compare what you meant to do with what you did. Without that line, every trade gets judged by its outcome, and outcome is a noisy grade. A good trade can lose. A sloppy one can pay.
Pattern recognition needs the same fields recorded the same way on every row. A trader may feel that Monday mornings go badly or that one setup is the money-maker. A journal turns that feeling into a count you can check, and sometimes the count disagrees with the feeling.
Progress tracking is the subtle one. Profit swings with the market, so a journal that only tracks profit can show a bad month for a trader who executed perfectly. Process numbers, such as the share of trades that followed the written rule, move only when you do.
The honest limit is that a journal does not improve anything by existing. It improves trading when it gets read on a schedule and when the rows contain something you can act on.
Related lesson: The planning document these rows are meant to test
How to Keep a Trading Journal in Ten Minutes a Day
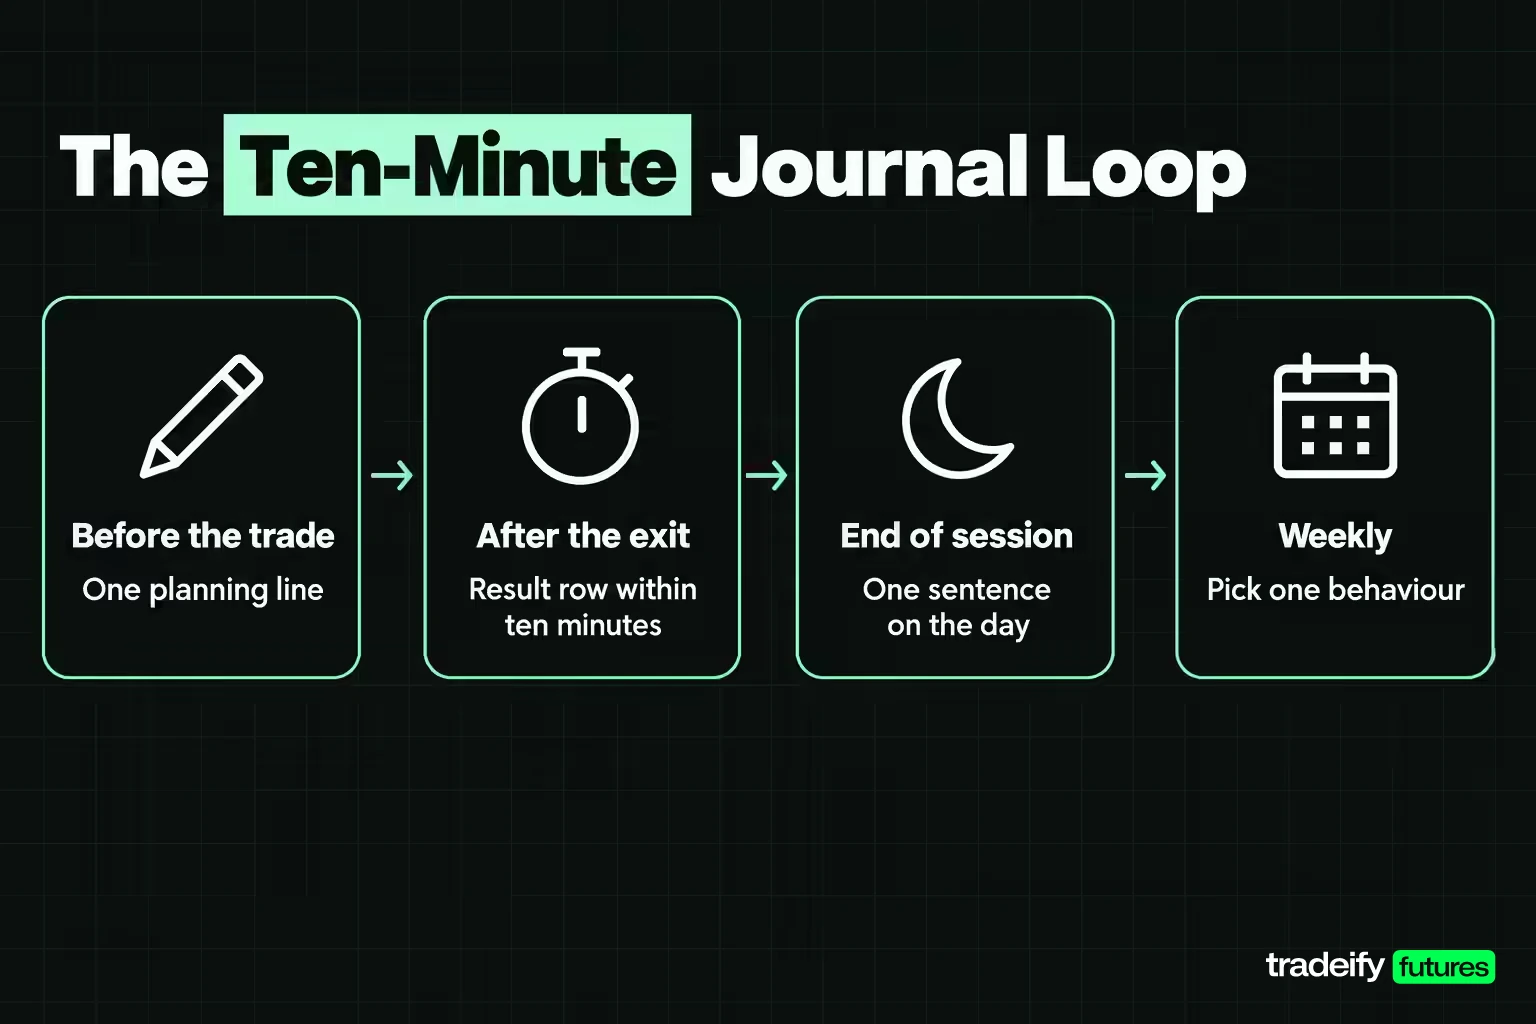
Keeping a trading journal works best as a short, fixed loop rather than an evening essay. The daily cost should sit around ten minutes, because a process that takes longer gets skipped on exactly the days you most need it.
- Before each trade, write one planning line: setup, entry, stop, target, size and how you feel.
- Within ten minutes of the exit, fill in the result row while the details are fresh.
- At the end of the session, add one sentence on the day: what went to plan and what did not.
- Once a week, read the rows and pick one behaviour to work on next week.
The ten-minute deadline on the result row matters most. You will remember the exit price for days. By the next morning you will have forgotten that the trade sat half a stop underwater at mid-session, and that number is often the most reusable fact of the day.
Record every trade, including the small scratches and the ones you are embarrassed about. A journal with gaps reads like a highlight reel, and a highlight reel cannot tell you what is going wrong.
What to Write in Your Journal Before a Trade
The pre-trade entry is the part of a trading journal most traders skip, and it is the part that makes honest review possible. Written before the order goes in, these fields describe the plan rather than a story told after the result is known.
- Setup name. Use a short, fixed list of names so the review can group trades. Five names you use consistently beat thirty you invent on the fly.
- Reason in one sentence. What you see and why it qualifies under your plan. If you cannot write the sentence, that is useful information on its own.
- Planned entry, stop and target. Prices, not intentions. The stop defines your risk unit for the trade.
- Size and risk in currency. Contracts and the dollar loss if the stop fills.
- Market context. Session, scheduled news, and whether the market is trending or ranging by your own definition.
- Emotional state, scored 1 to 5. Calm, rushed, frustrated, bored, overconfident. One number plus one word is enough.
That last field feels soft. It is often the one that finds the leak. A trader who scores "frustrated, 4" before a trade that came right after a loss is writing down a revenge trade in real time, and the review can later count how those trades did.
A useful test: if a trade has no pre-trade line, tag it "unplanned". The unplanned tag tends to become the most informative column in the journal.
Trading Journal Fields to Record After the Exit
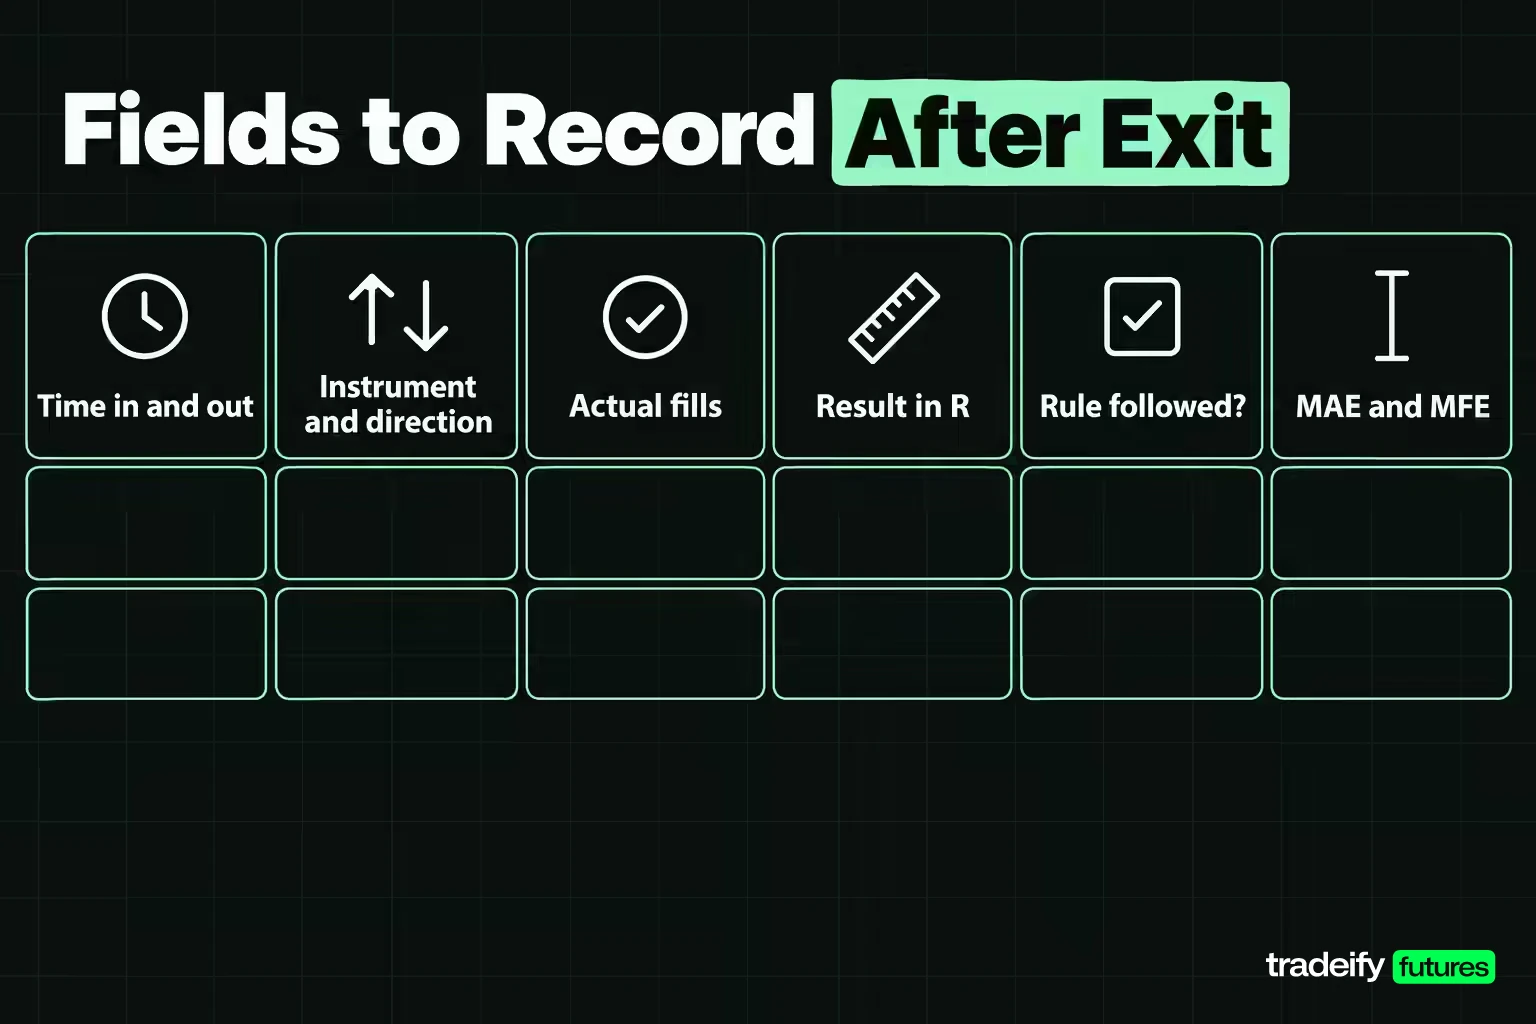
The post-trade fields of a trading journal capture what actually happened, measured in a way that lets different trades be compared.
- Date, time in and time out. Lets you check performance by session and hour.
- Instrument and direction. Long or short, and the contract month if it matters to you.
- Actual entry and exit fills. Compare them with the planned prices to measure slippage and hesitation.
- Result in R. Divide the profit or loss by the planned risk. On an E-mini S&P 500 contract, worth $50 per index point, an 18-point stop is a $900 risk unit, so a $450 loss is -0.5R.
- Result in currency. Keep it, but do not make it the main column.
- Rule followed, yes or no. The single most important process column. A no needs one line saying which rule.
- MAE, maximum adverse excursion. How far the trade went against you before it closed, in R.
- MFE, maximum favourable excursion. How far it went in your favour before it closed, in R.
- Chart screenshot. Marked with the planned levels, saved with the trade's date and number.
- One-line lesson. Optional on ordinary trades, required on any trade where the rule column says no.
Recording in R is what keeps the journal readable over time. A $300 loss means something different on one Micro E-mini at $5 a point than on one E-mini, and R removes that problem: -1R is a full planned loss at any size.
MAE and MFE as journal columns
MAE and MFE are the two columns almost nobody keeps, and they answer a question the result column cannot: what was the stop and target actually doing? A winner that went 0.9R underwater first says something about your stop that its final profit hides. A loser that was 1.5R ahead before it reversed says something about your target or your exit plan.
Most platforms show the high and low while the trade was open, so the two numbers take seconds to fill in at the exit.
A Trading Journal Template to Copy
This trading journal template fits one trade per row in a spreadsheet, split into the columns you fill before the entry and the columns you fill after the exit. The example values are illustrative, using round E-mini S&P 500 prices ($50 per index point) and an 18-point stop.
Pre-trade columns of the journal template
| Pre-trade column | What to enter | Example |
|---|---|---|
| Trade number | Running count | 47 |
| Date and session | Day plus session window | Tuesday, morning |
| Setup | Name from your fixed list | Range breakout |
| Pre-trade reason | One sentence, written before entry | Close above the range high after news |
| Emotion score | 1 to 5 plus one word | 2, calm |
| Planned entry | Price | 5,000.00 |
| Planned stop | Price | 4,982.00 |
| Planned target | Price | 5,036.00 |
| Size | Contracts | 1 |
| Risk unit | Stop distance in currency | $900 |
Post-trade columns of the journal template
| Post-trade column | What to enter | Example |
|---|---|---|
| Actual entry | Fill price | 5,000.50 |
| Actual exit | Fill price | 5,030.00 |
| Result in R | Profit divided by risk unit | 1.64R |
| Rule followed | Yes or no, plus which rule | Yes |
| MAE in R | Worst point against you | -0.40R |
| MFE in R | Best point in your favour | 1.80R |
| Lesson | One line | Exit early at 5,030.00 left 0.33R short of target |
To set the template up as a spreadsheet, make one tab for trade rows, one tab for daily notes and one tab for the weekly review. Use dropdown lists for the setup name, the emotion word and the rule column, so the review can count them without cleaning typos.
The template stays short on purpose. Add a column only when your weekly review keeps asking a question the current columns cannot answer.
What a Trading Journal Path Column Reveals
Path columns in a trading journal record MAE (maximum adverse excursion, the worst point a trade reached against you) and MFE (maximum favourable excursion, its best point in your favour), both in R. Their value is easier to judge across hundreds of trades, so this guide's own illustrative study applies one fixed rule to E-mini S&P 500 futures and records MAE and MFE for every trade, exactly as a journal would.
The E-mini breakout rule behind the journal study
The data is front-month continuous E-mini S&P 500 futures daily bars, 5,067 sessions from 18 September 2006 to 4 November 2026. The rule is an example, not a recommendation:
- Signal when a session closes above the highest high of the prior 20 sessions.
- Buy one contract at the next session's open.
- Stop at 1.0 times the 14-session average true range (Wilder method), measured at the signal bar. That distance is 1R.
- Target at 2.0 times the same range, which is 2R.
- Exit at the close of the 20th session if neither level is hit.
- Charge 0.5 index points per round turn for costs.
Held as written, the rule produced 592 trades, a 40.2% win rate and an average of 0.13R per trade, with a 95% interval of 0.01R to 0.25R. The exits were 345 stops, 203 targets, 40 time exits and 4 sessions that opened through the stop.
What the MAE and MFE columns showed
In the E-mini journal study, the result column says the 20-session breakout rule wins about four times in ten (40.2% of 592 trades). The MAE and MFE columns tell a different story about the same trades.
| Path finding | Count | Share |
|---|---|---|
| Winners at least 0.5R underwater first | 99 of 238 | 41.6% |
| Winners at least 0.75R underwater first | 41 of 238 | 17.2% |
| Losers at least 0.5R ahead first | 172 of 354 | 48.6% |
| Losers a full 1R ahead first | 79 of 354 | 22.3% |
| Rows where the path contradicted the result | 271 of 592 | 45.8% |
Fifteen winners went past 0.9R underwater, and the deepest reached -0.995R, a hair from the stop. On the other side, 25 losers were 1.5R ahead at some point before they lost.
That 45.8% is the argument for keeping MAE and MFE in a journal. On almost half the rows, the final result described the trade's end and missed what happened along the way. A journal with only a result column would have had no way to see that.
Two worked journal rows from the study
A winner that nearly died. The signal came on 21 August 2014, with entry at 1,989.75 on 22 August. The risk unit was 17.84 points, $891.82 on one E-mini, with the stop at 1,971.91 and the target at 2,025.42. The lowest print while open was 1,972.00, just 0.09 points above the stop, an MAE of -0.995R. The best print was 2,022.50, an MFE of 1.84R. The trade never touched the target and closed on the time cap on 19 September 2014 at 2,019.25, for +1.63R, $1,450.00 after costs.
A loser that was nearly a full target up. The signal came on 23 January 2018, with entry at 2,837.00 on 24 January. The risk unit was 20.93 points, $1,046.34 on one E-mini, with the stop at 2,816.07 and the target at 2,878.85. The trade ran to 2,878.50, an MFE of 1.98R and $2,075.00 of open profit, 0.35 points short of the target. Then it reversed and stopped out on 31 January 2018, six sessions in, for -1.02R, -$1,071.34 after costs.
Neither row is visible from a profit column. The first raises a fair question about stop placement. The second raises a question about whether a target that sits just past a round number will fill. Both questions are actionable on the next trade.
Turning Trading Journal Data Into Rule Changes
Turning trading journal data into a rule change is where most journals either pay off or quietly mislead. The risk is a fix that feels obvious from the rows and costs more than it saves. This section uses the same illustrative E-mini S&P 500 study as the path-column section (592 trades of a 20-session breakout rule with a 1.0-range stop and 2.0-range target, 2006 to 2026) to show how to test a change before adopting it.
Why a tighter stop is not the obvious journal fix
In the E-mini breakout study, 41.6% of winning trades went at least half a stop (0.5R) underwater before they worked, and the natural journal reaction is to tighten the stop. The E-mini study tested that on the same 592 signals, changing only the stop distance and keeping the target at 2.0 times the range. Results are in the 1.0-range unit so the rows compare.
| Stop distance | Win rate | Average per trade | Worst trade |
|---|---|---|---|
| 0.5 x range | 23.5% | 0.05R | -1.25R |
| 0.75 x range | 33.3% | 0.11R | -1.25R |
| 1.0 x range | 40.2% | 0.13R | -1.25R |
| 1.25 x range | 44.9% | 0.12R | -1.61R |
| 1.5 x range | 48.6% | 0.11R | -2.28R |
Moving from a 0.75 to a 1.5 range stop raised the win rate by 15.4 points, and the average barely moved. The paired change across the same signals was -0.001R, with an interval of -0.09R to 0.09R. Fifteen points of win rate, and no measurable change in what the rule earned. The trades felt better. The account did not.
The MAE column explains why. The 41 winners that went at least 0.75R underwater produced 66.72R, 86.6% of the rule's entire net result, at an average of 1.63R each. A stop tight enough to avoid that drawdown removes the very trades that paid for the rest.
That is the real job of journal data in rule-making: it shows the cost of a change in both directions at once, instead of only the direction that felt bad.
How many journal entries a comparison needs
A trading journal needs more trades than most traders expect before an average means anything. In the 592-trade E-mini breakout study, which averaged 0.13R per trade, results varied by about 1.42R from trade to trade (one standard deviation), and the uncertainty around an average shrinks only with the square root of the trade count.
| Trades in the journal | 95% margin on the average |
|---|---|
| 20 | ±0.62R |
| 50 | ±0.39R |
| 100 | ±0.28R |
| 200 | ±0.20R |
| 500 | ±0.12R |
At 50 trades, the margin of ±0.39R is 3 times the rule's whole 0.13R edge. Separating two setups that differ by 0.2R per trade takes about 794 trades in each group at the usual research standard (80% power, two-sided 95% test). A 0.1R difference takes about 3,174 per group.
Your own numbers will differ, so use your journal's standard deviation in place of 1.42R. The direction of the lesson will not change.
Luck in the best-performing journal tag
Split any trading journal by enough tags (setup, session, weekday) and the top tag will look impressive even if none of the tags matters. In a journal where the true edge is zero, with 50 trades per tag and the same 1.42R spread, the best tag is expected to average 0.23R out of 5 tags, 0.31R out of 10 and 0.38R out of 20. Those numbers are pure luck, and each one is larger than the real 0.13R edge of the E-mini breakout study rule.
So treat a tag report as a list of questions to test, not a list of findings. A rule change built from journal data should follow three steps:
- Write the proposed change and the trade count behind it.
- Re-run the change on past rows, if the journal has the fields, and check both what it saves and what it costs.
- Change one rule at a time, then log at least the next 50 to 100 trades before judging it.
Related lesson: How much a sample has to say before a backtest means anything
Post-Trade Review of Each Journal Entry
A post-trade review is the short reflection you add to a journal row on the same day, and its main job is to grade the decision separately from the outcome.
Sort every finished trade into one of four boxes:
| Outcome box | Rule followed | Result | What it means |
|---|---|---|---|
| Good trade, good result | Yes | Win | The plan worked as designed |
| Good trade, bad result | Yes | Loss | Normal cost of the plan; change nothing |
| Bad trade, good result | No | Win | The most dangerous box; luck rewarded a break |
| Bad trade, bad result | No | Loss | A break that cost money; find the trigger |
The third box deserves the most attention. A rule break that paid teaches the wrong lesson, and it will be repeated unless the journal names it.
Then answer three questions in a line or two each. Did the trade match the pre-trade plan? Where did execution differ, at entry, at the exit or in size? What would you do the same next time?
Write the review before you look at what price did after your exit. Hindsight turns every exit into a mistake. A journal full of "should have held" lines teaches nothing you can repeat on the next trade.
Weekly and Monthly Trading Journal Reviews
A weekly and monthly trading journal review turns single trade rows into decisions. Without a fixed schedule, rows pile up unread, which is the most common way journals die.
Weekly review, about 30 minutes.
- Count trades and the share that followed the rule.
- List every "no" in the rule column and the trigger behind it.
- Check the emotion scores on losing trades and unplanned trades.
- Pick one behaviour to work on next week, and only one.
Monthly review, about an hour.
- Average result in R by setup, with the trade count written beside each average.
- MAE and MFE by setup: are winners routinely deep underwater, or losers well ahead?
- Results by session or time of day, again with counts.
- Any rule change proposed, with the trade count and test behind it.
How many trades before a trading journal is useful
A trading journal is useful for behaviour from the first week. The rule-followed column and the emotion scores show patterns quickly, because they track things you control.
It becomes useful for strategy questions much later. In this guide's E-mini breakout study, where results varied by about 1.42R per trade, the 95% margin on an average was ±0.62R with 20 trades and ±0.28R with 100 trades. Treat any setup comparison below 100 trades as a reason to keep collecting, not a reason to change a rule.
Related lesson: The review that turns a week of rows into one change
Using a Trading Journal to Catch Emotional Trades
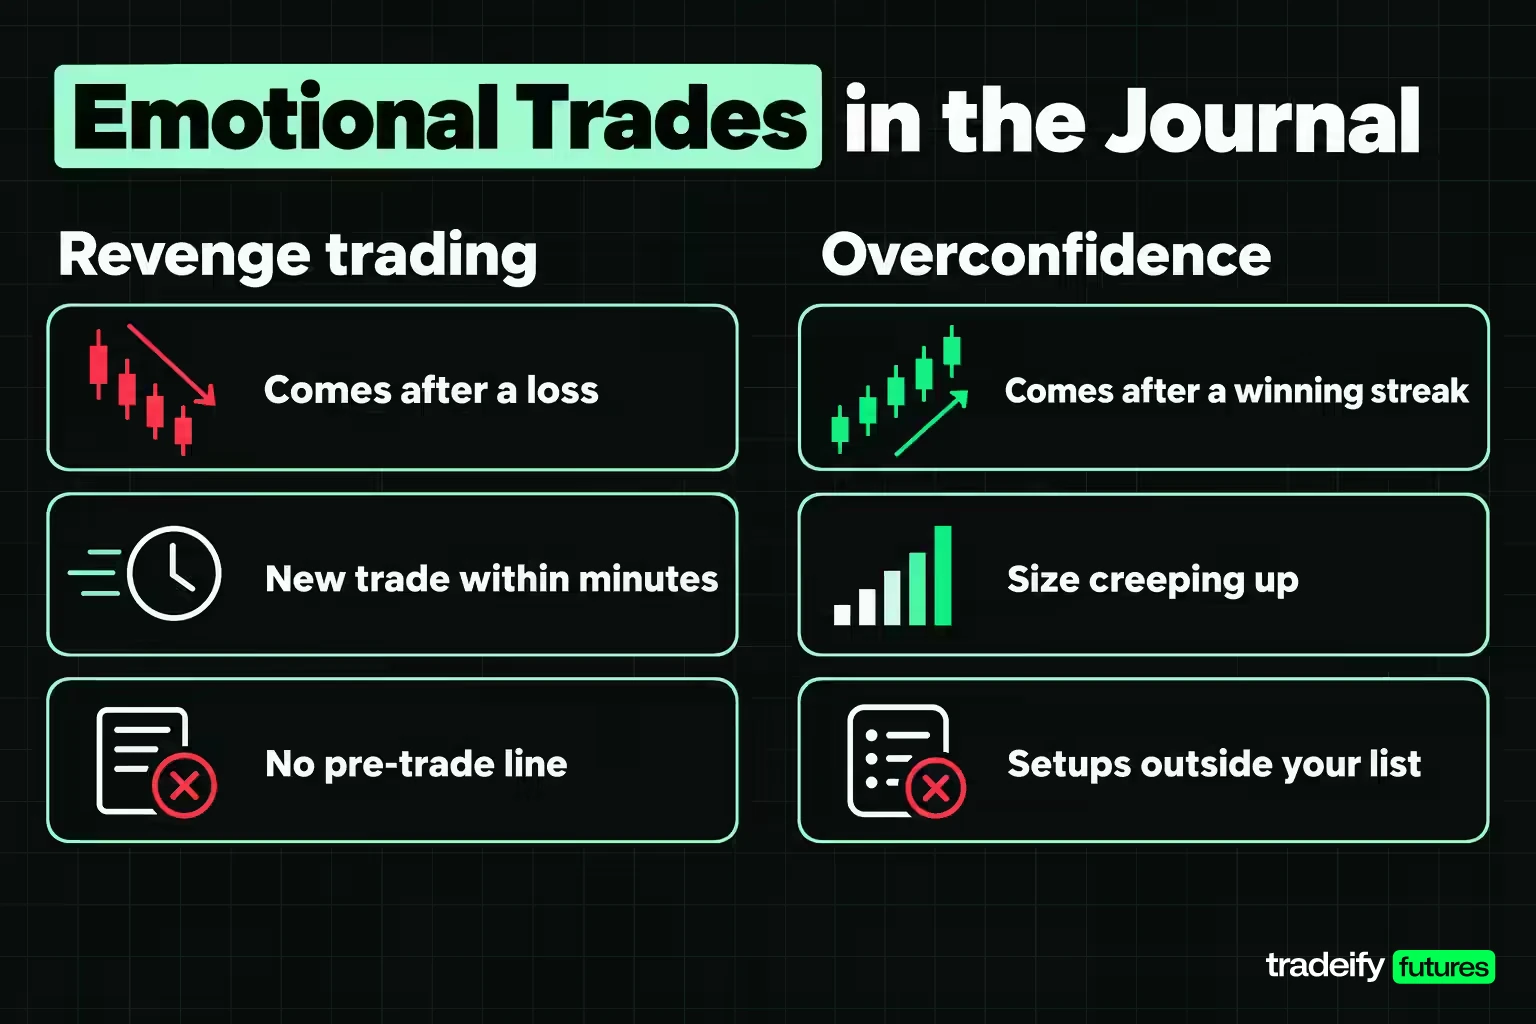
A trading journal is one of the few tools that can catch emotional trading in numbers rather than in hindsight. The pre-trade emotion score and the rule-followed column do most of the work.
Revenge trading has a recognisable journal signature: a loss, then a new trade within minutes, often with a larger size, no pre-trade line and a high frustration score. Tag those trades "after-loss" and compare them with everything else at the monthly review. If they underperform, you have evidence for a cool-off rule, such as no new entry for 15 minutes after a full 1R loss.
Overconfidence shows up the other way: size creeping up after a winning streak, or setups outside your list after a good week. A size column and a setup column make that drift visible.
Losing streaks a journal should expect
A trading journal also stops you reading a normal losing run as a broken strategy. The 20-session breakout rule in this guide's E-mini study lost 59.8% of the time. At that loss rate, in runs of 100 trades, the longest losing streak had a median of 7, reached 11 or more 10% of the time and 15 or more 1% of the time. The full 592-trade record contained a 15-trade losing streak.
Seven losses in a row on a rule like that is ordinary, even though it never feels ordinary while it is happening. If your journal shows the streak came from trades that followed the rule, the answer belongs in your position size and daily loss limits, not in a rewrite of the entry rule. If the streak came from broken rules, the journal has found the real problem.
Related lesson: What to do when the losing run arrives
Spreadsheet, Notebook or Trading Journal App
The best trading journal format is the one you will still be filling in three months from now. Each option trades speed against analysis differently.
| Journal format | Strength | Weakness | Best for |
|---|---|---|---|
| Paper notebook | Fast, private, good for honest notes | Cannot sort, average or count tags | Pre-trade lines and emotion notes |
| Spreadsheet | Free, fully custom, sorts and averages | Manual entry, formula upkeep | Traders who want full control of columns |
| Dedicated journal app | Imports fills, builds stats and charts | Subscription cost, fixed fields | Active traders with many trades a day |
| Platform reports | Already there, no extra work | Results only, no reasons or emotions | Checking fills, P&L and win rate |
Many traders end up with a hybrid: imported fills for the numbers, plus a spreadsheet or notes field for the pre-trade line, the rule column and the emotion score. The notebook still has a place for the end-of-day sentence, since writing by hand slows you down enough to be honest.
Whatever you pick, test it by asking whether you can answer "how did my after-loss trades do last month?" in under five minutes. If not, the format is costing you the review.
Automated Trading Journal Imports
Automated trading journal tools import fills from a broker or platform and calculate the result columns for you. That removes the most tedious part of journaling, and it removes typos in prices and times.
Imports capture well:
- Entry and exit times and prices.
- Size, commissions and net profit or loss.
- Win rate, average win, average loss and results by instrument.
- In some tools, the high and low while the trade was open, which gives MAE and MFE.
Imports cannot capture:
- The planned stop and target, so they cannot calculate R correctly unless you add the stop.
- Your reason for the trade or whether it followed the rule.
- How you felt, and whether the trade was planned at all.
That gap is why an automated journal still needs a manual layer. Spend the time the import saves on the pre-trade line and the rule column, which are the fields that change behaviour.
On our accounts, the trader dashboard includes a built-in journal for trade data and performance tracking, and on Tradovate the Performance report under Reports shows P&L, win rate and trade statistics for any date range. Our funded accounts are simulated, so tag those rows by account type.
Common Trading Journal Mistakes
Most trading journal mistakes fall into a few repeat patterns, and each has a simple fix.
- Recording only profit and loss. The journal becomes a scoreboard. Fix: add the rule column and the result in R.
- Writing too much. Long entries get skipped on hard days. Fix: cap the daily cost at about ten minutes.
- Backfilling from memory. Rows written days later lose the path and the emotion. Fix: fill the row within ten minutes of the exit.
- Editing old rows. Changing a reason after the result is known erases the lesson. Fix: add a dated note instead of rewriting.
- Skipping bad days. A journal missing its worst days overstates the edge. Fix: log every trade, including the ones you regret.
- Reading small samples as verdicts. Fifty trades cannot separate most setups. Fix: write the trade count beside every average.
- Changing several rules at once. You cannot tell which change worked. Fix: one change, then at least 50 to 100 trades.
- Never reviewing. Unread rows do nothing. Fix: book the weekly review like a meeting.
Journaling Demo and Simulated Trades
Demo and simulated trades belong in a trading journal too, with an account-type tag on every row. They are where you practise the journaling habit itself before real money is at stake.
A demo journal is good at measuring process: whether you write the pre-trade line, follow the rule and fill the row on time. It is weaker at measuring emotion, because a loss that costs nothing feels different. Fills can also be friendlier than live markets, especially in fast conditions.
Keep demo, evaluation and live rows in the same format but separate them in the review. When the emotion scores and rule-followed rate change as the stakes change, the journal is showing you something worth knowing.
Related lesson: Process goals that do not need a season of evidence
Trading Journal FAQ
What's the best way to keep a journal?
The best way to keep a trading journal is a short, fixed routine: one pre-trade line, one result row within ten minutes of the exit and one weekly review. Record results in R and include a rule-followed column. The format matters less than doing it every trading day.
How to create your own trading journal?
Create a spreadsheet with one row per trade and columns for date, setup, reason, emotion score, planned entry, stop and target, actual fills, result in R, rule followed, MAE, MFE and a one-line lesson. Add dropdown lists for setups and emotions so the review can count them. Add columns later only when a review question needs them.
What is the 3-5-7 rule in trading?
The 3-5-7 rule is an informal guideline, not an exchange or regulatory rule. One common version says risk no more than 3% of the account on one trade, keep total open risk at 5% or less, and aim for winners at least 7% larger than losers. A journal is how you check whether you actually follow limits like these.
Can I make $100 a day daytrading?
No trading method can promise a fixed daily amount, and a daily dollar target pushes traders to force trades. A trading journal tells you what your method earns per trade in R, which is the honest starting point. In this guide's 20-year E-mini breakout study, the rule averaged 0.13R per trade, about $18 per trade on one Micro E-mini at the median risk unit of 27.41 points ($137.04), and it traded only a few times a month.
How long before a trading journal becomes useful?
Behaviour patterns, such as rule breaks after losses, often show up within a few weeks. Strategy comparisons take far longer, usually 100 trades or more per setup before an average is worth acting on.
A First-Week Trading Journal Checklist
A new trading journal works best started on the next trade. Do not try to backfill the last three hundred from memory. Open a sheet with the template columns (pre-trade line, fills, result in R, rule followed, MAE and MFE), write the pre-trade line before your next entry, and fill the result row within ten minutes of the exit, including MAE and MFE.
At the end of the week, count two things: how many trades followed the rule, and how many trades you have in total. Write the count beside any average before you write a conclusion. Then pick one behaviour for next week.
Related lesson: The routines that make the row a habit rather than a project
Trading futures involves substantial risk of loss, and leverage means losses can exceed what you expect. The E-mini study in this guide is a historical illustration of one rule on one price series, not a prediction or a recommendation. Evaluation and funded prop accounts run in a simulated setting with their own rules. This article is educational and is not financial advice.


