



TL;DR: Backtesting a trading strategy means running fixed rules over past prices and checking whether the result beats chance. A holdout you never tuned on shows whether a result repeats, and a random-entry control shows whether the signal caused it. In a 2016 to 2026 E-mini S&P 500 test, a breakout made 0.28R per trade on its holdout but could not clearly beat random entries. A one-bar look-ahead slip turned the base rule's 0.027R per trade into 0.549R.
Backtesting a trading strategy is supposed to answer one question before money is at risk: would these rules have made money, and would they do it again? Most backtests answer only the first half, and that half is the easy one. They report a profit factor, a win rate and an equity curve, and leave out whether the rule beat random entries or held up on data it never saw.
This guide covers the full process, from writing the rules to moving to live trading. It uses one breakout rule tested on ten years of E-mini S&P 500 (ES) futures data. The bad results stay in. They teach more about reading a backtest than any clean equity curve.
What Backtesting a Trading Strategy Can and Cannot Prove
Backtesting is the process of applying a written set of trading rules to historical price data and recording every trade those rules would have taken. The output is a trade list: entry, exit, size, profit or loss, and the reason each trade closed. Every metric in a backtest report is built from that list.
Traders backtest because it compresses years of experience into an afternoon. A rule that would take three years of live trading to evaluate can be run over ten years of data before you risk a dollar. That is the real value. You meet the losing streaks, the drawdowns and the dull stretches on paper first, not in your account.
A backtest can show three things.
- The rules are complete. If a computer or a strict replay can execute them with no judgment calls, they are specific enough to test.
- The losses are survivable. You can see the longest losing streak and the deepest drawdown at the size you plan to trade.
- The result holds on unseen data. If you kept a holdout period aside, you can check whether the edge repeats on prices that played no part in designing the rule.
A backtest cannot show that the edge will persist next quarter. Markets move between quiet and violent regimes, and a rule tuned to one of them looks better on paper than it trades. A backtest also assumes you take every signal, including the one after five straight losses. No test measures whether you actually will. Keeping a trading journal next to the test is how most traders find the gap between the rule and their own execution.
Related lesson: Trading journal
How to Backtest a Trading Strategy Step by Step
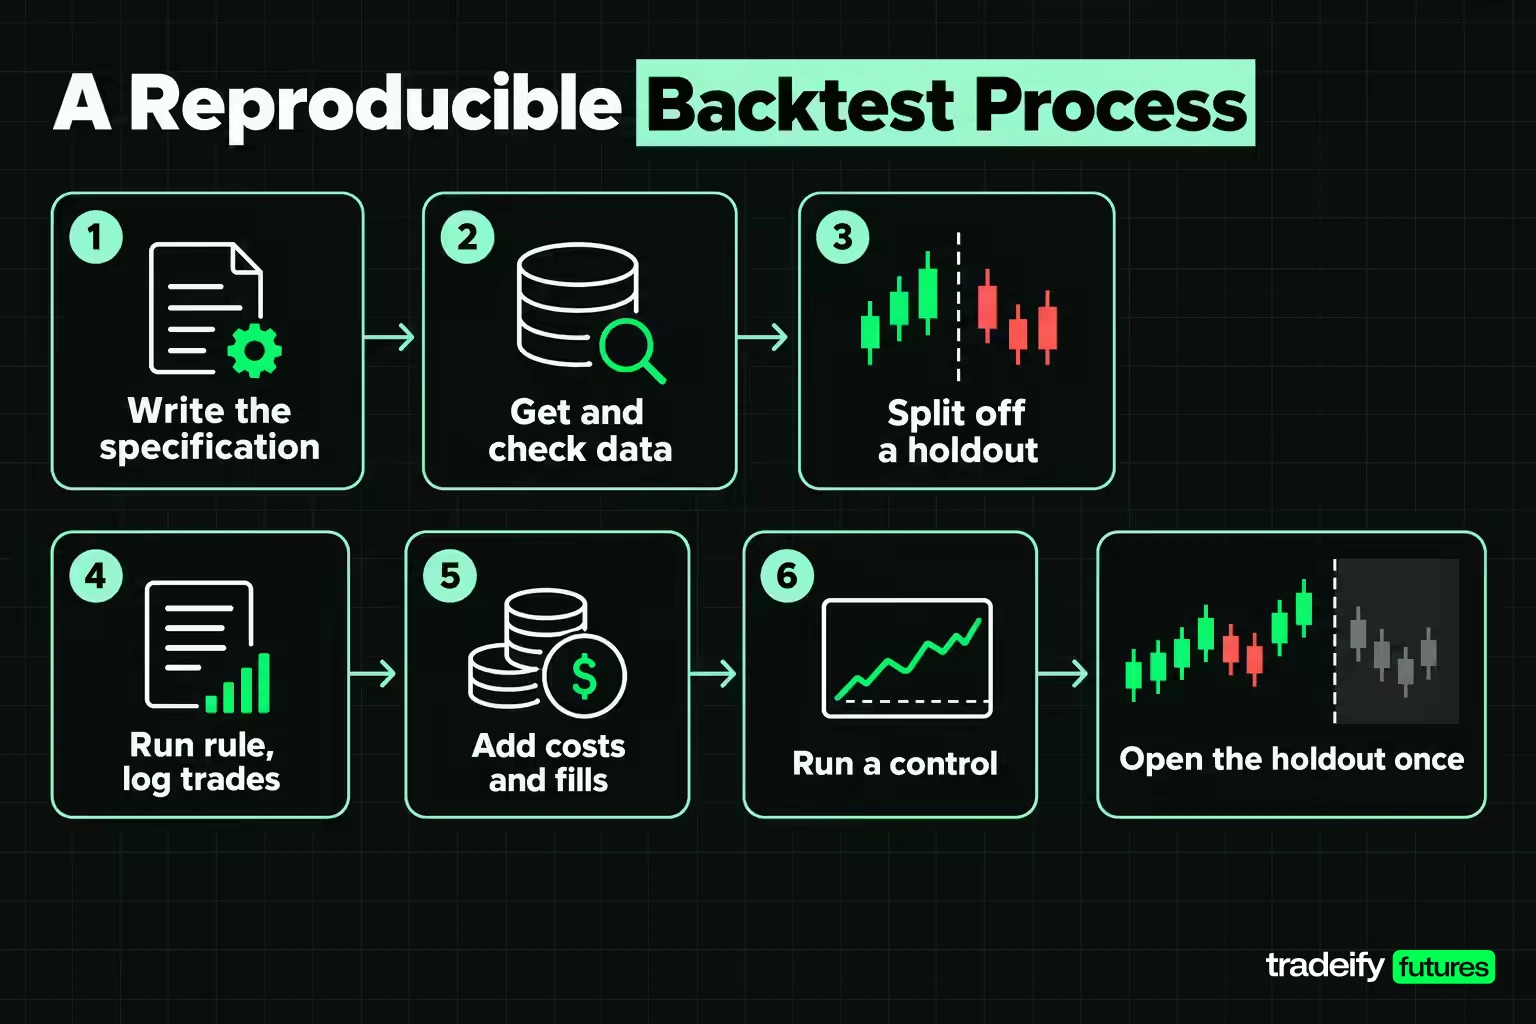
A backtest someone else cannot rebuild is a story, not evidence. This process is built so a second person could reproduce every number from your notes.
- Write the specification first. Instrument, contract, timeframe, entry signal, entry price and timing, stop formula, exit rules and the order they are checked, position limit, and costs. If two exits can fire on the same bar, say which one wins.
- Get the data and check it. Look for missing bars, bad prints and contract-roll jumps. Note the first and last session in the sample.
- Split off a holdout before you look at anything. Pick a date and do not touch the data after it until the rule is final. The test in this guide used 1,761 sessions for design and kept 755 sessions aside.
- Run the rule and log every trade. Keep the trade list, not just the summary. Every metric should be recomputable from it.
- Add costs and realistic fills. Commission, exchange fees, slippage, and fills through the stop when the market gaps past it.
- Run a control. Take the same stop, exit and costs, replace the entry signal with random dates, and see whether the rule beats it.
- Open the holdout once. Run the final rule on the reserved data. If you change the rule after seeing the holdout, the holdout is no longer a holdout.
- Write down what the test does not model. Daily bars cannot tell you whether the stop or the target was hit first inside a session. A stitched futures series carries roll jumps the real contract never made. Saying so is part of the result.
The breakeven arithmetic that turns costs into a required win rate is its own topic.
Related lesson: Commission-adjusted futures breakeven
Manual and Automated Backtesting Tools
There are two ways to backtest, and they answer slightly different questions.
Manual backtesting means scrolling or replaying a chart one bar at a time, deciding whether the setup is present, and logging the trade as you would have taken it. TradingView's Bar Replay, for example, replays historical bars from a start point you choose, at a speed you control. It does not work with tick-based charts or with chart types such as Renko, Kagi and Range. Manual testing suits discretionary setups that are hard to code, and it trains your eye. Its weakness is that it measures your decisions as much as the rule, and nobody else can reproduce it exactly.
Automated backtesting means writing the rule as code and letting software run it across the data. TradingView strategies are written in Pine Script, and their results show up in the Strategy Tester with a performance summary and a list of trades. NinjaTrader 8's Strategy Analyzer runs backtests, parameter optimization, walk-forward optimization and Monte Carlo simulation on NinjaScript strategies. Python or a spreadsheet works too if you are comfortable building the fill logic yourself.
| Method | Best for | Main weakness |
|---|---|---|
| Manual bar replay | Discretionary setups, learning to spot a pattern | Slow, small samples, hard to reproduce |
| Platform strategy tester | Coded rules on one or more instruments | Default fill assumptions can be optimistic |
| Custom code or spreadsheet | Full control over fills, controls and splits | You must write and check every piece yourself |
Whatever the tool, check its fill assumptions before you read a single result. A tester that fills every stop at the stop price, or lets a signal trade on the same bar that created it, will flatter the backtest, sometimes enough to turn a losing rule into a winning one.
Historical Data for a Backtest and the Contract Roll
A backtest is only as honest as the price history under it. For futures, the biggest data question is the contract roll.
Futures contracts expire. E-mini S&P 500 contracts expire quarterly, on the third Friday of March, June, September and December, and volume moves to the next contract around the Monday before. A long-history chart therefore stitches many contracts together into one continuous series. If the series is not back-adjusted, every roll creates a price jump that no single contract ever traded.
The September 2026 ES roll shows the size of it. The continuous ES series closed at 7,657.35 on September 18, 2026, the day the September contract expired. The December contract closed at 7,712.50 that same day and opened at 7,722.00 on September 21, a 9.5-point move. The stitched series shows a 64.65-point jump. A short position in that backtest was stopped out by a gap that was mostly the roll.
That is not a one-off. In the ten-year E-mini S&P 500 (ES) breakout backtest in this guide (20-session closing high or low, 1.5 ATR stop, 10-session hold), 28 of 208 trades were open across a quarterly expiry. Those trades averaged 0.289R against -0.013R for the rest. Some of that difference can come from the roll jump itself rather than from the market. When the next contract trades above the expiring one, as it did in September 2026, an unadjusted series hands longs free points and charges shorts for a move that never happened.
Checking futures data before a backtest
Before you trust a futures backtest, check:
- Whether the continuous series is back-adjusted, and how.
- Whether any trade is open across a roll date, and what price it would have used in the contract you would have held.
- Whether tick size, fees or session hours changed during the sample.
- Whether the sample covers more than one volatility regime.
How far back to go depends on the rule's trade frequency. A daily rule needs years to produce a couple of hundred trades. An intraday rule can reach the same count in months, but should still include at least one quiet stretch and one violent one.
Related lesson: Continuous futures contracts
A Worked Backtest on Ten Years of E-mini S&P 500 Data
The example backtest in this guide is deliberately plain, with no optimization. It was computed on November 4, 2026 from continuous front-month E-mini S&P 500 daily bars (Yahoo Finance ES=F, not back-adjusted).
- Sample. 2,516 sessions from October 31, 2016 to October 30, 2026. Indicators warm up on bars from January 2, 2015, before the sample starts.
- Split. In-sample: 1,761 sessions to October 31, 2023. Holdout: 755 sessions from November 1, 2023 to October 30, 2026.
- Signal. The session closes at the highest close of the last 20 sessions (go long) or the lowest (go short).
- Entry. The next session's open.
- Stop. 1.5 times the 14-session average true range, measured from the entry price.
- Exits, in order. If a session opens beyond the stop, fill at that open (a gap exit). If a session trades through the stop, fill at the stop. Otherwise exit at the close of the 10th session, counting the entry session as the first.
- Position limit. One position at a time.
- Costs. $30 per round turn: $5 of commission and fees plus one tick ($12.50) of slippage on each side. ES is worth $50 per index point.
R is the unit of risk: the dollar distance from entry to stop on that trade. A trade that loses exactly the stop is -1R.
| Period | Trades | Win rate | Mean R per trade | Net on one contract | Profit factor |
|---|---|---|---|---|---|
| In-sample 2016 to 2023 | 146 | 51.4% | 0.057R | +$16,983 | 1.07 |
| Holdout 2023 to 2026 | 62 | 43.5% | -0.042R | -$32,234 | 0.84 |
| Full sample | 208 | 49.0% | 0.027R | -$15,251 | 0.97 |
The full-sample row is the one most backtest reports would show. It hides the fact that the rule was mildly positive in the design period and negative on the holdout. It also hides a contradiction: the full sample is +5.7R but -$15,251. A backtest that only printed the bottom row would look like a near-breakeven rule worth tweaking, when the split says something different is going on.
Backtest Performance Metrics That Matter
Every backtest metric is a summary of the trade list, and each one answers a different question. Here is what the main ones say about the ten-year E-mini S&P 500 (ES) breakout backtest in this guide.
| Metric | What it answers | ES rule, full sample |
|---|---|---|
| Win rate | How often a trade closes positive | 49.0% |
| Expectancy in R | Average result per unit of risk | 0.027R |
| Profit factor | Gross dollars won divided by gross dollars lost | 0.97 |
| Maximum drawdown | Worst peak-to-trough fall in the equity curve | $76,273, or 15.2R |
| Longest losing streak | How many losses in a row to expect | 6 |
| Gap exits | Trades that filled worse than the stop | 3 |
Win rate on its own says almost nothing. A 49.0% win rate is fine if winners are bigger than losers and fatal if they are not. It is also the number traders most want to be high, which is exactly why it should not be the headline. Expectancy in R folds both into one number, which is why it is the better headline.
The Sharpe ratio measures average return per unit of return volatility over a period, usually annualized. It needs an account size and a return series, so it depends on how you size the trades. For a single-contract futures test, expectancy in R plus maximum drawdown usually tells you more.
R versus dollars in a backtest
A backtest should publish results in both R and dollars, and the ten-year E-mini S&P 500 (ES) breakout backtest in this guide shows why. In R it made +5.7R over 208 trades. In dollars on one contract it lost $15,251. The stop distance is not constant: risk per trade ran from $1,217 at the 5th percentile to $8,661 at the 95th. Median risk was $3,236 in the design period and $5,221 in the holdout, so the holdout's losing trades cost more dollars each. R measures the rule. Dollars measure the account. If you trade a fixed number of contracts, the dollar column is the one you live with.
Outlier dependence in a backtest
Check how much of a backtest result a few trades carry. In the ten-year E-mini S&P 500 (ES) breakout backtest in this guide, the largest single winner was 3.94R, only 3.6% of gross positive R, which looks healthy. But the ten largest winners added 28.5R, and without them the total falls from +5.7R to -22.8R. A result that rests on a short list of big trades depends on those trades repeating.
Related lesson: Profit factor
Trading Costs and Slippage in a Backtest
Costs turn a gross backtest into something you could have banked. Leave them out and a marginal rule looks like an edge.
Model three things:
- Commission and exchange fees per round turn, from your broker's or firm's schedule.
- Slippage on every order that executes at market, including stops. One tick per side is a common starting assumption for liquid index futures. Thinner markets and fast sessions need more.
- Gap fills. A stop order becomes a market order once it is triggered, so a session that opens beyond the stop fills at the open, not at the stop.
The ten-year E-mini S&P 500 breakout backtest in this guide assumed $30 per round turn, and ES is worth $50 per point. At the median risk of $4,010, that is 0.0075R per trade, small for a daily rule. The cost ladder shows how close the rule sits to zero anyway:
| Cost per round turn | Mean R per trade, full sample |
|---|---|
| $0 | 0.037R |
| $30 | 0.027R |
| $60 | 0.017R |
| $120 | -0.002R |
A rule whose sign flips at $120 a round turn has almost no margin for worse fills. Intraday rules trade far more often with tighter stops, so the same costs eat a much larger share of each trade.
Gap exits in a backtest
In the ten-year E-mini S&P 500 (ES) breakout backtest in this guide (20-session closing high or low, 1.5 ATR stop, 10-session hold), three of the 208 trades gapped through their stops, so a stop order (which becomes a market order once triggered) filled at the open beyond it. On January 24, 2020, the rule went long at 3,326.50 with a stop at 3,279.79. The market opened at 3,269.75 on January 27, so the fill was -1.23R, not -1R, for a loss of $2,867.50 on one contract. Two of the three gap exits came on the first session after a quarterly expiry. Report gap exits as their own exit type with their own count, because each one is a loss larger than the risk you planned. Those two post-expiry gaps also show the contract-roll problem: an unadjusted continuous series can print a gap the contract you would have held never made.
Reading Backtest Results on a Holdout
A holdout (also called out-of-sample data) is a block of history you keep aside while designing the rule. Every decision you make while building a rule is made with the in-sample data in view, so in-sample results are always flattered. The holdout is the first honest read.
In the ten-year E-mini S&P 500 (ES) breakout backtest in this guide, the design period ran from October 2016 to October 2023 and the holdout from November 2023 to October 2026. The rule went from 0.057R per trade in-sample to -0.042R on the holdout. That alone does not prove the rule is broken, because both numbers are noisy. Resampling each trade list 5,000 times (a bootstrap) shows how noisy:
| Period | Trades | Mean R | 5th to 95th percentile of resampled mean | Share of resamples above zero |
|---|---|---|---|---|
| In-sample | 146 | 0.057R | -0.099R to 0.214R | 72.2% |
| Holdout | 62 | -0.042R | -0.296R to 0.214R | 38.5% |
Both ranges contain zero. With 146 trades, the in-sample result could not be told apart from a rule with no edge at all.
How many trades a backtest needs
You can estimate the number of trades a backtest needs from its own results. In the ten-year E-mini S&P 500 (ES) breakout backtest in this guide, with an in-sample mean of 0.057R and a standard deviation of 1.13R per trade, a one-sided 95% test needs roughly 1,079 trades before the mean clears zero. The rule produced 146. No extra metric fixes a sample that is too small to separate the edge from noise.
Long and short sides of a backtest
Split a backtest result by direction before you trust it. In the ten-year E-mini S&P 500 (ES) breakout backtest in this guide, the in-sample longs made 0.209R per trade over 97 trades while the shorts lost 0.245R over 49. On the holdout, longs made 0.251R over 41 trades and shorts lost 0.615R over 21. The rule's whole result is "buy strength in a market that rose, short strength in a market that rose." So the real question for this backtest is whether the signal added anything to simply being long. A random-entry control answers it.
Related lesson: Trading expectancy
A Random-Entry Control for Any Backtest
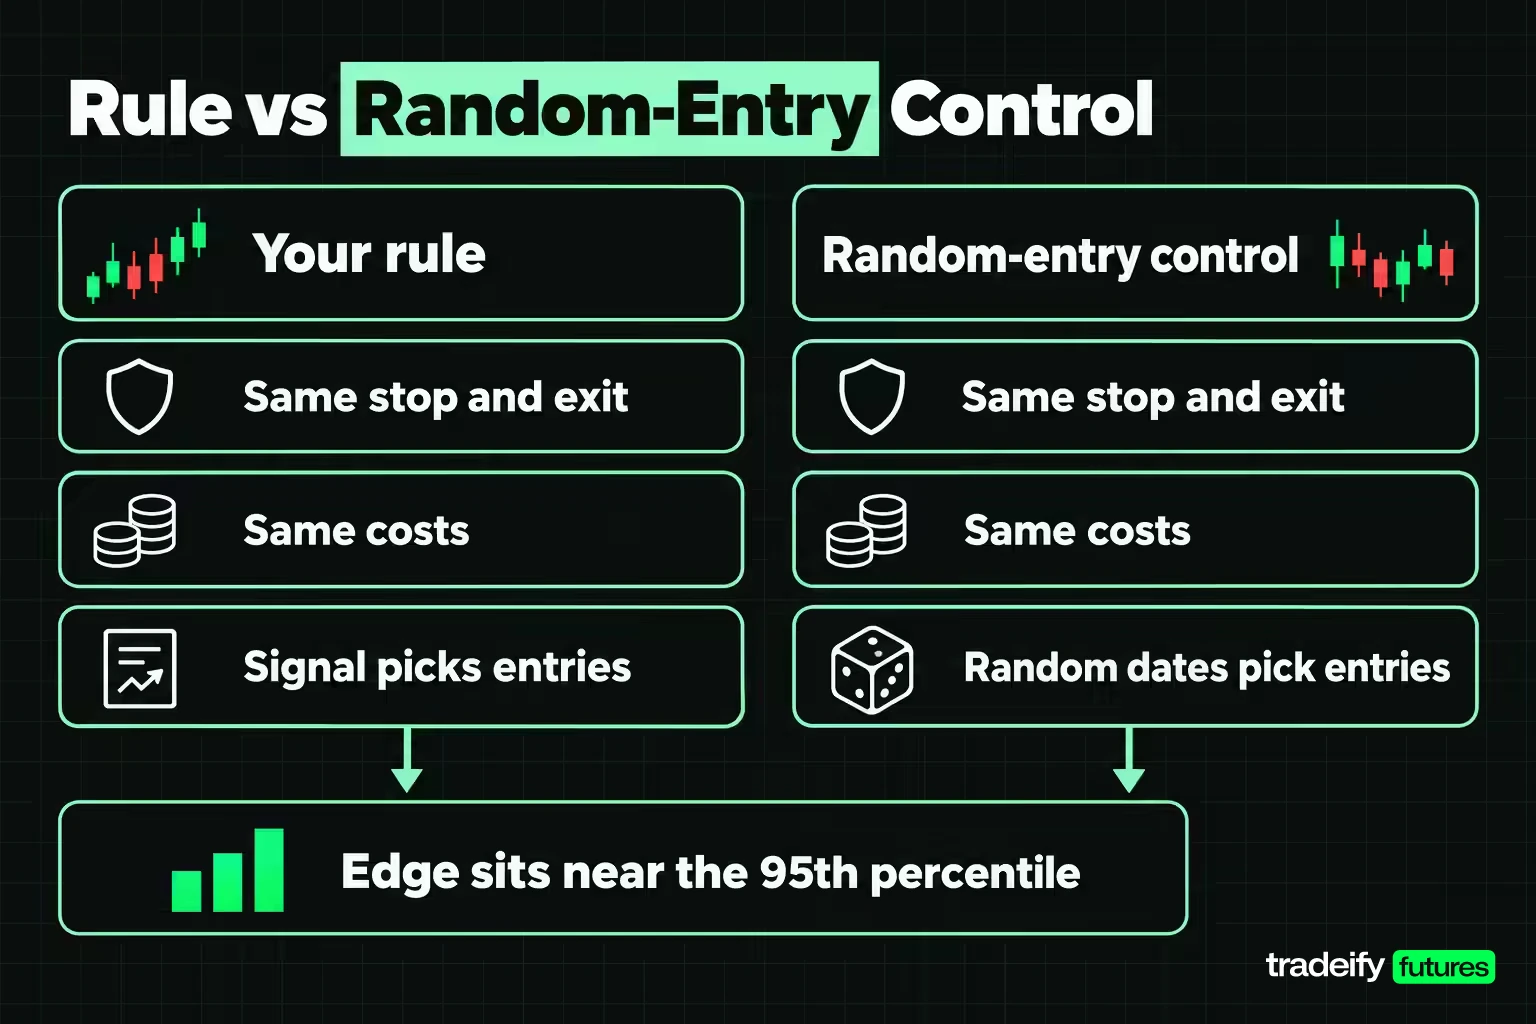
A random-entry control keeps everything about a rule except its signal. Same stop formula, same exit, same costs, same one-position limit, but entries on randomly chosen dates. If random entries do as well as the rule, the signal is decoration and the result came from the stop, the exit or the market's drift.
For the ten-year E-mini S&P 500 (ES) breakout backtest in this guide, each control run split the period into as many equal blocks as the rule had trades and picked one session per block using a hash of the date and a seed, so the draw can be rebuilt exactly. Direction was drawn at random in the same long and short mix as the rule. The control was run 1,000 times with different seeds.
| Test | Rule mean R | Control median | Control 5th to 95th percentile | Rule's percentile |
|---|---|---|---|---|
| Base rule, in-sample | 0.057R | 0.034R | -0.138R to 0.207R | 59.5th |
| Base rule, holdout | -0.042R | 0.007R | -0.241R to 0.293R | 37.9th |
| Best grid cell, holdout | 0.28R | 0.169R | -0.192R to 0.575R | 66.8th |
What the control showed for the ES backtest
A rule with a real edge should sit near or above the 95th percentile of its control. The base rule sat at the 59.5th in-sample and below the median on the holdout.
The last row is the important one. The best-looking version from the parameter grid, a 55-session channel with a 1.0 ATR stop, made 0.28R per trade on the holdout over 44 trades. That would pass most holdout checks. But 39 of its 44 holdout trades were long in a rising market, and random entries with the same long and short mix made a median of 0.169R. The rule sat at the 66.8th percentile: better than average, nowhere near significant. The holdout passed it. The control did not. That is the case for running both: a holdout checks whether a result repeats, and a control checks whether the signal caused it.
A simpler long-only control tells the same story. Random long entries made a median of 0.159R in-sample and 0.16R on the holdout. The rule's own longs (0.209R and 0.251R) sat at about the 71st percentile both times.
Overfitting a Backtest With Parameter Grids
Overfitting means tuning a rule until it fits the noise in past data rather than a pattern that repeats. The usual route is a parameter grid: try many settings, keep the best one.
The ten-year E-mini S&P 500 breakout rule in this guide (closing-high or closing-low channel, ATR stop, 10-session hold) was run on its October 2016 to October 2023 design period with four channel lengths and three stop widths, 12 combinations in all, each holding for 10 sessions:
| Channel length | Stop 1.0 ATR | Stop 1.5 ATR | Stop 2.0 ATR |
|---|---|---|---|
| 10 sessions | 0.11R | 0.081R | 0.023R |
| 20 sessions | 0.099R | 0.057R | 0.041R |
| 40 sessions | 0.039R | 0.031R | 0.035R |
| 55 sessions | 0.165R | 0.15R | 0.14R |
Every cell is positive, and that is the trap. A smooth positive grid feels like confirmation, but every cell shares the same feature: it buys new highs in a market that rose for most of the decade. Random long entries with the same stop and hold were also positive on this data, with a median of 0.159R, for the same reason. A positive grid shows a rule is not fragile. It does not show the signal is doing the work.
Picking the best cell, 0.165R, is also a selection effect. Out of 12 noisy estimates, the highest one is likely to be partly luck. The best cell then made 0.28R on the holdout, which looks like vindication until a direction-matched random control made a median of 0.169R over the same years.
The exit setting moved the result as much as the entry did. On the full sample, a 5-session hold made 301 trades at 0.003R and lost $15,757 on one contract. A 20-session hold made 152 trades at 0.081R, still lost $10,059, and produced 5 gap exits.
Ways to limit overfitting in a backtest:
- Fix the number of settings you will try before you start, and report all of them.
- Prefer a broad plateau of decent results over a single sharp peak.
- Keep the rule short. Every added filter is another chance to fit noise.
- Judge the chosen setting on the holdout and against a control, never on the grid alone.
Related lesson: Overfitting and look-ahead bias
Common Backtesting Biases and Mistakes
Most bad backtests fail in one of a handful of ways.
Look-ahead bias means the test uses information that was not available when the trade was placed. It is easier to commit than it sounds. Take the ten-year E-mini S&P 500 (ES) breakout backtest in this guide and change one line, so the signal is read from a session's close but the trade enters at that same session's open. That is a common coding slip. The result:
| Version | Trades | Win rate | Mean R | Profit factor | Net on one contract |
|---|---|---|---|---|---|
| Honest next-open entry | 208 | 49.0% | 0.027R | 0.97 | -$15,251 |
| Look-ahead same-session entry | 212 | 64.6% | 0.549R | 2.62 | +$444,303 |
One misplaced bar turned a losing rule into one that looks spectacular. Nothing about the strategy changed, only when the code was allowed to know the close. If a backtest looks too good, check the entry timing before anything else.
Other common biases and mistakes:
- Survivorship bias. Testing only on instruments that still exist today. A stock list built from today's index members leaves out the companies that failed.
- Data snooping. Trying many ideas on the same data and reporting the winner as if it were the only one tested.
- Roll artifacts. Trading through unadjusted futures roll jumps. On ES, the September 2026 roll put a 64.65-point jump into the continuous series when the December contract itself moved 9.5 points.
- Ignoring costs and gap fills. Filling every stop at the stop price and assuming zero slippage.
- Too small a sample. Drawing conclusions from 30 or 50 trades when the rule's own spread of results needs hundreds.
- Testing only one market regime. A rule tested only in a bull market has never met a bear market.
Backtesting Across Market Conditions and Markets
A strategy that works in only one kind of market is a bet on that market continuing. Splitting the backtest by condition shows where the result comes from.
Here is the ten-year E-mini S&P 500 (ES) breakout backtest in this guide, split by whether price was above or below its 200-day average at the signal:
- Above the 200-day average: 174 trades at 0.03R. Shorts in that state lost 0.394R per trade over 48 trades.
- Below the 200-day average: 34 trades at 0.014R. Shorts still lost 0.272R per trade over 22 trades.
Split by volatility, using the 14-session ATR as a percentage of price:
| Volatility third | Trades | Mean R |
|---|---|---|
| ATR under 1.0% of price | 69 | 0.067R |
| ATR 1.0% to 1.46% of price | 69 | 0.043R |
| ATR above 1.46% of price | 70 | -0.027R |
By calendar year the swings were wider still: 0.279R per trade in 2019 over 20 trades, -0.226R in 2021 over 24 trades and -0.443R in 2026 over 19 trades, a loss of $43,301 on one contract that year. One rough year is not a verdict on a rule, but a backtest that hides its worst year behind a ten-year average is hiding the year you might start in.
Testing a backtest on NQ and gold futures
Running the same 20-session breakout rule from the ten-year ES backtest, unchanged, on other markets checks whether the edge is general or specific to one instrument. With the same $30 cost assumption, the rule on E-mini Nasdaq-100 (NQ, $20 per point) made 0.133R per trade over 150 in-sample trades, then 0.038R over 60 holdout trades and lost $26,792. On gold futures (GC, $100 per $1 move), it made 0.034R over 131 in-sample trades and 0.003R over 57 holdout trades. Three markets, the same pattern: weaker on the holdout and close to zero.
Backtesting vs Forward Testing and Walk-Forward Analysis
Backtesting runs the rule on past data. Forward testing runs it in real time on live prices, usually in a simulator or at minimum size, without changing the rules. A backtest tells you whether the rule would have worked. A forward test tells you whether it still works and whether you can execute it.
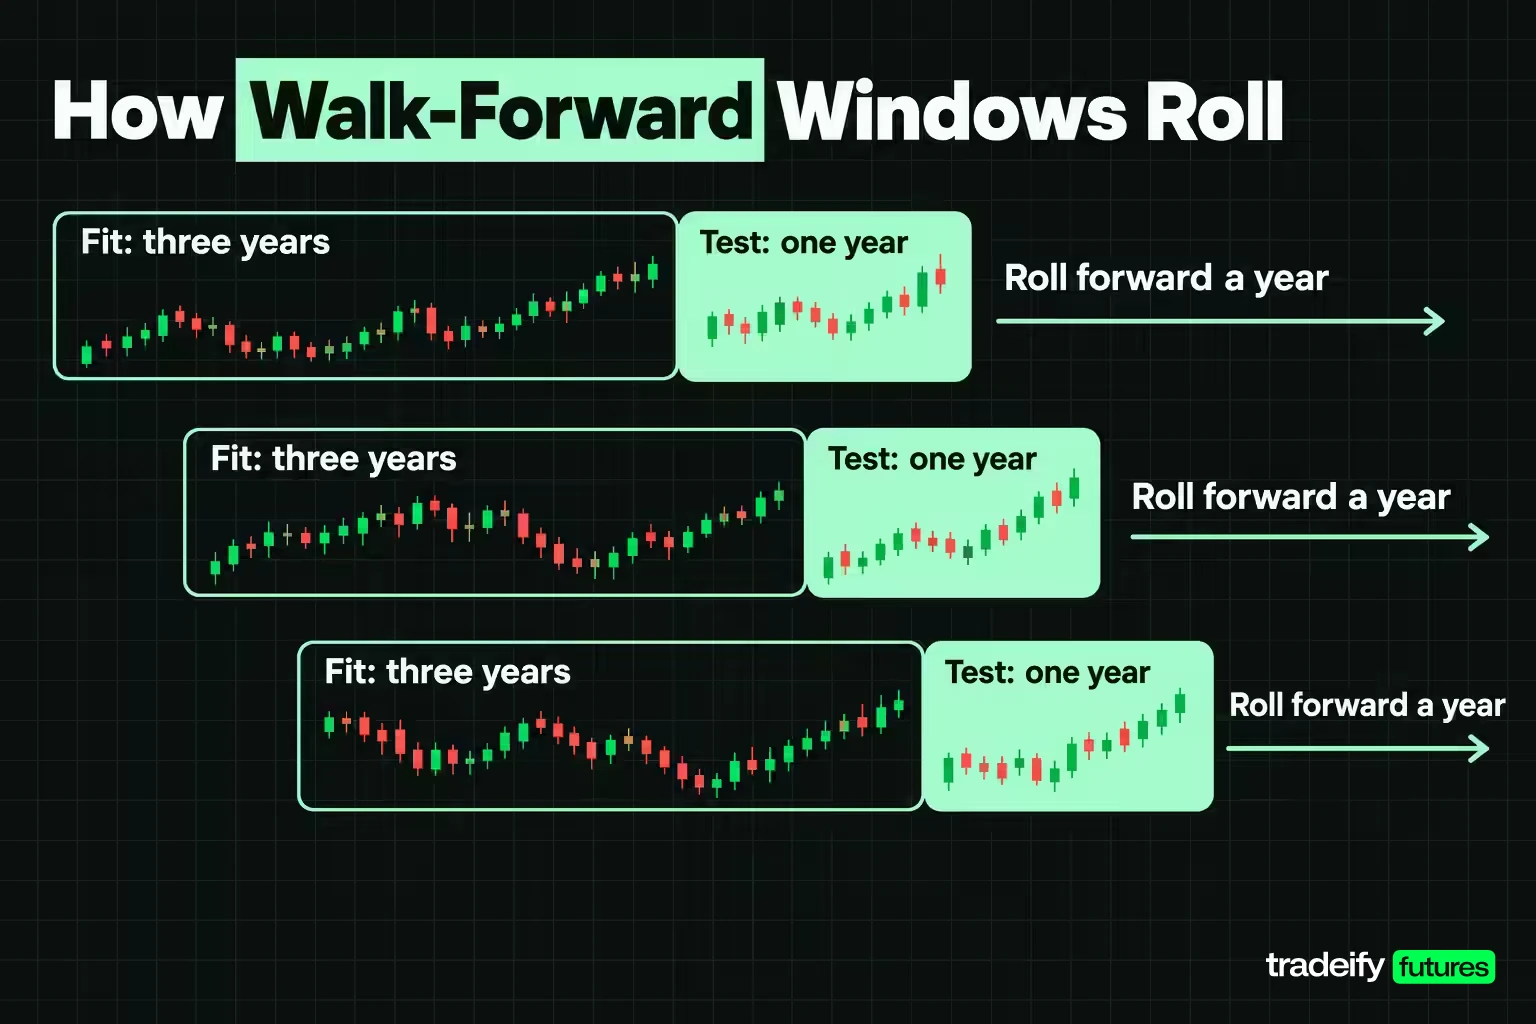
Walk-forward analysis sits between the two. You fit the rule's settings on one stretch of history, test them untouched on the next stretch, then roll both windows forward and repeat. Each test window is out-of-sample for the settings chosen just before it.
The ten-year E-mini S&P 500 breakout rule in this guide was walk-forward tested with seven windows: three years of fitting on the 12-setting grid, then one year of testing, rolled forward a year at a time from November 2019 to October 2026.
- The test year was positive in 4 of 7 windows.
- The best setting averaged 0.282R per trade in its fitting windows and 0.008R in the test years that followed.
- The worst test year, November 2021 to October 2022, lost 0.692R per trade right after its settings had made 0.435R in fitting.
The drop from fit to test is the clearest view of overfitting a backtest can give you. When a rule's chosen settings lose most of their edge every time they meet new data, more optimization is the wrong fix.
Move from backtest to forward test only when the rule beats its control and survives a holdout. Then forward test for long enough to collect a meaningful number of trades, not a set number of weeks.
Related lesson: Forward testing and walk-forward analysis
Backtest Limits and Risk Management
A backtest is a record of one path through history. The next path will be different, so risk planning should use the backtest's worst numbers rather than its average.
What the ten-year E-mini S&P 500 (ES) breakout backtest in this guide says about risk:
- The deepest drawdown was 15.2R, or $76,273 on one contract.
- The longest losing streak was 6 trades.
- Three trades lost more than 1R because the market gapped through the stop.
If you were to size this rule, the useful question is not what it averages. It is whether you can sit through a 15.2R drawdown and six losses in a row without quietly rewriting the rules halfway through. Size so the backtest's worst drawdown, plus a margin for a worse one, fits inside the loss you can actually accept.
What no backtest knows:
- Whether the market regime that paid the rule will continue.
- How you will behave after the fifth loss in a row.
- Fill quality in a fast market, beyond what you modelled.
- Account rules that close a position or a day before the rule would.
That last point matters most for traders working inside daily loss limits or trailing drawdowns, where a position the backtest holds for days could breach a limit the backtest never modelled.
Moving From a Backtest to Live Trading
A backtest that passes its holdout and beats its control is ready for the next test, not for full size. A sensible path to live trading looks like this:
- Freeze the rules. Write the final specification and stop editing it.
- Decide the kill criteria in advance. For example, stop and review if the drawdown exceeds the backtest's worst by a set margin, or if the forward-test mean falls outside the backtest's bootstrap range.
- Forward test in a simulator or at minimum size. Log every trade the same way the backtest did, so the two trade lists can be compared line by line.
- Compare fills. Real slippage and gap fills against the backtest's assumptions.
- Scale up slowly. Add size only after the forward test agrees with the backtest over a meaningful number of trades.
Expect the forward results to be worse than the backtest, and decide now that this is normal rather than a reason to start tinkering. Every backtest carries some selection bias, and real fills are rarely kinder than modelled ones. If the forward test lands inside the backtest's range, the rule is behaving. If it lands well below, the backtest was probably flattered.
Account rules in a backtest
Account rules belong in the backtest too. Re-run the trade list against any daily loss limit, trailing drawdown or position cutoff on the same sessions before treating a positive backtest as fit for that account.
On our accounts, every position is closed by 4:45 PM ET and nothing can be held overnight, so a rule that holds for ten sessions, like the E-mini S&P 500 breakout example in this guide, cannot run as written on a Tradeify account. The honest next step is to rebuild the test on intraday bars with an exit at or before the session close, then check it against the account's end-of-day trailing drawdown. WealthCharts, one of our supported platforms, includes Chart Replay for practicing a manual rule on historical data.
Backtesting FAQ
How many trades do you need to backtest a strategy?
There is no fixed number, because it depends on how noisy the rule is. Estimate it from the rule's own mean and standard deviation in R. In the ten-year E-mini S&P 500 breakout backtest in this guide, a mean of 0.057R and a standard deviation of 1.13R needed roughly 1,079 trades to clear zero at 95% confidence.
What is the difference between in-sample and out-of-sample data?
In-sample data is the history you used to design and tune the rule. Out-of-sample data, or the holdout, is history the rule never influenced. Only the out-of-sample result is a fair estimate of how the rule might behave next.
Can you backtest a discretionary strategy?
Yes, by replaying charts bar by bar and logging the trades you would have taken, without peeking ahead. The result measures your decisions as well as the setup, and it is hard for anyone else to reproduce. Writing the setup down as precise rules makes it testable.
Is a profitable backtest enough to start trading live?
No. A profitable backtest is one check passed. It should also hold up on a holdout, beat a random-entry control, survive realistic costs and pass a forward test before real money goes behind it.
Why do backtest results differ from live results?
Backtests usually assume clean fills, no missed signals and perfect discipline. Live trading adds slippage, gaps, platform issues and human hesitation. Some selection bias from choosing the best version of the rule also fades on new data.
Next Steps After Your First Backtest
Take one rule you already trade and write its full specification before you open a chart: signal, entry timing, stop, exits in order, costs and the date your holdout starts. Run it once on the design period, then run a random-entry control with the same stop and exit beside it.
If the rule cannot beat its own control on the design data, the holdout will not rescue it, so change the idea before you change the settings. If it does beat the control, open the holdout once, write down what you see, and forward test at minimum size before the backtest earns any real risk.
Futures trading involves substantial risk of loss and is not suitable for everyone, and leverage means losses can exceed what you expect. The backtest in this guide is an educational example on historical data with an assumed cost model. Past results, whether backtested, simulated or live, do not guarantee future results, and simulated or funded accounts are simulated trading. Nothing here is financial advice or a recommendation to trade any rule, instrument or size.


