




TL;DR: Maximum drawdown is the deepest peak-to-trough fall in an equity curve, and it decides how much risk you can afford per trade. On 20 years of daily E-mini S&P 500 bars, the worst fall was 57.1%, and getting back to the old high took until 2013. Deep drawdowns need far bigger gains to repair, and short samples understate them. Set your drawdown limit first, then your size.
Maximum drawdown is the number that tells you how bad it got. Not the average day, not the win rate, but the deepest hole an account or a market fell into before it climbed back out.
That makes it the risk figure traders actually feel. A strategy with a great return and a 40% maximum drawdown asks you to sit through losing almost half the account, and most people quit long before the bottom. The return on paper only counts if you can stay in the chair.
This guide measures maximum drawdown on 20 years of daily E-mini S&P 500 (ES) and E-mini Nasdaq-100 (NQ) futures bars, from October 31, 2006 to October 30, 2026, then turns the metric into something you can plan with: a recovery cost, a position size and a limit you can survive.
What Maximum Drawdown Means
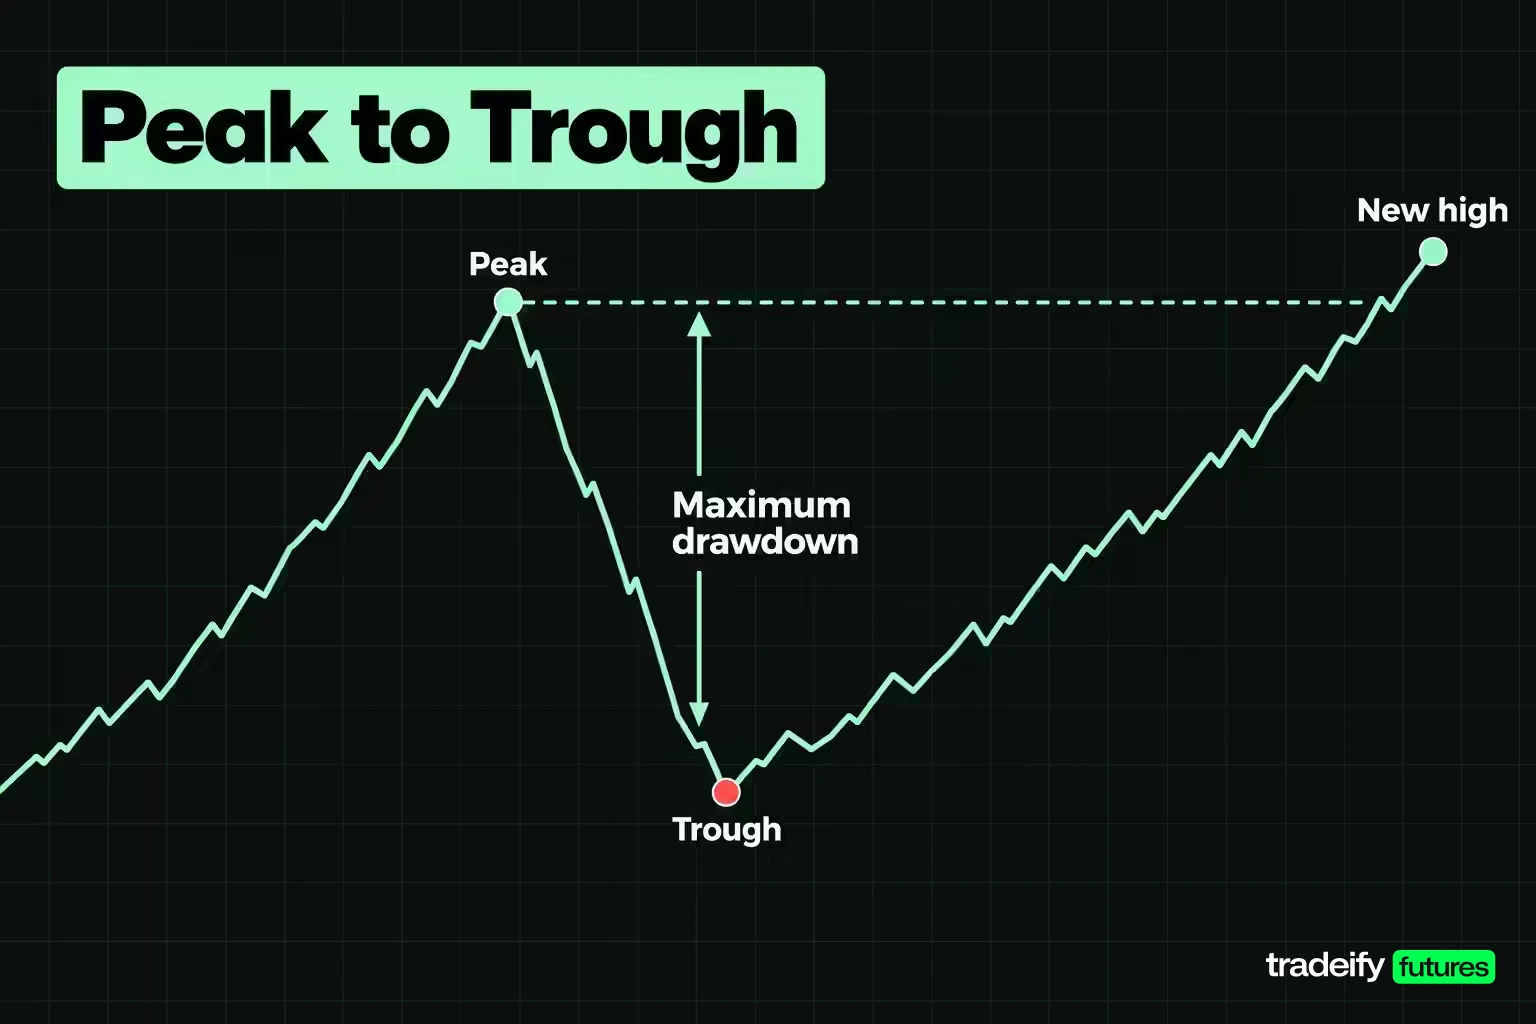
Maximum drawdown (often shortened to MDD or max drawdown) is the largest percentage fall from a high point to a later low point, measured before a new high is made. It answers one question: if you had started at the worst possible moment, how much would you have been down at the bottom?
Drawdown risk is the broader idea behind it. It is the risk that your capital sits below an earlier peak, how far, and for how long. Volatility tells you how much prices wiggle. Drawdown tells you how much damage those wiggles did when they lined up in one direction.
Three measurement choices change the maximum drawdown figure, so check them before you compare two numbers.
- The window. A maximum drawdown is always the worst fall over some period. The same market or strategy gives a different number over one year, five years or twenty.
- Closes, intraday prices or open equity. A drawdown measured on daily closes is smaller than one measured on intraday lows. On ES the 2007 to 2009 fall was 57.1% close to close and 58.0% from the intraday high to the intraday low. For a trader, a drawdown on closed trades only looks cleaner than one that counts open positions, because an open trade can push the account below its peak and then recover.
- A fixed or trailing peak. A static drawdown is measured from a fixed starting balance. A trailing drawdown follows the highest balance reached, so every new high raises the floor. A 6% trailing limit is stricter than a 6% static limit on any account that has grown.
The Maximum Drawdown Formula and How to Calculate It
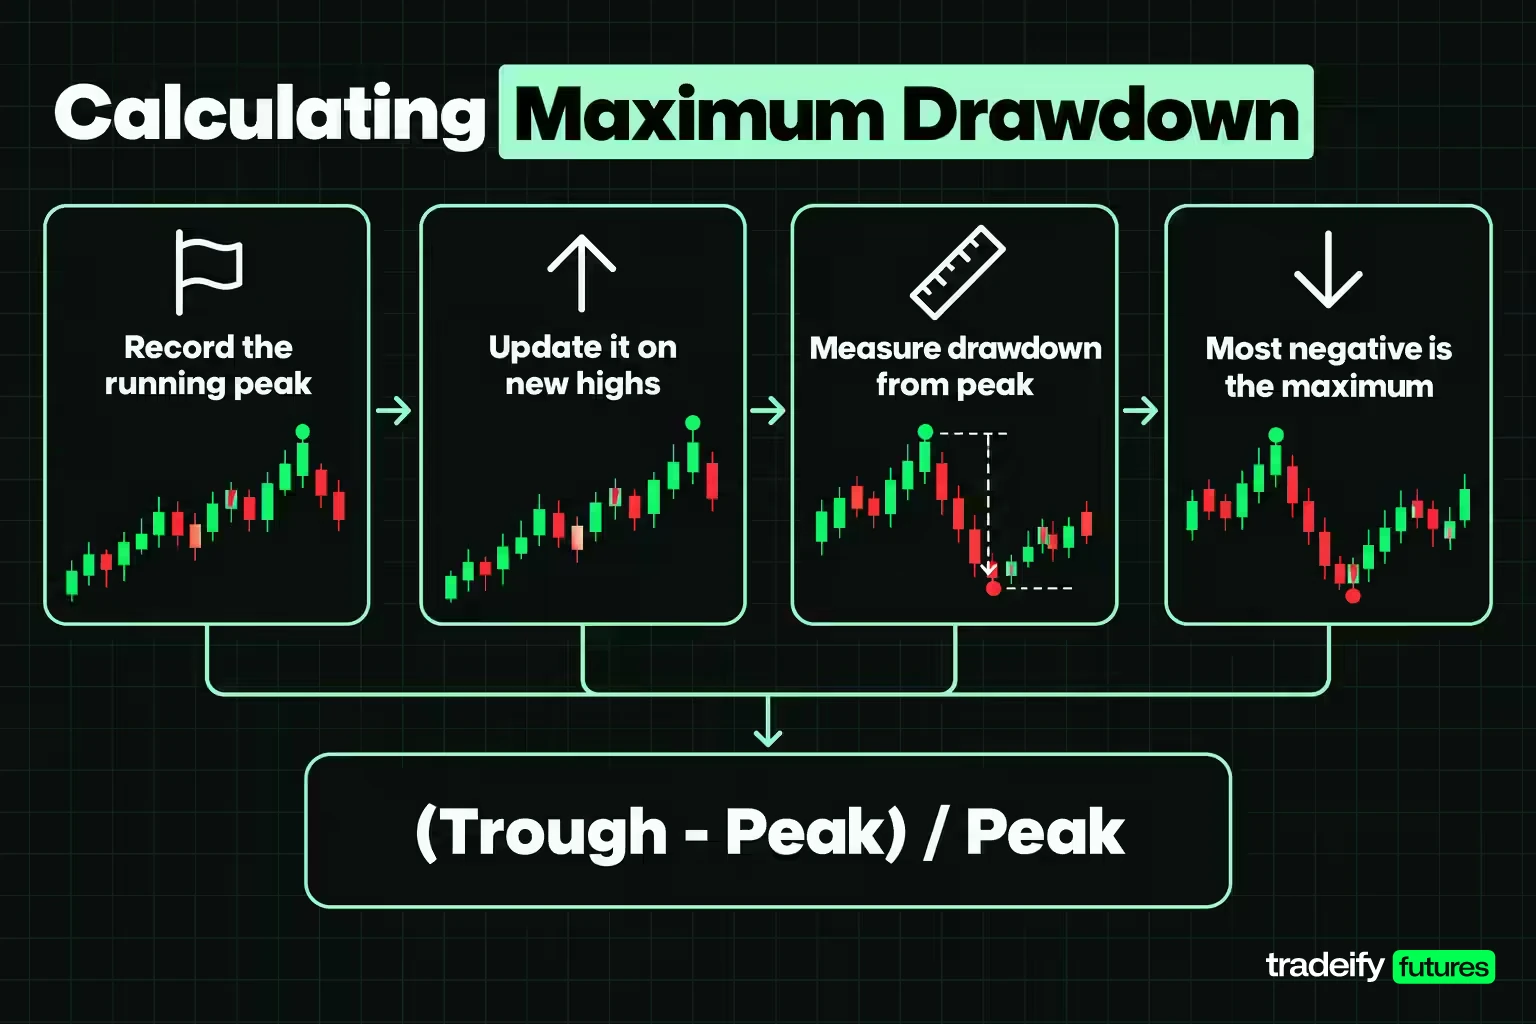
The maximum drawdown formula is simple once you track the running high.
Maximum drawdown = (trough value - peak value) / peak value
The peak must come before the trough, and the trough is the lowest point before the curve makes a new high. An account that runs to $60,000, falls to $42,000 and later climbs past $60,000 has a maximum drawdown of (42,000 - 60,000) / 60,000 = -30%, usually quoted as 30%.
Calculating maximum drawdown step by step
The step-by-step method works on any series: account balances, daily closes or an index.
- Start at the first value and record it as the running peak.
- Move forward one point at a time. If the value is above the running peak, it becomes the new peak.
- At each point, compute the drawdown as value / running peak - 1.
- The most negative drawdown in the whole series is the maximum drawdown.
Here is an illustrative account curve, worked through the same way.
| Point | Account balance | Running peak | Drawdown from peak |
|---|---|---|---|
| 1 | $50,000 | $50,000 | 0% |
| 2 | $54,000 | $54,000 | 0% |
| 3 | $49,500 | $54,000 | 8.3% |
| 4 | $56,000 | $56,000 | 0% |
| 5 | $47,600 | $56,000 | 15% |
| 6 | $58,000 | $58,000 | 0% |
The curve has two drawdowns, 8.3% and 15%. The maximum drawdown is the larger one, 15%, or $8,400 in dollars. Notice that the second dip went lower in dollars than the first starting balance, but what counts is the fall from the running peak of $56,000.
Calculating maximum drawdown in Excel
Excel or Google Sheets handles the maximum drawdown calculation with two helper columns.
- Put dates in column A and the balance or price in column B, starting in row 2.
- In C2 enter
=MAX($B$2:B2)and fill it down. This is the running peak. - In D2 enter
=B2/C2-1and fill it down. This is the drawdown at each row. - The maximum drawdown is
=MIN(D2:D1000), formatted as a percentage (adjust the range to your data).
To find the dates, use MATCH on the minimum in column D to get the trough row, then look back for the last row where column B equalled the running peak. If your balance includes deposits or withdrawals, convert it to returns first, because a deposit creates a fake peak and a withdrawal creates a fake drawdown.
Maximum Drawdown on 20 Years of E-mini Futures
The maximum drawdown on E-mini futures over the last 20 years came from the 2007 to 2009 financial crisis, but it was not the only deep fall. The table lists the largest distinct drawdowns on Yahoo Finance daily closes of the continuous front-month ES and NQ contracts, from October 31, 2006 to October 30, 2026. A distinct drawdown ends when the market closes at a new high.
| Market | Peak close | Trough close | Maximum drawdown | Back at the old high |
|---|---|---|---|---|
| ES | 1,576.25 on October 9, 2007 | 676.00 on March 9, 2009 | 57.1% | April 10, 2013 |
| ES | 3,387.25 on February 19, 2020 | 2,220.50 on March 23, 2020 | 34.4% | August 21, 2020 |
| ES | 4,786.00 on January 3, 2022 | 3,588.50 on October 12, 2022 | 25.0% | December 18, 2023 |
| ES | 2,943.00 on September 21, 2018 | 2,341.75 on December 24, 2018 | 20.4% | April 29, 2019 |
| ES | 6,163.00 on February 19, 2025 | 5,020.25 on April 8, 2025 | 18.5% | June 26, 2025 |
| NQ | 2,252.50 on October 31, 2007 | 1,039.50 on November 20, 2008 | 53.9% | January 5, 2011 |
| NQ | 16,575.00 on November 19, 2021 | 10,728.00 on November 3, 2022 | 35.3% | December 18, 2023 |
These are price-only figures on the unadjusted front-month series, so they include the small jumps at each quarterly roll and leave out dividends. They show the shape of a futures drawdown, not the return of any one held contract.
Two things stand out. Similar-looking drawdowns came from very different speeds: the 2020 fall on ES took 33 days, while the 2022 fall took 282 days to reach its low. And a market that ended the window at 5.5 times its starting close still spent most of the twenty years below an earlier high.
Maximum drawdown in points and dollars per contract
A futures trader feels drawdown in points and dollars, not only in percent. ES is worth $50 per index point and NQ is worth $20 per point, so the same episodes look different in money.
| Episode | Fall in percent | Fall in index points | Value per contract |
|---|---|---|---|
| ES 2007 to 2009 | 57.1% | 900.25 points | $45,012.50 |
| ES 2020 | 34.4% | 1,166.75 points | $58,337.50 |
| ES 2022 | 25.0% | 1,197.50 points | $59,875 |
| NQ 2007 to 2008 | 53.9% | 1,213 points | $24,260 |
| NQ 2020 | 28.2% | 2,749 points | $54,980 |
| NQ 2022 | 35.3% | 5,847 points | $116,940 |
The deepest percentage drawdown on ES was the smallest of the three in dollars per contract, because the index was far lower in 2008. That is why a percentage drawdown on a chart is not a risk budget. Your account loses dollars per contract held, and the dollar swing on one E-mini grows as the index climbs.
Drawdown Duration and the Cost of Recovery
Drawdown duration is the second half of the story, and it is the half most risk summaries leave out. Depth tells you how far you fell. Duration tells you how long you stayed down.
On ES, the 2007 to 2009 drawdown took 517 days to hit bottom and another 1,493 days to close back above its old high, 2,010 days in all. NQ fell for 386 days and recovered in 776. The 2020 fall on ES recovered 151 days after the low, while the shallower 2022 fall took 432 days.
Across the full twenty years of Yahoo Finance daily closes, ES spent 89.3% of sessions below a prior closing high and NQ spent 87.7%. A rising market is underwater most of the time. New highs are rare days, and a drawdown is the normal state between them.
That changes how a losing stretch should feel. Being below your last high is not a signal that something broke. It is the default. The useful question is whether the drawdown is deeper or longer than your own history says it should be.
Why a 50% drawdown is harder to recover than a 10% one
Recovery is harder than the fall because the gain is earned on a smaller base. Lose 10% and you have 90 left, so getting back to 100 needs 10 / 90 = 11.1%. Lose 50% and you have 50 left, so you need 100% just to break even.
The gain needed is 1 / (1 - drawdown) - 1.
| Drawdown | Gain needed to recover |
|---|---|
| 5% | 5.3% |
| 10% | 11.1% |
| 20% | 25.0% |
| 25% | 33.3% |
| 30% | 42.9% |
| 40% | 66.7% |
| 50% | 100.0% |
| 60% | 150.0% |
| 75% | 300.0% |
The 2007 to 2009 ES drawdown of 57.11% needed a 133.2% gain to repair. At a steady 10% a year, a 20% drawdown takes about 2.3 years to recover and a 50% drawdown about 7.3 years. Halve the depth and you cut the repair time by much more than half, which is the main reason risk managers care more about avoiding deep drawdowns than about squeezing out extra return.
The longest case on record makes the point. The S&P 500 index fell 86.19% from September 16, 1929 to June 1, 1932, needed a 624.1% gain to recover, and did not close above its 1929 high again until September 22, 1954.
Related lesson: Recovery factor and drawdown recovery
Maximum Drawdown Compared Across ES, NQ, Gold and the S&P 500
Comparing maximum drawdown across markets only works when the window, the data and the measurement match. The table uses the same twenty-year window (October 31, 2006 to October 30, 2026) and Yahoo Finance daily closes for each series.
| Series | Maximum drawdown | Peak to trough | Share of sessions underwater | Median five-year drawdown |
|---|---|---|---|---|
| E-mini S&P 500 (ES) | 57.1% | October 2007 to March 2009 | 89.3% | 25.0% |
| E-mini Nasdaq-100 (NQ) | 53.9% | October 2007 to November 2008 | 87.7% | 28.2% |
| S&P 500 index | 56.8% | October 2007 to March 2009 | 89.8% | 25.4% |
| Gold futures (GC) | 44.4% | August 2011 to December 2015 | 94.4% | 23.8% |
Gold had the smallest maximum drawdown of the four, yet spent the most time underwater. Its fall from 1,888.70 on August 22, 2011 to 1,050.80 on December 17, 2015 took 1,578 days, and it did not recover until July 23, 2020. As of October 30, 2026, gold futures were also in an open drawdown of 26.7% from their January 29, 2026 close of 5,318.40.
Factors that change the size of a maximum drawdown
Several factors decide how large a maximum drawdown looks, and most have nothing to do with skill.
- The measurement window. Splitting the Yahoo Finance ES daily series into 180 rolling five-year windows, the median worst drawdown was 25.0% and the mildest window still held a 14.3% fall. A strategy or market judged on a calm five years can look half as risky as its full history.
- The market regime. The worst drawdown inside a single calendar year on ES ranged from 48.7% in 2008 to 2.8% in 2017. Same contract, very different years.
- The asset class. Equity index futures fell hardest in a credit crisis, gold fell slowly over years, and crude oil behaves differently again.
- The data frequency. Daily closes hide intraday lows, and monthly data hides even more.
Crude oil shows where percentage drawdown breaks down entirely. The front-month CL contract closed at $145.29 on July 3, 2008 and settled at minus $37.63 on April 20, 2020. A fall below zero produces a percentage drawdown over 100% that stops meaning anything. For futures positions, measure drawdown on the account in dollars, not on the contract price in percent.
Maximum Drawdown in a Two-Market Portfolio
Maximum drawdown in a portfolio depends less on how many positions you hold than on whether they fall at the same time. To show it, the same daily data was combined into two simple portfolios, half in each market and rebalanced daily.
| Portfolio | Maximum drawdown | Annualized growth | Annualized volatility |
|---|---|---|---|
| ES alone | 57.1% | 8.9% | 19.7% |
| Gold alone | 44.4% | 9.8% | 18.4% |
| ES and gold, 50/50 | 33.2% | 10.3% | 13.7% |
| ES and NQ, 50/50 | 54.9% | 12.0% | 20.6% |
ES and gold together had a maximum drawdown of 33.2%, smaller than either market on its own, because their worst stretches came at different times. Their combined worst fall ran from March 18, 2008 to November 20, 2008 and was repaired by November 11, 2009.
ES and NQ together barely helped. The two indices fell together in 2008, so the combined drawdown of 54.9% sat close to each one alone. Holding two equity index contracts is closer to one larger position than to diversification.
For a portfolio, calculate maximum drawdown on the combined daily equity, not by averaging each position's maximum drawdown. Individual worst points rarely line up on the same day, and when they do line up, that day is the one that matters.
Maximum Drawdown vs Volatility and Other Risk Metrics
Maximum drawdown and volatility measure different things, and they can rank the same markets in a different order. Volatility (the standard deviation of returns) measures how much returns vary, up and down alike. Maximum drawdown measures only the single worst fall. Two related measures help fill the gap.
- Calmar-style ratio. Annualized growth divided by maximum drawdown. Higher means more return per unit of worst-case pain.
- Ulcer Index. The square root of the average squared drawdown across every day. It rewards curves that recover quickly and punishes long stretches underwater.
| Series | Volatility | Maximum drawdown | Calmar-style ratio | Ulcer Index |
|---|---|---|---|---|
| ES | 19.7% | 57.1% | 0.16 | 14.7 |
| NQ | 22.4% | 53.9% | 0.28 | 13.2 |
| Gold | 18.4% | 44.4% | 0.22 | 20.8 |
| ES and gold, 50/50 | 13.7% | 33.2% | 0.31 | 6.4 |
NQ was the most volatile series and still had a smaller maximum drawdown and a lower Ulcer Index than ES. Gold had the lowest volatility of the three single markets but the highest Ulcer Index, because it stayed underwater for years. No single number captures risk. Read maximum drawdown for depth, the Ulcer Index or time underwater for duration, and volatility for day-to-day noise.
Related lesson: Profit factor
What Counts as a Good Maximum Drawdown
A good maximum drawdown has no universal number. It depends on the asset, the window, the trade count and what the account has to survive. These benchmarks are more useful than a single threshold.
- Against the market's own history. For an equity index future, a 20% fall has happened several times in twenty years, and the median five-year worst drawdown on ES daily closes from 2006 to 2026 was 25.0%. A strategy holding ES long with a 10% drawdown over a short calm stretch has not yet been tested.
- Against a fair sample. In the simulation below, the same rules had a median maximum drawdown of 9.7% over 250 trades at 1% risk. If your backtest shows 4% over 60 trades, it is too short to tell you much.
- In R, not only in percent. Divide the drawdown by your risk per trade. A 10% drawdown at 1% risk is 10R, and that figure travels between account sizes and strategies.
- Against the hard limit. On a funded or evaluation account the only drawdown that matters is the one written in the rules. A good drawdown is one that leaves room under that limit for a normal bad streak.
The honest answer: a good maximum drawdown is one you sized for in advance and can sit through without rewriting your rules halfway down.
Using Maximum Drawdown to Size Positions
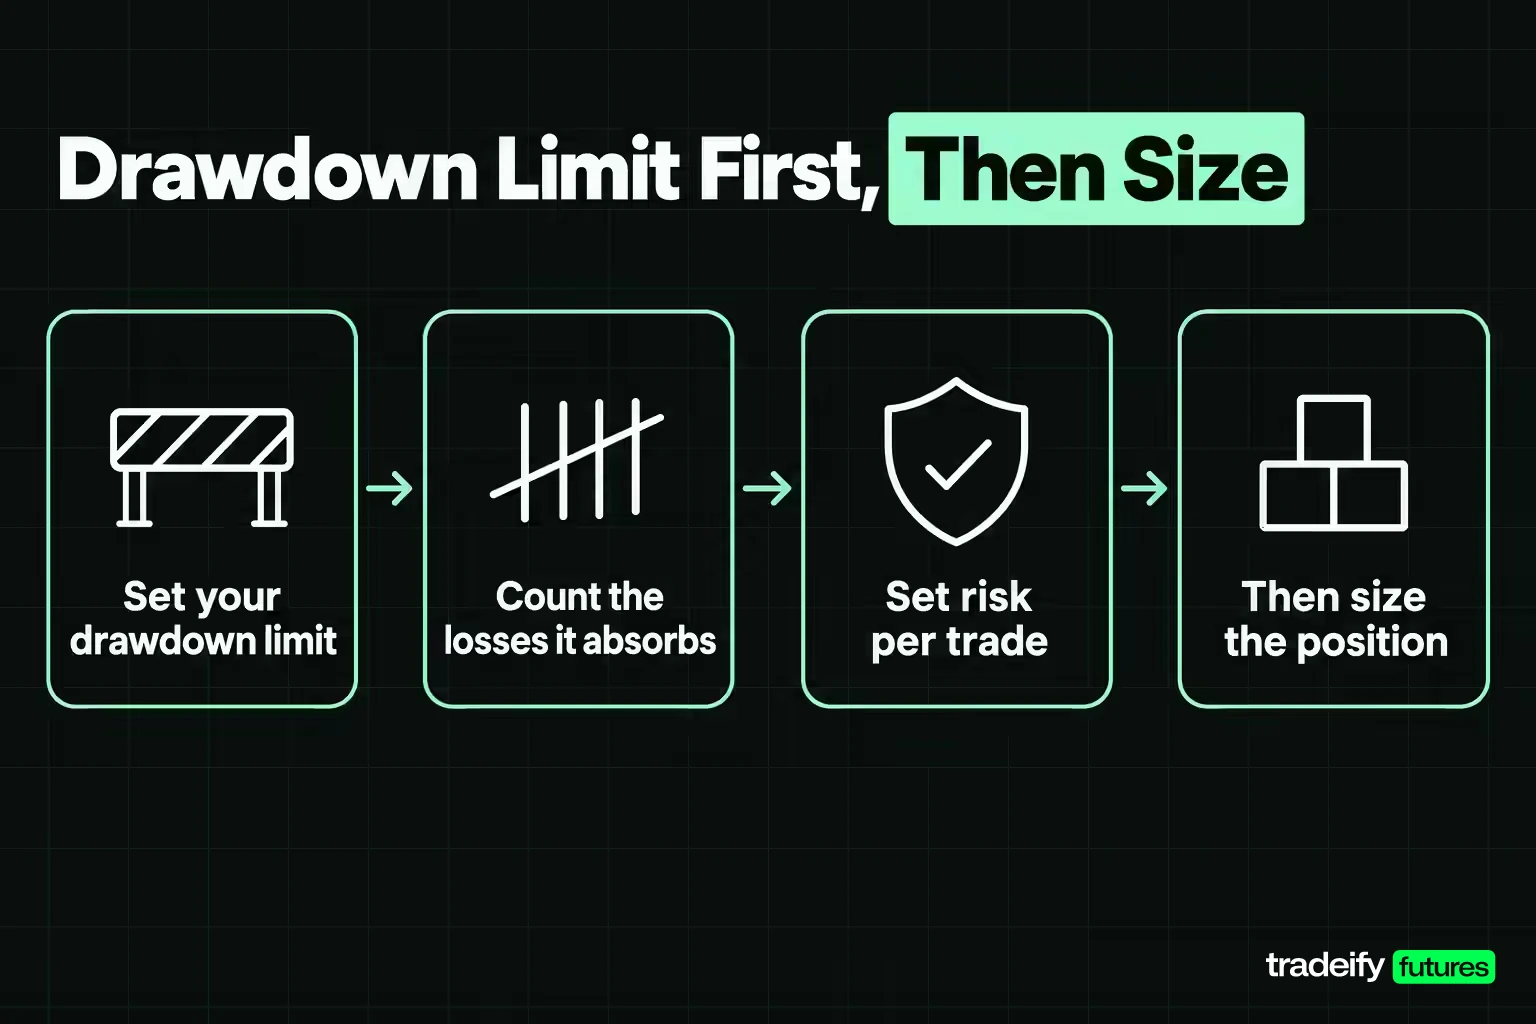
Maximum drawdown becomes a planning tool when you work backward from a limit to a risk per trade. The question is simple: how many full losses in a row can this limit absorb at this size?
Most traders ask it the other way round. They pick a size that feels right on a good day, then find out what the limit allows during a bad week. By then the answer costs money.
With a fixed percentage of current equity at risk, each loss is charged on a smaller balance, so the count is the largest whole number of losses that leaves the account above the limit.
| Drawdown limit | 0.25% risk per trade | 0.5% risk per trade | 1% risk per trade | 2% risk per trade |
|---|---|---|---|---|
| 3% | 12 losses | 6 losses | 3 losses | 1 loss |
| 4% | 16 losses | 8 losses | 4 losses | 2 losses |
| 6% | 24 losses | 12 losses | 6 losses | 3 losses |
| 10% | 42 losses | 21 losses | 10 losses | 5 losses |
| 20% | 89 losses | 44 losses | 22 losses | 11 losses |
A 10% limit at 1% risk survives ten straight losses, leaving a 9.6% drawdown, not the full 10%, because the last loss is charged on a smaller account.
A worked drawdown example on a $50,000 account
Imagine an illustrative $50,000 account that risks a fixed share of its balance and wins twice its risk on each winner.
| Risk per trade | Losing streak | Balance after the streak | Drawdown | 2R wins needed to recover |
|---|---|---|---|---|
| 1% | 6 losses | $47,074 | 5.9% | 4 |
| 1% | 12 losses | $44,319 | 11.4% | 7 |
| 2% | 6 losses | $44,292 | 11.4% | 4 |
| 2% | 12 losses | $39,236 | 21.5% | 7 |
Doubling the risk does not change how many losses happen. It roughly doubles the drawdown those losses produce. And the right-hand column is the part traders skip: those winning trades do not add to the result. They only undo the damage.
How often long losing streaks happen
Long losing streaks are more common than they feel. In a 20,000-run Monte Carlo simulation computed for this guide, with a strategy that wins 45% of the time, a run of 10 or more straight losses appeared within 250 trades in 24.5% of sequences. A run of 6 or more appeared within 100 trades in 73.4% of sequences. If your limit cannot absorb a streak that shows up three times in four, the size is too large for the limit.
Limitations of Maximum Drawdown
Maximum drawdown is useful, but it has real limitations as a risk measure.
- It is backward looking. It records the worst fall that has happened, not the worst that can happen. An ES history that ended in September 2007 could not have shown the 57.1% fall that started the next month.
- It is one observation. It is the worst point of a single path, so it is the noisiest statistic a strategy or market produces and the most sensitive to where the sample starts and ends.
- It ignores frequency. One 30% fall and three separate 10% falls can leave very different experiences, yet the first has the larger maximum drawdown and the second may hurt more.
- It ignores duration. Gold's 44.4% drawdown was shallower than ES's 57.1% but took nearly nine years from peak to recovery.
- It depends on the data. Closes, intraday lows, closed trades and open equity all give different numbers for the same account.
Short samples understate maximum drawdown
The most expensive limitation is that maximum drawdown grows with the number of trades in the sample. The same rules, run longer, keep finding worse sequences.
To measure it, a Monte Carlo simulation computed for this guide ran a strategy with a 45% win rate, a 2 to 1 payoff and 1% risk per trade (a positive expectancy of +0.35R per trade) 4,000 times at each sample length.
| Trades in the sample | Median maximum drawdown | 95th percentile maximum drawdown |
|---|---|---|
| 50 | 5.9% | 11.4% |
| 100 | 7.7% | 13.3% |
| 250 | 9.6% | 15.9% |
| 500 | 11.5% | 18.3% |
| 1,000 | 13.3% | 19.6% |
| 2,000 | 15.0% | 21.4% |
Same strategy, same edge, and the typical maximum drawdown is more than twice as deep over 2,000 trades as over 50. This is the trap a clean backtest sets. A 60-trade backtest with a small drawdown is not evidence of a small drawdown. It is evidence that 60 trades has not yet met a bad sequence. Plan around the number of trades you intend to take, not the number you have tested.
Risk per trade moves the figure almost in proportion. Over 250 trades, the median maximum drawdown was 2.5% at 0.25% risk, 4.9% at 0.5%, 9.7% at 1% and 18.7% at 2%, and the 95th percentile at 2% risk reached 30.1%.
Related lesson: Trading expectancy
Maximum Drawdown Rules on Funded and Evaluation Accounts
On a funded or evaluation account, max drawdown usually means a rule rather than a statistic. It is the loss limit that ends the account if equity touches it. The details matter more than the headline dollar figure.
- Static drawdown measures the limit from the starting balance, and the floor never moves.
- Intraday trailing drawdown moves the floor up with the highest equity reached, including open profit during the day.
- End-of-day trailing drawdown moves the floor up only with the highest end-of-day balance, so an open profit that disappears before the close does not raise it.
Some firms stop trailing once the account has gained enough, locking the floor in place. Always check which balance the limit is measured on and when it is checked.
A trailing limit is harder to survive than its percentage suggests, because every new high resets the measurement. Here is where traders usually get caught: a good run lifts the floor, confidence lifts the size, and the next ordinary losing streak now has less room and more contracts.
How often a trailing maximum drawdown limit is breached
A trailing maximum drawdown limit was tested with a Monte Carlo simulation computed for this guide: a 45% win rate, a 2 to 1 payoff, fixed-fraction risk and 20,000 runs per cell. The breach rate rose sharply with risk per trade.
| Trailing limit and risk per trade | Breached within 100 trades | Breached within 250 trades |
|---|---|---|
| 4% limit at 0.25% risk | 2.1% | 6.0% |
| 4% limit at 0.5% risk | 38.5% | 73.5% |
| 4% limit at 1% risk | 96.2% | 99.97% |
| 6% limit at 0.25% risk | 0.1% | 0.4% |
| 6% limit at 0.5% risk | 8.8% | 24.1% |
| 6% limit at 1% risk | 69.5% | 95.8% |
| 10% limit at 0.5% risk | 0.4% | 1.6% |
| 10% limit at 1% risk | 19.0% | 44.7% |
In that simulation, a strategy with a real positive edge still broke a 6% trailing limit in 69.5% of runs within 100 trades at 1% risk. At 0.5% risk, the same edge broke it in 8.8%. The edge did not change. The size did. That is the main lesson of maximum drawdown for funded traders: the limit sets your size, not the other way around.
On our accounts, every Tradeify account uses an end-of-day trailing drawdown that is enforced in real time on net liquidation value, and touching it fails the account. On Sim Funded accounts the floor locks at the starting balance plus $100: a 50K Growth funded account with a $2,000 drawdown locks at $50,100 once its end-of-day balance reaches $52,100. Drawdown never locks on evaluation accounts, and funded accounts are simulated.
Maximum Drawdown FAQ
What does drawdown risk mean?
Drawdown risk is the chance that an account or investment falls below an earlier peak, plus how far and how long it stays there. Maximum drawdown measures the worst case that actually happened over a chosen window. It is a record of past pain, not a ceiling on future losses.
How do you calculate maximum drawdown?
Track the running high of the equity curve, compute value divided by running high minus one at each point, and take the most negative result. In formula form it is (trough - peak) / peak, with the peak coming before the trough. An account that goes from $60,000 to $42,000 has a 30% maximum drawdown.
How do I calculate the maximum drawdown in Excel?
Put balances in column B, enter =MAX($B$2:B2) in column C for the running peak, and =B2/C2-1 in column D for each drawdown. Fill both down, then use =MIN on column D for the maximum drawdown. Convert deposits and withdrawals to returns first so they do not create false peaks.
Why is a 50% drawdown harder to recover than a 10% one?
The recovery gain is earned on a smaller balance. A 10% loss needs an 11.1% gain to get back, while a 50% loss needs a 100% gain. The required gain rises faster than the loss, which is why deep drawdowns can take years to repair.
What is the maximum drawdown of the S&P 500?
Since 1928, the S&P 500 index's maximum drawdown on daily closes was 86.2%, from September 1929 to June 1932, and it took until September 1954 to close above the 1929 high. Over the last 20 years the deepest fall was 56.8%, from October 9, 2007 to March 9, 2009.
What does max drawdown mean on a funded account?
On a funded or evaluation account, max drawdown is the loss limit that ends the account when equity touches it. It may be static, trailing intraday, or trailing on end-of-day balances, and some versions lock once the account has grown. Check which balance it is measured on before choosing your risk per trade.
Is a lower maximum drawdown always better?
Not on its own. A lower maximum drawdown measured over a short or calm sample can hide a much deeper one, and a strategy with a small drawdown and almost no return is not useful either. Compare drawdown with return, with time underwater, and over a sample long enough to include bad stretches.
Trading futures involves substantial risk of loss, and leverage means losses can exceed what you expect. The drawdown figures here describe historical price series and simulated trade sequences; they are not a forecast, and no position size or drawdown limit prevents losses. Evaluation and funded accounts are simulated. This article is education, not individual investment advice.


