




TL;DR: Recovery factor and drawdown recovery tell you whether your worst decline has been paid for and how long the climb back takes. Recovery factor is net profit divided by maximum drawdown, in the same unit. On 86 E-mini breakout trades it came out at 0.12, because a 9.43R drawdown dwarfed 1.11R of net profit. A 50% drawdown needs a 100% gain, so cap the depth with position size before you worry about the climb.
You are weeks into a drawdown, well under your equity high, and wondering whether the strategy is broken or just having a normal bad stretch. Recovery factor and drawdown recovery are the two numbers that help answer that. One asks whether the money a strategy made covers the worst hole it dug. The other asks how deep that hole was, what gain fills it, and how many trades the climb takes.
A formula and a threshold table only get you part of the way. This guide measures both numbers on a fully specified E-mini S&P 500 rule over 20 years of daily bars, then shows how position size, costs and sample length move the result. The record is not flattering. That is the useful part, because it shows what a weak recovery factor feels like from the inside.
What Recovery Factor and Drawdown Recovery Measure
Recovery factor is a ratio. Take the total net profit of a trade record and divide it by the maximum drawdown, the deepest fall from a running equity high to a later low. MetaTrader 5's strategy tester report defines it the same way, as the ratio of profit gained to maximum drawdown, and describes it as a measure of how much the strategy risked to make what it made.
A recovery factor of 2.0 means the record earned two dollars for every dollar of its worst decline. A recovery factor under 1.0 means the worst decline was larger than everything the record earned in total. The account has not yet paid for its own worst period.
Drawdown recovery is a distance and a duration. It asks what percentage gain returns the equity curve to the high it fell from, and how many trades or months that takes. The gain is pure arithmetic and depends only on the depth of the fall. The time depends on your edge, your bet size and whether the account compounds.
Three Choices That Change Recovery Factor
Three choices change both recovery factor and drawdown recovery, which is why two traders can quote the same strategy and disagree without either being wrong:
- The peak. The decline is measured from the running high, not from the starting balance. A record that climbs 40% and then falls 25% from that high has a 25% drawdown even though it is still up overall.
- The sample. Maximum drawdown is one observation, the single worst stretch. A short record has had fewer chances to produce a deep one, so recovery factor tends to look better on short samples.
- The unit. Net profit and drawdown must use the same unit. Dividing dollars by a percentage gives a number with no meaning. Use dollars over dollars, risk units over risk units, or percent over percent on the same curve.
The formula itself is short:
| Input | What to use | Common mistake |
|---|---|---|
| Net profit | Final equity minus starting equity, after commissions and slippage | Using gross profit before costs |
| Maximum drawdown | Largest fall from a running peak to a later trough | Measuring from the starting balance only |
| Recovery factor | Net profit divided by maximum drawdown | Mixing dollars with percentages |
Maximum Drawdown vs Current Drawdown
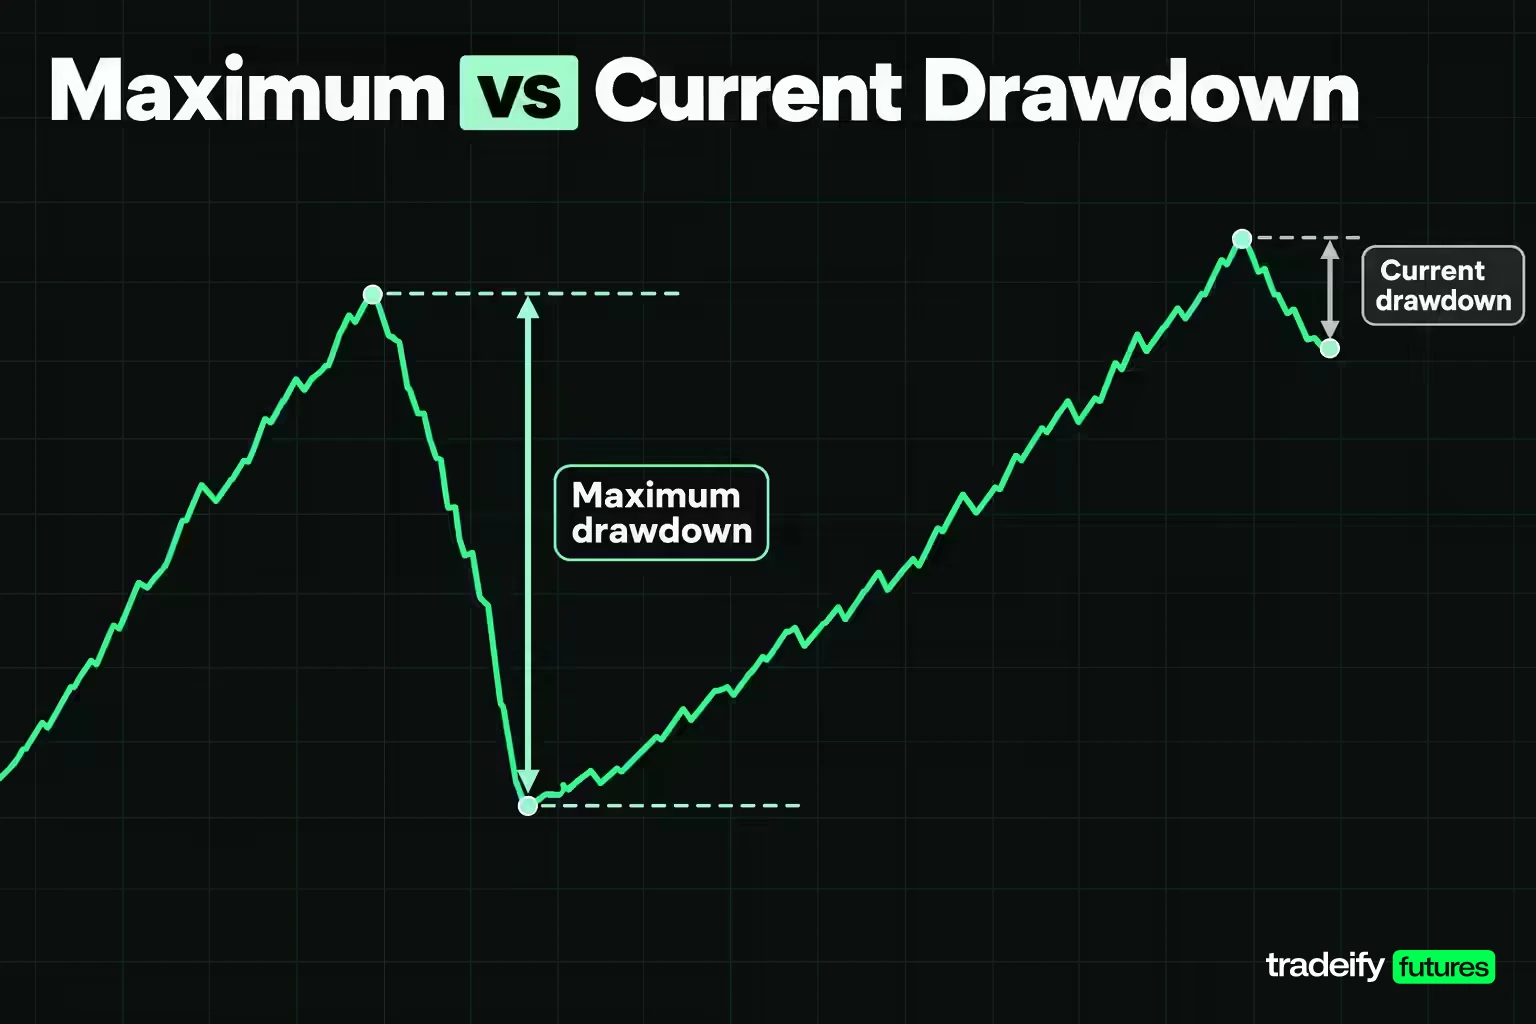
Maximum drawdown and current drawdown sound alike but answer different questions. Maximum drawdown is the worst peak-to-trough fall anywhere in the record. Current drawdown is how far the account sits under its highest point right now.
Maximum drawdown is the one that goes into the recovery factor. It tells you the worst thing the strategy has done so far, which is what you size against. Current drawdown tells you where you stand today, which is what you feel.
The 86-trade E-mini study on this page shows the difference. Its maximum drawdown, measured on closed trades after costs, was 9.43R (R is the dollar risk of one trade, the distance from entry to stop). That decline ran from a peak on June 5, 2013 to a trough on November 9, 2016. At the last exit in the record, on September 10, 2026, the account was 1.62R under a high set on November 19, 2025.
So on the last day of the record, a trader looking only at current drawdown would see a mild dip. A trader looking at maximum drawdown would see a strategy whose worst stretch was more than eight times its total net profit. Both are true. Track both, and do not let a small current drawdown talk you out of sizing for the maximum.
Two more definitions are worth keeping apart:
- Closed-trade drawdown counts only realised results. It is what most trade journals report.
- Open-equity drawdown includes unrealised swings while a trade is on. It is always at least as deep, and it is the one a real-time account limit watches.
Related lesson: Maximum drawdown
Drawdown Depth, Duration and Frequency
A drawdown has three dimensions, and a recovery factor only sees one of them. Depth is how far the equity fell. Duration is how long it stayed under the old high. Frequency is how often the account goes underwater at all.
The 86-trade E-mini study scores badly on duration, and that is the part most traders underestimate.
| Drawdown dimension | Measured on the 86 trades | What it means for the trader |
|---|---|---|
| Depth | Worst decline 9.43R | Sizing must survive at least this, and probably more |
| Duration | Worst episode lasted 51 trades and 4,550 calendar days from peak to new high | Years can pass with no new equity high |
| Frequency | 84 of 86 closed trades finished under a prior equity high | New highs were the exception, not the rule |
| Losing streak | Longest run of consecutive losers was 7 trades | Short streaks are not the main danger here, long grinds are |
The record made a new equity high on only two trades in nearly 20 years, which splits it into three underwater episodes. The first ran from the opening trade to trade 31 with a 9.35R deepest point. The second was the 9.43R maximum. The third began on November 19, 2025 and was still open at the end of the record, with a deepest point of 2.01R so far.
Depth gets the headlines. Duration is what breaks discipline, and it rarely shows up in a backtest summary. A strategy that spends most of its life under a previous high asks you to keep following the rule through long stretches where nothing looks like progress. If you only measure depth, you will not know to expect that.
Recovery Factor Measured on 86 E-mini Trades
The study behind the numbers on this page is an illustrative backtest, not a recommendation. It uses one rule, stated in full so you can rebuild it.
- Data. Front-month continuous E-mini S&P 500 futures (ES) daily bars from Yahoo Finance, 5,032 sessions from September 18, 2006 to September 16, 2026.
- Entry. A close beyond the highest high or lowest low of the previous 50 sessions signals a long or a short. Entry is the next session's open with one tick (0.25 points) of slippage against the position.
- Stop. 2.0 times the 14-session Wilder average true range from entry. If a session opens through the stop, the fill is the open.
- Exit. The first close beyond the opposite 20-session channel, filled at the next open with one tick of slippage, or after 250 sessions.
- Position. One trade at a time. 1R is the distance from entry to stop.
- Costs. $25 per round turn on one contract, two ticks at $12.50 each, charged against every trade.
Recovery Factor Results Before and After Costs
The 86-trade E-mini breakout rule took its 86 trades between December 6, 2006 and September 10, 2026 and won 38.37% of them. The average winner was 1.42R and the average loser 0.85R. The median stop was 57.71 points, or $2,885.59 of risk on one ES contract, where a $25 round turn costs 0.0087R.
| Measure | Before costs | After costs |
|---|---|---|
| Net result | 1.87R | 1.11R |
| Expectancy per trade | 0.0218R | 0.0130R |
| Maximum drawdown | 9.23R | 9.43R |
| Recovery factor | 0.20 | 0.12 |
Costs took 0.76R in total, 40.46% of what the trades earned before costs. They cut the net result by about 40% and nudged the drawdown deeper, so the recovery factor fell from 0.20 to 0.12.
Say that last number plainly. On this record, each dollar of worst-case decline was paid for with about 12 cents of net profit. Twenty years of trades have not come close to paying back the worst stretch, and no amount of reframing changes that.
The edge is also thin. An expectancy of 0.0130R per trade is close to nothing, and a recovery factor computed on a near-zero edge mostly describes the luck of one sequence. That is not a flaw in the study. It is what an honest recovery factor looks like for a lot of simple rules, and it is why the rest of this page tests how fragile the number is.
Drawdown Recovery Math and the Gain Needed to Break Even

Drawdown recovery math has one rule: the loss is charged against the bigger balance and the gain is earned on the smaller one. The percentage gain needed to get back to the old high is the drawdown divided by one minus the drawdown.
Lose 10% and 90 remains, so you need 10 divided by 90, an 11.11% gain. Lose 50% and the remaining 50 has to double, a 100% gain. Lose 75% and the remaining 25 has to grow fourfold, a 300% gain.
| Drawdown depth | Gain needed to recover | Gain needed as a multiple of the loss |
|---|---|---|
| 5% | 5.26% | 1.05 |
| 10% | 11.11% | 1.11 |
| 20% | 25.00% | 1.25 |
| 25% | 33.33% | 1.33 |
| 30% | 42.86% | 1.43 |
| 40% | 66.67% | 1.67 |
| 50% | 100.00% | 2.00 |
| 75% | 300.00% | 4.00 |
The gap stays small for shallow drawdowns and grows fast after 20% to 30%. That is the practical reason risk advice focuses on capping depth. A 10% hole is an inconvenience. A 50% hole needs the account to double, at the exact moment the trader trusts the strategy least.
A Worked Five-Trade Drawdown Recovery
This worked drawdown recovery example uses five trades built from the 86-trade E-mini study's average winner (1.4214R), average loser (0.8497R) and largest winner (4.9899R). It starts from an illustrative $50,000 account risking 1% of the current balance per trade.
| Trade | Result in R | Profit or loss | Balance after |
|---|---|---|---|
| 1 | +1.4214R | +$710.70 | $50,710.70 |
| 2 | -0.8497R | -$430.89 | $50,279.81 |
| 3 | -0.8497R | -$427.23 | $49,852.58 |
| 4 | -0.8497R | -$423.60 | $49,428.98 |
| 5 | +4.9899R | +$2,466.46 | $51,895.44 |
Every line checks on a calculator. Trade 1 is $50,000 times 1% times 1.4214, which is $710.70. Trade 2 is $50,710.70 times 1% times 0.8497.
The peak was $50,710.70 and the trough $49,428.98, a drawdown of $1,281.72, or 2.53% of the peak. Climbing back needed a 2.59% gain on the trough balance. Net profit at the end was $1,895.44, so the recovery factor of this short sequence is $1,895.44 divided by $1,281.72, or 1.48.
Two details matter. The three losses are identical in R but shrink in dollars, because each is charged against a smaller balance. And the recovery factor of 1.48 on five trades says nothing about the 0.12 the same rule produced over 86 trades. Short samples flatter the ratio.
How Long Drawdown Recovery Takes in Trades and Time
How long drawdown recovery takes depends on your edge, not only on the depth. The gain needed is fixed by arithmetic. The number of trades it takes is that gain divided by what each trade adds.
The two formulas, with g as the average growth per trade (expectancy in R times the fraction risked):
- Compounding, risking a fixed percentage of current equity: trades needed = ln(1 + gain needed) divided by ln(1 + g).
- Flat bet, risking a fixed dollar amount equal to 1% of the trough balance: trades needed = gain needed divided by g.
The 86-trade E-mini study had a net expectancy of 0.0130R per trade, or 0.012963R before rounding, which the table below uses. At 1% risk, that is roughly 0.013% growth per trade. Here is what that edge means for recovery time:
| Drawdown | Gain needed | Trades to recover, compounding at 1% risk | Trades, flat 1% of the trough balance | Trades at half the edge, compounding |
|---|---|---|---|---|
| 5% | 5.26% | 396 | 406 | 791 |
| 10% | 11.11% | 813 | 857 | 1,626 |
| 20% | 25.00% | 1,721 | 1,929 | 3,443 |
| 25% | 33.33% | 2,219 | 2,571 | 4,439 |
| 30% | 42.86% | 2,752 | 3,306 | 5,503 |
| 40% | 66.67% | 3,941 | 5,143 | 7,882 |
| 50% | 100.00% | 5,347 | 7,714 | 10,695 |
| 75% | 300.00% | 10,695 | 23,143 | 21,389 |
At this edge, a 50% drawdown takes over five thousand trades to repair. Halve the edge and every count roughly doubles. Recovery time is so sensitive to expectancy that a trader who does not know their expectancy cannot estimate recovery time at all.
The Worst Drawdown Recovery in the 86-Trade Study
The 86-trade E-mini study's own worst drawdown recovery makes the same point in calendar time. The fall took 18 trades and 1,253 days, from June 5, 2013 to November 9, 2016. The climb back to a new high took another 33 trades and 3,297 days, until November 19, 2025. That is about nine years to repair a decline that formed in under three and a half.
To estimate your own recovery time, convert trades to weeks with your real trade frequency. A strategy that takes three trades a week needs about 271 weeks to work through 813 trades.
Related lesson: Trading expectancy
Compounding, Position Size and Recovery Factor
Compounding changes the recovery factor more than most traders expect, because a drawdown shrinks the capital base the next bets are sized on. The same 86 trades give different recovery factors depending on how each trade is sized.
There are two common conventions:
- Fixed dollar risk bets the same amount on every trade. The equity curve is the R curve multiplied by a constant.
- Fixed fraction risk bets a percentage of the current balance. After a loss the next bet is smaller. After a win it is larger.
| Sizing on the 86 trades | Net return | Maximum drawdown | Recovery factor |
|---|---|---|---|
| Fixed $250 per trade on $50,000 | $278.70 | $2,356.66 (4.70%) | 0.1183 |
| Fixed $500 per trade on $50,000 | $557.41 | $4,713.32 (9.39%) | 0.1183 |
| Fixed $1,000 per trade on $50,000 | $1,114.82 | $9,426.63 (18.71%) | 0.1183 |
| 0.5% of current equity | 0.35% | 4.62% | 0.0752 |
| 1% of current equity | 0.28% | 9.05% | 0.0311 |
| 2% of current equity | -1.05% | 17.89% | -0.0588 |
| 5% of current equity | -13.19% | 42.36% | -0.3114 |
Fixed-Dollar vs Fixed-Fraction Recovery Factor
Under fixed dollar risk, the 86-trade study's recovery factor is 0.1183 at every bet size. Multiplying every trade by the same constant scales the profit and the drawdown together, so the ratio does not move. That makes the fixed-dollar figure the one that describes the rule itself.
Under fixed fraction risk the ratio falls as the bet grows, and at 2% it turns negative. The reason is compounding drag. When a curve swings hard, a percentage bet loses more on the way down than it wins back on the way up, because each loss shrinks the base the recovery is earned on. Same trades, same rule, opposite sign, purely from position size.
That is the shrinking capital base in action. A 2% bet after a 17.89% drawdown is a 2% bet on about 82% of the original account. The account needs the trades that would have repaired it at full size, and it gets them at reduced size.
There is a futures wrinkle too. The stop distance in the study varied widely, so a fixed fraction of equity implies a different number of contracts on nearly every trade. At the median stop of 57.71 points, one ES contract carries $2,885.59 of risk. Small accounts often cannot hit an exact fraction, which is one reason micro contracts exist.
Related lesson: Fixed-fractional position sizing
Risk Management Choices During a Drawdown Recovery

Risk management during a drawdown usually comes down to four choices: keep the same size, raise size to recover faster, cut size to survive, or stop trading at a set loss. The 86-trade E-mini study lets all four run on the identical trade sequence instead of being argued about.
Each policy starts at 100 with 2% of current equity at risk per trade. The trigger is a drawdown of 10% or more from the running peak. "Realised" is the one actual 86-trade sequence. The resampled columns rerun each policy on 4,000 random reorderings of the same trades, drawn with replacement, to show sequences that could have happened.
| Policy at 2% base risk | Realised return | Realised recovery factor | Resampled median recovery factor | Resampled runs ending negative | Resampled runs with drawdown over 25% |
|---|---|---|---|---|---|
| Constant 2% | -1.05% | -0.06 | -0.06 | 53.1% | 42.6% |
| Raise to 4% when 10%+ under the peak | +19.68% | 0.77 | 0.08 | 46.7% | 65.9% |
| Cut to 1% when 10%+ under the peak | -8.10% | -0.46 | -0.18 | 58.1% | 10.6% |
| Stop trading at 20% under the peak | -1.05% | -0.06 | -0.29 | 61.2% | 0.0% |
Three readings matter.
Raising size looked brilliant on the one real sequence, and that is the trap. It turned a 1.05% loss into a 19.68% gain. Across 4,000 resampled sequences, the median recovery factor was only 0.08, and 65.9% of runs suffered a drawdown deeper than 25%, against 42.6% at constant size. The real path rewarded the size increase. Most possible paths punished the account with a deeper hole.
Cutting size bought a smaller hole and a slower climb. Runs with a drawdown over 25% fell from 42.6% to 10.6%, but the share ending negative rose from 53.1% to 58.1%. Smaller bets during the drawdown also meant smaller bets on the trades that would have repaired it. That tradeoff is real, and most risk advice assumes it without stating it.
A hard stop removes the deep drawdowns and books the loss. No resampled run went past 25%, because 64.8% of runs hit the 20% stop and quit. That is also why 61.2% ended negative. A stopped account never gets the trades that would have repaired it.
Drawdown Risk Management Rules From the Test
The four-policy drawdown test on the 86 E-mini trades points to a few risk management rules. On a strategy with a real edge, the cost of cutting or stopping is lower and the protection is worth more. On a strategy with almost no edge, like this one, no sizing policy creates a good recovery factor. The practical rules that follow from the test:
- Size for the drawdown you have not had yet. Set risk per trade so that a drawdown deeper than your historical worst still fits inside your loss limit.
- Decide the response before the drawdown. Write down whether you cut size, at what depth, and when full size returns. Deciding in the middle of a losing run is how size creep happens.
- Use daily and total loss limits as hard stops, not targets. A limit you hit regularly is a sign your per-trade risk is too large.
- Never raise size to get back faster unless the rule was written and tested before the drawdown started. Raising size raises the chance of a much deeper hole.
Related lesson: Risk of ruin
Trading Psychology During Drawdown Recovery
Trading psychology during a drawdown recovery is mostly about time. A deep loss hurts once. A long stretch with no new equity high wears you down every week, and that is when traders start changing the rule.
In this guide's own 86-trade E-mini backtest, 84 of 86 trades closed under a prior equity high. Its worst recovery took 3,297 calendar days. Anyone trading a rule like that would have spent years wondering whether it had stopped working, and some of that doubt would have been justified, because the edge was thin.
The common reactions are easy to recognise:
- Revenge trading. Taking setups the rule did not give, to make the loss back faster. It adds trades with no measured edge, which lowers expectancy at the moment you need it most.
- Size creep. Adding a contract "just until I am back to even." In this guide's own resampling test on 86 E-mini breakout trades, raising size after a 10% drawdown raised the share of runs with a drawdown over 25% from 42.6% to 65.9%.
- Abandoning the rule at the bottom. Switching strategies right after the worst stretch locks in the drawdown and restarts the sample.
- Freezing after a loss. Skipping valid signals because the last few lost. The skipped trades are often the ones that would have done the repairing.
Precommitted Rules for a Drawdown Recovery
Each common drawdown reaction, from revenge trading and size creep to abandoning the rule or freezing, has a precommitted rule that works better than willpower:
- Write your drawdown response before you need it: the depth that triggers a size cut, the size you drop to, and the condition for going back.
- Judge the strategy on a sample you set in advance, such as the next 50 trades, not on how the last week felt.
- Compare the current drawdown with the resampled range for your record, not with your best month. A drawdown inside the range you tested is expected. One far outside it is evidence that something changed.
- Use your platform's daily loss lockout if it has one, so the decision to stop is made before the session gets emotional.
A clean loss does not call for revenge. It calls for the same risk plan on the next valid signal. And one rough month is not a verdict on a strategy, it is one line in the sample.
Related lesson: Recovering from a drawdown
Recovery Factor vs Profit Factor, Calmar and Sharpe
Recovery factor is one of several ratios that compare return with risk, and each one notices something the others miss. Here they are side by side on the same 86 E-mini trades after costs.
| Ratio | How it is calculated | Value on the 86 trades | What it sees | What it misses |
|---|---|---|---|---|
| Recovery factor | Net profit divided by maximum drawdown | 0.12 | Whether the worst decline was paid for | Duration, and every decline but the worst |
| Profit factor | Gross profit divided by gross loss | 1.02 | Size of wins against losses in total | Order of trades and drawdown depth |
| Calmar ratio | Average annual return divided by maximum drawdown | 0.0016 at 1% fixed-fraction risk | Return per unit of worst decline, per year | Anything before or after the measured window |
| Sharpe-style ratio per trade | Mean trade result divided by standard deviation of trade results | 0.0092 | Return per unit of total variability | Order of losses, so drawdowns are invisible |
| Sortino-style ratio per trade | Mean trade result divided by downside deviation | 0.0184 | Return per unit of downside variability | Clustering of losses into one long drawdown |
The Sharpe and Sortino figures here are per trade, with no risk-free rate and no annualising, so they are only comparable with other per-trade figures. The Calmar figure uses 0.0142% average annual growth over 19.76 years against a 9.05% maximum drawdown.
Recovery Factor vs Calmar Ratio and Profit Factor
Recovery factor and the Calmar ratio look alike. Investopedia describes the Calmar ratio as average annual return over maximum drawdown, conventionally over three years. Recovery factor uses total net profit, so it keeps growing the longer a profitable record runs, while Calmar is scaled per year. Comparing a recovery factor from a two-year record with one from a ten-year record is unfair to the shorter record.
Profit factor and recovery factor can disagree sharply. The study's profit factor of 1.02 says wins slightly outweighed losses in total. The recovery factor of 0.12 says those wins and losses arrived in an order that produced a decline more than eight times the profit. Profit factor cannot see order. Recovery factor is built on it.
Related lesson: Profit factor
Why Backtest Drawdowns Understate Live Drawdown Recovery
Backtest drawdowns tend to understate the drawdown you will meet live, because the historical maximum drawdown is only one draw from the many orderings the same trades could have arrived in.
The 86-trade E-mini study tests that directly. Resampling the 86 net trades 4,000 times, with replacement and in random order, gives the range of maximum drawdowns a trader with the same edge could have faced.
| Maximum drawdown measure | Value in R |
|---|---|
| Historical maximum drawdown | 9.43R |
| Median of 4,000 resampled records | 12.84R |
| 95th percentile of 4,000 resampled records | 25.08R |
| Share of resampled records deeper than history | 76.4% |
In 76.4% of this guide's resampled records, the maximum drawdown was deeper than the one history produced. The median was 12.84R, about a third deeper. One in twenty runs went past 25.08R, more than two and a half times the historical figure. The historical sequence happened to be on the gentle side of what these trades could do.
Live trading adds other gaps on top of sequence luck:
- Costs. In the study, costs cut the net result from 1.87R to 1.11R and deepened the drawdown from 9.23R to 9.43R. A backtest without commissions and slippage overstates the recovery factor.
- Fills. Stops can fill worse than the stop price in a fast market, and the study fills a gap-through at the open for exactly that reason.
- Fitting. A rule chosen because it had the best historical drawdown has been fitted to that history, so its live drawdown is likely to be worse.
- Behaviour. A backtest never skips a signal after three losses. A person often does, and the skipped trades are frequently the ones that end the drawdown.
The practical takeaway is to size for the resampled worst case, not the historical one. If your sizing only survives 9.43R and the plausible range runs to 25.08R, you are counting on getting lucky with the order of your trades.
What Counts as a Good Recovery Factor
What counts as a good recovery factor depends on how long the record is, which is the part the usual threshold tables leave out. Trading-journal glossaries commonly treat a recovery factor under 1.0 as poor or not yet recovered, 1.0 to 3.0 as acceptable or healthy, and 3.0 or more as good or strong. Those bands are a fair starting point. The problem is that the same strategy can land in every band depending on which window you measure.
The 86-trade E-mini study shows how far the ratio moves on one unchanged rule:
| Measurement window on the same 86 trades | Number of windows | Lowest recovery factor | Highest recovery factor | Windows at 3.0 or more | Windows under zero |
|---|---|---|---|---|---|
| Rolling 25 trades | 62 | -0.86 | 3.48 | 3 | 26 |
| Rolling 50 trades | 37 | -0.66 | 0.77 | 0 | 9 |
| Full 86 trades | 1 | 0.12 | 0.12 | 0 | 0 |
| 4,000 resampled 86-trade records | 4,000 | -0.90 at the 5th percentile | 3.13 at the 95th percentile | 5.4% | 47.8% |
Three of the 62 rolling 25-trade windows cleared 3.0. A trader who measured one of those windows would have called the strategy strong. Not one 50-trade window reached even 1.0. Across resampled records, the middle of the range sat at 0.06, and 47.8% came back negative.
Recovery Factor Stability Tests
A better test of a recovery factor than a fixed threshold is a set of questions:
- How many trades is the ratio built on? Under about 30, treat any recovery factor as a rough guess.
- Does it hold across windows? Compute it on rolling windows of your own record. If it swings from negative to over 3.0, the full-record figure is not stable enough to plan with.
- Does it survive resampling? If a large share of resampled records come back negative, the edge is not yet separated from luck.
- Is it after costs and on fixed-dollar sizing? That version describes the rule. A fixed-fraction figure also reflects how the account was sized.
On those tests the 86-trade study fails. That is the useful outcome. It shows how a strategy can look healthy over one window while its full record says otherwise.
Drawdown Recovery Under a Prop Firm Drawdown Limit
Drawdown recovery works differently when a hard drawdown limit sits under the account, as it does on most prop firm evaluations and funded accounts. Without a limit, a deep drawdown is a recovery-time problem. With a limit, a drawdown that reaches the line ends the account, so there is no recovery to measure.
That changes what recovery factor is for. You no longer ask whether you can climb back from your worst stretch. You ask whether your worst plausible stretch fits inside the limit with room to spare.
Here is the arithmetic with an illustrative $5,000 drawdown limit and the 86-trade E-mini study's resampled numbers:
- Sizing to the historical 9.43R maximum drawdown allows about $530 of risk per trade ($5,000 divided by 9.43).
- Sizing to the resampled 95th percentile of 25.08R allows about $199 of risk per trade ($5,000 divided by 25.08).
- At the study's median stop of 57.71 points, one ES contract risks $2,885.59 and one Micro E-mini S&P 500 (MES, $5 per index point) risks $288.56.
So even one micro contract at that stop is more than the resampled sizing allows. That is an uncomfortable answer, and it is better to get it from arithmetic than from a breached account. The rule would need a tighter stop, a different market, or acceptance of a higher chance of hitting the limit. That is the conversation a recovery factor should start on a limited account.
Trailing Drawdown and Recovery Room
A trailing drawdown limit adds one more wrinkle to drawdown recovery. If the limit follows your equity highs up, every new peak raises the floor, so the room you have to absorb the next drawdown is measured from the latest high, not from the starting balance.
On our accounts at Tradeify, drawdown is an end-of-day trailing drawdown enforced in real time on net liquidation value, and touching it fails the account. On Sim Funded accounts the floor stops trailing at the starting balance plus $100: a 50K Growth funded account with a $2,000 drawdown locks at $50,100 once its end-of-day balance reaches $52,100. Evaluation drawdowns never lock, and funded accounts are simulated.
A Recovery Factor Checklist for Your Own Equity Curve
A recovery factor is only as good as the record and the conventions behind it. These six steps turn your own trade history into a recovery factor and a drawdown recovery estimate you can act on.
- Fix the conventions first. Decide closed-trade or open-equity drawdown, a running peak or a fixed one, and costs included. Write them next to the number.
- Compute maximum drawdown in R as well as in dollars and percent. Divide the deepest fall by your normal risk per trade. A figure in R carries over to any account size.
- Compute the recovery factor on fixed-dollar sizing, after costs. That is the figure that describes the rule. If you size by a fixed fraction, compute that version too and note how far apart the two are.
- Turn depth into a gain and a trade count. Use the gain needed (depth divided by one minus depth) and your measured expectancy to estimate trades to recover, then convert trades to weeks at your real trade frequency.
- Check stability. Compute the ratio on rolling windows of 25 and 50 trades, and resample your trades a few thousand times. Note the median and the 95th percentile maximum drawdown.
- Size against the bad case. Set risk per trade so the resampled 95th percentile drawdown fits inside your loss limit, and write down your drawdown response before you need it.
Recovery Factor and Drawdown Recovery FAQ
How do you calculate the recovery factor?
Divide total net profit by the maximum drawdown, with both in the same unit. Walk the equity curve forward, track the highest value so far, and record the deepest fall under it. In the 86-trade E-mini study, net profit after costs was 1.11R and maximum drawdown 9.43R, a recovery factor of 0.12.
What is a good recovery factor?
Common threshold tables call under 1.0 poor, 1.0 to 3.0 acceptable and 3.0 or more good. The bands only mean something on a long record measured after costs. On one 86-trade rule, rolling 25-trade windows ranged from -0.86 to 3.48, so check stability before trusting any single figure.
Why is a 50% drawdown harder to recover than a 10% one?
The loss is taken from a larger balance than the gain is earned on. A 10% drawdown needs an 11.11% gain, while a 50% drawdown needs 100%. At an edge of 0.0130R per trade and 1% risk, that is about 813 trades against 5,347.
How long does drawdown recovery take?
Drawdown recovery takes the gain needed divided by what each trade adds, so expectancy and trade frequency matter as much as depth. Trades needed equal ln(1 + gain needed) divided by ln(1 + growth per trade) when you compound. In the 86-trade E-mini study, the worst drawdown took 33 trades and 3,297 calendar days to recover.
Does a smaller position size improve recovery factor?
Under fixed-fraction sizing it usually does, because smaller bets reduce compounding drag. In the 86-trade E-mini study, the ratio was 0.0752 at 0.5% risk and -0.3114 at 5%. Under fixed-dollar sizing the ratio does not change, because profit and drawdown scale together.
Is recovery factor the same as the Calmar ratio?
No. Both divide a return by maximum drawdown, but the Calmar ratio uses average annual return, usually over three years. Recovery factor uses total net profit, so it rises as a profitable record gets longer.
Futures trading involves substantial risk of loss, and leverage means losses can exceed what you expect or deposit. The study on this page is a historical backtest of one illustrative rule on E-mini S&P 500 data, with assumed costs and fills, and its results do not predict future performance. Evaluation and funded prop accounts are simulated, and results there may differ from live trading. This is educational content, not investment advice.


