



TL;DR: Trading expectancy is the average result per trade, and it tells you whether a rule pays over many trades. It equals win rate times average win minus loss rate times average loss, best measured in R. On 20 years of E-mini S&P 500 daily bars, a breakout rule returned 0.0218R per trade over 86 trades. Its 95% interval ran from -0.277R to +0.320R, so a positive number alone proved nothing. Publish the trade count, the interval and the costs next to any expectancy figure.
Trading expectancy is the average amount a trading rule makes or loses per trade. It is the number behind the question every trader asks after a hot week or an ugly one: is this setup actually working, or did the last few trades just feel like it was?
That question usually gets answered by mood. A green week says keep going, three red days say change something. Expectancy replaces the mood with a measurement, as long as you measure it properly.
This guide builds the idea from the ground up, covering the formula, R-multiples, win rate and risk-reward. Then it runs every piece on a real record: a fully specified breakout rule on 5,032 daily sessions of E-mini S&P 500 futures from September 18, 2006 to September 16, 2026. The record shows the parts most expectancy explanations skip: how wide the uncertainty really is, how a positive R figure can still lose dollars, and how much of a small edge costs eat.
What Trading Expectancy Means
Trading expectancy is the mean result of one trade across a defined sample of trades. You take every trade a rule produced, add up the results, and divide by the number of trades. The answer is in dollars per trade or in R per trade, where 1R is the amount you planned to risk.
It answers a question that win rate and total P&L cannot. Win rate tells you how often you are right. Total P&L tells you where the account ended up. Expectancy tells you what one more trade of the same kind has been worth on average, which is the number you need before deciding to keep taking that trade, size it up, or drop it.
Three properties are worth fixing in mind before any math:
- Expectancy describes a sample, not the next trade. A rule with positive expectancy loses on many individual trades and can lose for weeks. The figure is an average over the trades you measured.
- Expectancy belongs to one rule. Mix three setups in one spreadsheet and you get an average of three different expectancies that describes none of them.
- Expectancy is an estimate with error. The same rule measured over 20 trades and over 500 trades gives two different claims, and the smaller sample can be wrong by more than the size of any realistic edge.
A positive trading expectancy means the rule made money per trade in the sample. A negative one means it lost. A figure near zero means any edge is small enough that costs, slippage or a change in market conditions can erase it.
The Trading Expectancy Formula With a Worked Example
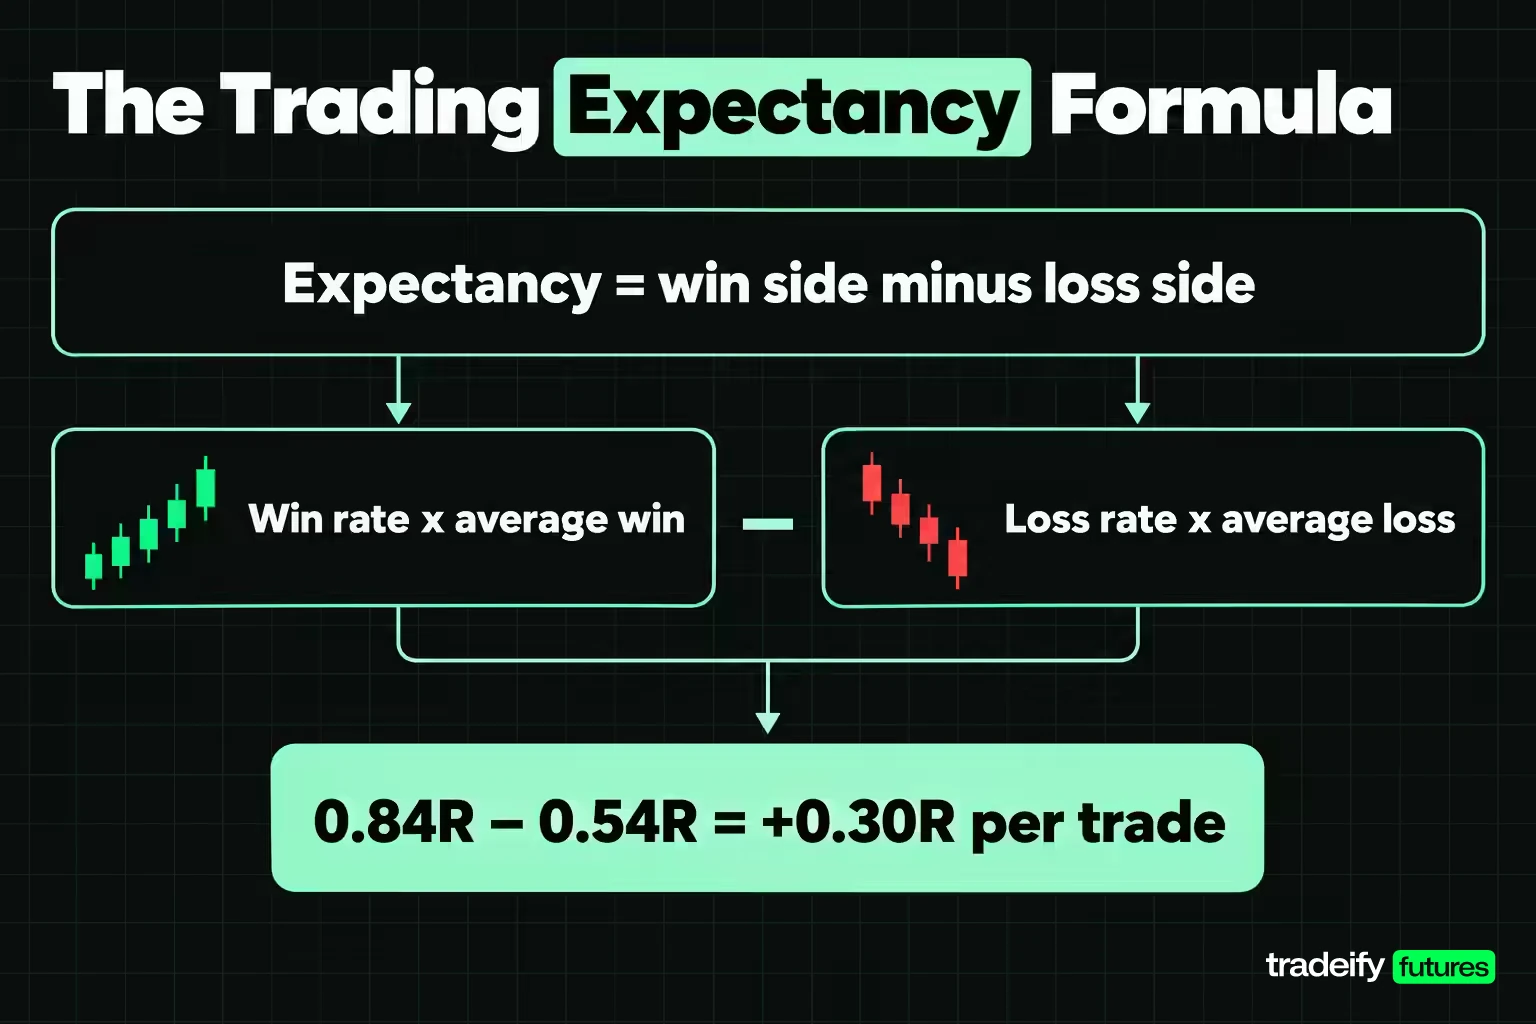
The trading expectancy formula has four inputs:
Expectancy = (win rate x average win) - (loss rate x average loss)
- Win rate is winning trades divided by all trades.
- Loss rate is losing trades divided by all trades. If you count every trade as a win or a loss, it is 1 minus the win rate.
- Average win is the total of winning trades divided by the number of winners.
- Average loss is the total of losing trades, as a positive number, divided by the number of losers.
There is a quicker route that gives the same answer: add up the result of every trade and divide by the number of trades. Use it as a cross-check. If the two methods disagree, a trade was miscounted, a scratch trade was classified two different ways, or a cost was left out of one side.
Worked expectancy example in R and in dollars
Take an illustrative record of 40 trades. Sixteen are winners averaging +2.1R and 24 are losers averaging -0.9R.
- Win rate is 16 / 40 = 40%. Loss rate is 60%.
- Winner side: 0.40 x 2.1R = 0.84R.
- Loser side: 0.60 x 0.9R = 0.54R.
- Expectancy: 0.84R - 0.54R = +0.30R per trade.
The cross-check agrees. The winners total 33.6R, the losers total -21.6R, so the record nets +12.0R, and 12.0R divided by 40 trades is 0.30R.
Now convert it to dollars. An E-mini S&P 500 (ES) contract moves $50 per index point, and a Micro E-mini S&P 500 (MES) contract moves $5 per point. With an illustrative 10-point stop, 1R is $500 on one ES contract and $50 on one MES contract. The same +0.30R expectancy is $150 per trade on ES and $15 per trade on MES, before costs. Over the 40 trades that is $6,000 on ES or $600 on MES.
The R figure is identical on both contracts, and only the dollar figure scales with size. That is why you compute expectancy in R first and convert to dollars second.
Measuring Expectancy in R-Multiples
An R-multiple is a trade's result divided by the risk you planned when you entered it. If you planned to risk 8 points and made 12, the trade was +1.5R. If you were stopped out at the planned stop, it was -1R. If you got out early for a 4-point loss, it was -0.5R.
R-multiples make trading expectancy comparable across instruments, contract sizes and account sizes. A +0.30R expectancy means the same thing on ES, on crude oil or on a currency future, and whether the trader runs one micro or ten minis. A dollar expectancy does not travel that way.
Three rules keep R honest:
- Define 1R at entry, from the planned stop. If you move the stop later, the original distance still defines 1R, because that is the risk you accepted.
- Record the realized R, not the planned outcome. A trade planned for +3R that you closed at +1.2R counts as +1.2R.
- Never let 1R be zero. A trade entered without a stop has no R, and averaging it in as 1R hides the risk that was really taken.
The payoff-ratio shortcut and its hidden assumption
Many expectancy calculators use a shortcut: expectancy = win rate x payoff ratio - loss rate, where the payoff ratio is average win divided by average loss. That form is only exact when the average loss is exactly 1R.
Real rules often lose less than 1R on average, because some losers exit before the stop on an exit signal. In an 86-trade E-mini S&P 500 breakout record measured over 20 years of daily bars, the average loss was 0.850R and the payoff ratio was 1.673. The shortcut gives 0.0256R per trade. The full formula gives 0.0218R. The shortcut overstated this rule's expectancy by 17.7%, and the error always runs in the flattering direction when losses average less than 1R. To fix the shortcut, multiply its answer by the average loss in R.
Why Win Rate Alone Misleads About Expectancy
When traders judge a strategy, win rate feels like the obvious score, and it is the number most traders quote first. It is only half of the story. Trading expectancy depends on win rate and on how big the winners are relative to the losers, and the second part can overwhelm the first.
The grid shows expectancy in R per trade for a range of win rates and payoff ratios (average win divided by average loss), with the average loss set at 1R.
| Win rate | Payoff 0.5 | Payoff 1.0 | Payoff 1.5 | Payoff 2.0 | Payoff 3.0 |
|---|---|---|---|---|---|
| 20% | -0.70R | -0.60R | -0.50R | -0.40R | -0.20R |
| 30% | -0.55R | -0.40R | -0.25R | -0.10R | +0.20R |
| 40% | -0.40R | -0.20R | 0.00R | +0.20R | +0.60R |
| 50% | -0.25R | 0.00R | +0.25R | +0.50R | +1.00R |
| 60% | -0.10R | +0.20R | +0.50R | +0.80R | +1.40R |
| 70% | +0.05R | +0.40R | +0.75R | +1.10R | +1.80R |
Read across the 60% row. A trader who wins six times out of ten loses 0.10R per trade if winners are half the size of losers. Now read down the payoff 3.0 column. A trader who wins only three times in ten makes +0.20R per trade.
The trap is psychological as much as mathematical. A high win rate feels safe because most days end green, so it is easy to stop looking at how big the losers are. Often the high win rate exists because losers are held and winners are cut early, which is exactly what drags the payoff ratio below 1. A low win rate feels like failure even when the math works, which tempts traders to tighten targets and wreck the payoff ratio that was carrying the expectancy.
Related lesson: Win rate vs payoff ratio
Risk-Reward Ratio and the Breakeven Win Rate
The risk-reward ratio is the planned reward on a trade divided by its planned risk. A trade with a 6-point stop and a 12-point target has a planned risk-reward of 1:2, or a reward-to-risk of 2.0.
The planned ratio is not the number that sets trading expectancy. The realized payoff ratio is. Targets get hit less often than stops, some trades are closed early, and some stops slip. A trader who plans every trade at 1:2 but closes half the winners early at +1R might realize a payoff ratio nearer 1.5, and the breakeven point moves with it.
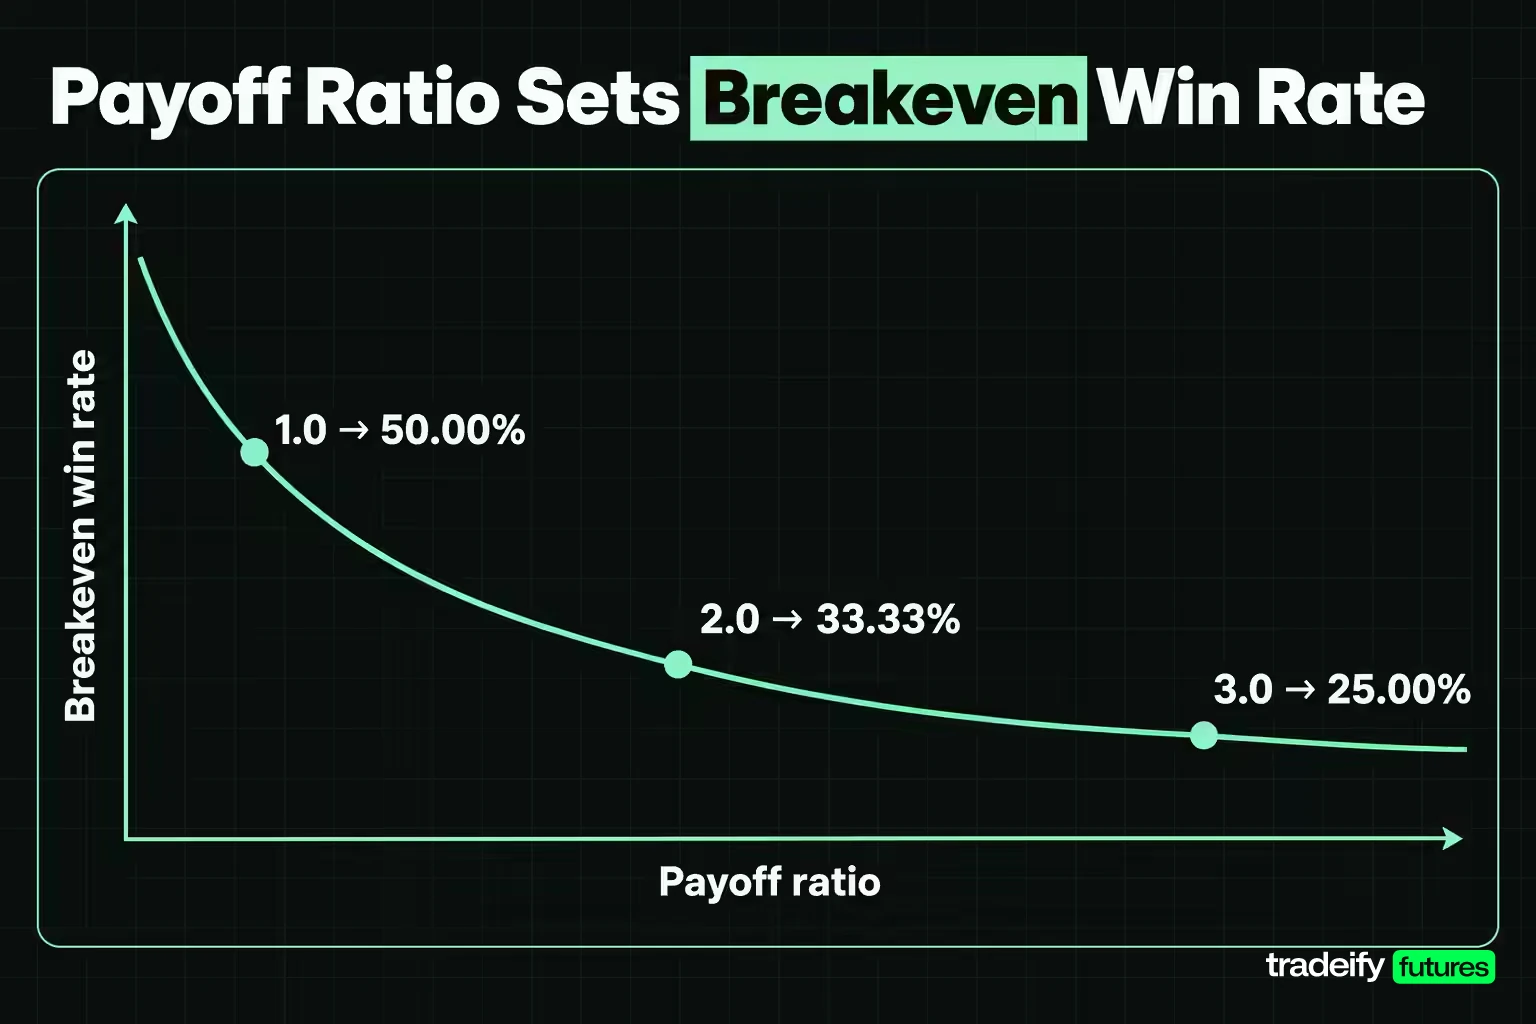
The breakeven win rate is the win rate at which expectancy is zero for a given payoff ratio. It is 1 / (1 + payoff ratio).
| Payoff ratio | Breakeven win rate |
|---|---|
| 0.5 | 66.67% |
| 1.0 | 50.00% |
| 1.5 | 40.00% |
| 2.0 | 33.33% |
| 3.0 | 25.00% |
| 4.0 | 20.00% |
Use the table both ways. If your realized payoff is 1.5, you need to win more than 40% of trades before costs just to break even. If your win rate is 35%, your realized payoff ratio has to be above about 1.86 (since 1 / 0.35 - 1 = 1.857) for the expectancy to turn positive. Commissions and slippage push both thresholds a little further out, because they come off every trade, winners and losers alike.
Related lesson: Risk-reward ratio
A 20-Year E-mini Breakout Test of Trading Expectancy
Illustrative examples are fine for the arithmetic, but they hide what a real expectancy figure looks like: noisy, dependent on a few trades, and wrapped in uncertainty. This trading expectancy study measures one fully specified rule on two decades of E-mini S&P 500 daily bars and reports everything, including the parts that make the result look weaker.
How the breakout rule was tested
The data are continuous front-month E-mini S&P 500 futures daily bars from Yahoo Finance (symbol ES=F): 5,032 complete sessions from September 18, 2006 to September 16, 2026. The continuous series splices contract months without back-adjustment, so a roll can create a small artificial gap. That is a limitation worth stating, and it affects any study built on unadjusted continuous data.
The rule:
- Signal. A daily close above the highest high of the previous 50 sessions is a long signal. A close below the lowest low of the previous 50 sessions is a short signal.
- Entry. The next session's open, with one tick (0.25 index points) of slippage against the trade.
- Stop. 2.0 times the 14-session Average True Range (Wilder's smoothing), measured on the signal bar. That distance is 1R.
- Exits, in order. A session that opens beyond the stop fills at the open. A session that touches the stop fills at the stop. A close beyond the opposite 20-session extreme exits at the next open with one tick of slippage. A 250-session cap closes any trade still open.
- One position at a time. Signals that arrive while a trade is open are ignored.
- Dollars. $50 per index point and $12.50 per tick, one contract per trade.
Related lesson: Average true range ATR
What the 86 trades returned
| Measure | Result |
|---|---|
| Trades | 86 (33 winners, 53 losers) |
| Win rate | 38.37% |
| Average win | 1.421R |
| Average loss | 0.850R |
| Expectancy | 0.0218R per trade |
| Standard deviation | 1.412R per trade |
| 95% interval for expectancy | -0.277R to +0.320R |
| Total | +1.87R |
| Profit factor | 1.042 |
| One contract per trade | $245.52 per trade, $21,114.96 in total |
| Fixed $1,000 risk per trade | $21.77 per trade, $1,872.41 in total |
| Average holding time | 35.6 sessions (longest 130) |
The headline is a positive expectancy. The interval is the real finding, and it is less flattering. It spans zero by a wide margin, which means this record is consistent with a small edge, with no edge, and with a small negative one. A trader who saw only "+0.0218R per trade" and "$21,114.96 profit" would come away with far more confidence than the data support.
Where the E-mini breakout expectancy came from
Four breakdowns explain the 0.0218R trading expectancy of the 50-session E-mini breakout rule.
Exits. 33 trades hit the stop at exactly -1R. 52 trades exited on the 20-session channel signal, averaging +0.698R. One trade, signaled June 14, 2021, opened through its stop and filled at -1.425R. That single gap is why the worst loss is bigger than 1R, and the channel exits that closed small losers early are why the average loss sits under 1R.
The tail. The ten largest winners produced 32.34R, which is 68.95% of the 46.91R that all 33 winners produced. Remove those ten trades and the record totals -30.47R. The largest single winner, signaled November 20, 2023, made +4.990R. A rule whose whole expectancy rests on ten trades in 20 years is fragile: miss two or three of them through hesitation, a platform problem or a skipped day, and the expectancy turns negative.
Direction. The 52 long trades won 50.00% of the time and averaged +0.388R. The 34 short trades won 20.59% of the time and averaged -0.538R. The index rose from a close of 1,334.25 on the first session to 7,556.50 on the last, so the long side had the drift behind it. The blended +0.0218R hides one profitable half and one losing half.
Decade. Trades entered in the first ten years (48 trades) averaged -0.155R. Trades entered in the last ten years (38 trades) averaged +0.246R. The same rule, with no changes, spent a decade losing before it spent a decade winning. A trader who measured it in 2016 and one who measured it in 2026 would have reached opposite conclusions.
Checking the expectancy against random entries
A positive expectancy only means something if a rule without the signal does worse. Three controls test that.
Random entries. Eight random-entry runs used the same 5,032 sessions, the same stop, the same exits and the same one-position rule. Each run picked entry days at random at the same rate the breakout signal fires (558 signal days out of 4,981 eligible, about 11.2%) and picked the direction at random, using a fixed hash of the session date so any run can be rebuilt exactly. The eight runs produced between 127 and 158 trades each and expectancies from -0.306R to +0.047R, with a mean of -0.065R. The real signal's +0.0218R beat seven of the eight. That leans in the signal's favor, but eight runs are a small control set, and the best random run still beat the real one.
Reversed direction. Taking the opposite side on every breakout day, with the same stops, exits and one-position rule, produced 221 trades at -0.152R per trade. The signal direction mattered.
Overlapping signals. Allowing a new trade on every signal day, even while earlier trades were open, produced 558 trades at -0.210R, with an interval of -0.322R to -0.098R. The only change was the one-position rule, and it flipped the sign. A small definitional choice in how the sample is built can matter more than the signal itself.
Read together, the study says something more useful than "positive" or "negative". The rule shows a faint, unstable edge, concentrated in long trades, in the second decade and in a handful of large winners. That is a common profile for a single rule on a single market, and it is exactly the profile a bare expectancy figure conceals.
How Many Trades Trading Expectancy Needs
Every trading expectancy figure carries a margin of error, and that margin shrinks slowly. The 95% interval is roughly the expectancy plus or minus 1.96 standard deviations divided by the square root of the trade count. Using the study's standard deviation of 1.412R per trade and its 0.0218R expectancy, the interval at different sample sizes looks like this:
| Trades in sample | 95% interval | Interval width | Excludes zero |
|---|---|---|---|
| 20 | -0.597R to +0.641R | 1.238R | No |
| 30 | -0.483R to +0.527R | 1.010R | No |
| 50 | -0.370R to +0.413R | 0.783R | No |
| 100 | -0.255R to +0.299R | 0.553R | No |
| 250 | -0.153R to +0.197R | 0.350R | No |
| 500 | -0.102R to +0.146R | 0.248R | No |
| 1,000 | -0.066R to +0.109R | 0.175R | No |
At 20 trades the interval is wider than any realistic edge. At 1,000 trades it still includes zero for an edge this small. You can invert the same formula to estimate how many trades it takes for the interval to clear zero at a given edge, assuming a standard deviation of 1.412R:
- An edge of 0.0218R needs about 16,156 trades.
- An edge of 0.05R needs about 3,064 trades.
- An edge of 0.10R needs about 766 trades.
- An edge of 0.25R needs about 123 trades.
The common advice that 30 to 50 trades is a minimum is a starting point for noticing a problem, not a standard of proof. The bigger the edge and the smaller the spread of outcomes, the fewer trades you need. A tight, consistent scalping rule with small R outcomes narrows faster than a trend rule with rare large winners.
How the E-mini study's expectancy swung on small samples
The 50-session E-mini breakout rule, tested over 20 years of daily bars, printed -0.846R over its first 10 trades, -0.261R over its first 20 and -0.112R over its first 50, before ending at +0.0218R over all 86. Across the 57 overlapping 30-trade windows in the record, 18 were negative, the worst at -0.172R and the best at +0.259R.
That is the practical reason not to abandon a rule after 20 bad trades, and equally not to size up after 20 good ones. Both reactions are answers to noise. Keep the trade count next to the figure wherever you record it.
Expectancy in R Versus Expectancy in Dollars
R expectancy and dollar expectancy are only interchangeable when every trade risks the same number of dollars. When the stop is set by volatility, as with an ATR stop, the dollars behind 1R change from trade to trade, and the two figures can disagree, even in sign.
In the 20-year E-mini breakout study, one contract's stop ranged from $1,648 at the 5th percentile to $10,644 at the 95th, a 6.46-fold spread. Winners carried an average stop of $4,366 and losers $3,931. The index level also rose more than fivefold over the 20 years, so the average stop was $2,296 on trades entered in the first decade and $6,374 in the second. One-contract dollar results are dominated by recent, high-priced trades.
Twelve breakout variants measured in R and in dollars
The grid runs the same E-mini S&P 500 breakout rule with four breakout lookbacks and three stop multiples over the same 20 years. Each cell reports both units for the identical set of trades.
| Breakout lookback | Stop multiple | Trades | Win rate | Expectancy in R | Expectancy per contract |
|---|---|---|---|---|---|
| 20 sessions | 1.0 x ATR | 152 | 24.34% | -0.0067R | +$159.58 |
| 20 sessions | 2.0 x ATR | 106 | 39.62% | +0.0942R | +$535.07 |
| 20 sessions | 3.0 x ATR | 99 | 42.42% | +0.0171R | +$428.78 |
| 50 sessions | 1.0 x ATR | 116 | 25.00% | -0.0012R | -$173.56 |
| 50 sessions | 2.0 x ATR | 86 | 38.37% | +0.0218R | +$245.52 |
| 50 sessions | 3.0 x ATR | 82 | 40.24% | -0.0273R | -$72.06 |
| 100 sessions | 1.0 x ATR | 84 | 29.76% | +0.1395R | -$202.60 |
| 100 sessions | 2.0 x ATR | 65 | 43.08% | +0.1282R | +$39.96 |
| 100 sessions | 3.0 x ATR | 63 | 44.44% | +0.0420R | -$197.86 |
| 200 sessions | 1.0 x ATR | 75 | 25.33% | +0.0402R | -$91.72 |
| 200 sessions | 2.0 x ATR | 54 | 42.59% | +0.1141R | -$75.84 |
| 200 sessions | 3.0 x ATR | 51 | 45.10% | +0.0611R | -$344.68 |
Six of the 12 cells disagree in sign. Five are profitable in R and lose money on one contract per trade. One loses in R and makes money per contract. The 100-session, 1.0 x ATR rule has the best R expectancy in the grid at +0.1395R and still lost $202.60 per contract per trade, because its losing trades carried larger stops on average ($2,456 per contract against $1,935 for its winners).
Sizing to a fixed risk makes R and dollars agree
If you size every trade to the same dollar risk, dollar expectancy becomes R expectancy times that risk, by construction. The 86 trades of the 50-session E-mini breakout rule at a fixed $1,000 of risk average $21.77 per trade, which is 0.0218R x $1,000. At one contract per trade the same trades average $245.52.
Neither figure is wrong. They answer different questions, and a page or a journal that shows only one of them is telling you half of the result. The R figure says whether the rule has an edge per unit of risk. The one-contract figure says what happened to a trader who ignored volatility when sizing. In practice, sizing by risk means rounding to whole contracts, which is one reason micro contracts exist: at $5 per point, MES lets a trader get much closer to a fixed dollar risk than ES at $50 per point.
Related lesson: Volatility-based position sizing
Transaction Costs and Net Expectancy
Gross trading expectancy is not what reaches the account. Commissions, exchange fees and slippage come off every trade, and they are charged in dollars, not in R, so their weight depends on how many dollars 1R is.
In the 20-year E-mini breakout study (86 trades, 2.0 x ATR stops), one tick of slippage at entry and at every channel exit is already inside its 0.0218R trading expectancy. Priced separately:
- Before any slippage the rule earned 0.0287R per trade.
- Slippage averaged 0.0070R per trade.
- An illustrative $5 round-turn commission adds 0.0018R per trade, because the median stop was 57.71 points, or about $2,886 per contract.
- Net expectancy after both is about 0.0200R per trade, so costs took roughly 30% of the pre-cost edge.
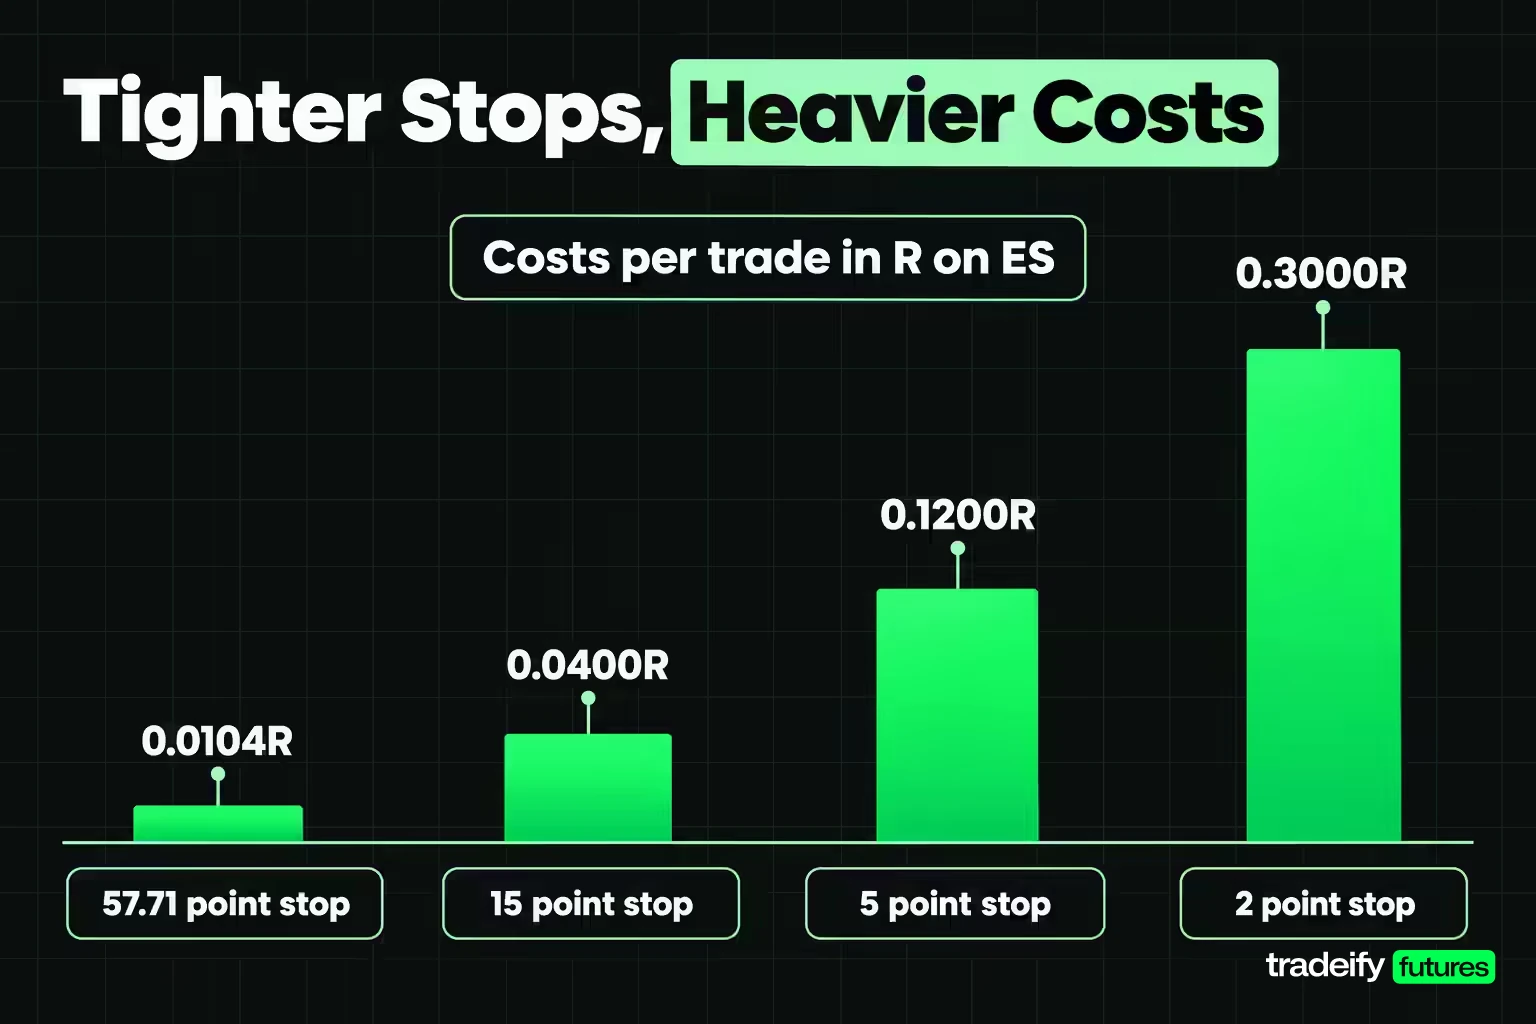
That is on a daily rule with wide stops, where one tick is only 0.43% of the median 1R. Intraday traders use much tighter stops, and the same costs then become a large share of 1R. The table uses ES with two ticks of round-trip slippage (0.50 points) and the same illustrative $5 commission.
| ES stop distance | 1R on one contract | Slippage in R | Commission in R | Total cost in R |
|---|---|---|---|---|
| 57.71 points (study median) | $2,886 | 0.0087R | 0.0017R | 0.0104R |
| 15 points | $750 | 0.0333R | 0.0067R | 0.0400R |
| 5 points | $250 | 0.1000R | 0.0200R | 0.1200R |
| 2 points | $100 | 0.2500R | 0.0500R | 0.3000R |
A scalping rule with a 2-point stop needs +0.30R of gross expectancy just to cover these costs. At a 1.5 payoff ratio the breakeven win rate is 40.00% before costs, and it climbs once costs come off every trade. If you measure expectancy from a broker or platform report, check whether the P&L is gross or net of commissions before you trust it.
Related lesson: Commission adjusted futures breakeven
Tracking Trading Expectancy in a Journal
A journal is where trading expectancy stops being a formula and becomes a measurement. The goal is to record enough per trade that you can compute expectancy in R, in dollars, before and after costs, and for any slice of your trading.
Record these fields for every trade:
| Field | Why expectancy needs it |
|---|---|
| Setup tag | Lets you compute expectancy per setup instead of a blend |
| Instrument and contract size | Converts points to dollars |
| Direction | Long and short trades can have opposite expectancies |
| Entry time | Lets you group by session or hour |
| Planned stop distance at entry | Defines 1R |
| Exit price and reason | Separates stop exits, target exits and early exits |
| Gross P&L | Measures the rule before costs |
| Commissions, fees and slippage | Turns gross into net expectancy |
| Realized R | The unit you average |
Steps to compute trading expectancy from a journal
Compute it the same way every time:
- Pick one setup and a fixed period. Write down what qualifies a trade for the sample.
- Compute each trade's realized R from the planned stop at entry.
- Compute win rate, average win and average loss in R, then the expectancy, and cross-check it against total R divided by trade count.
- Compute the standard deviation of the per-trade R results and the 95% interval.
- Convert to dollars at your actual size, net of costs.
- Group the trades by one variable at a time, such as direction, session or time of day, and recompute the expectancy for each group.
- Recheck the figure on the next block of trades rather than rereading the old one.
Grouping by time is how a journal answers "what is the best time of day to trade" for you specifically. No universal hour is best. Your expectancy by hour, with the trade count beside it, is the honest version of that answer.
Related lesson: How to keep a trading journal
Common Expectancy Mistakes
Most trading expectancy errors make the number look better than it is, which is exactly why they survive. Each one has a cheap check.
| Mistake | What it does to expectancy | The check |
|---|---|---|
| Assuming the average loss is 1R | Overstates expectancy when losses average under 1R | Compute the average loss in R from the record |
| Blending several setups | One strong setup hides losing ones | Compute expectancy per setup tag |
| Trusting a small sample | A 20-trade figure can be wrong by more than any edge | Report the trade count and the 95% interval |
| Using gross P&L | Costs can take a large share of a small edge | Compute net expectancy per trade |
| Ignoring the tail | A few large winners can carry the whole result | Recompute with the top ten winners removed |
| Mixing R and dollars | Positive R can lose money at a fixed contract size | Report both, and state how trades were sized |
| Treating backtest expectancy as live | Fills, hesitation and missed trades are absent from a backtest | Compare live and backtest expectancy on the same rule |
Profit factor is not expectancy
Profit factor is gross profit divided by gross loss. It tells you how many dollars or R of profit the rule made for each one it lost, but it says nothing about how often trades happen or how much each one earns. The 20-year E-mini breakout study's profit factor of 1.042 and its expectancy of 0.0218R describe the same thin edge in two ways. Expectancy is the more useful figure for sizing and for estimating drawdown, because it is per trade and it has a standard deviation you can build an interval from.
Related lesson: Profit factor
Backtested and live expectancy differ
A backtest assumes you took every trade, at the modeled price, with no hesitation. Live trading adds worse fills on fast moves, skipped signals after losses and trades taken outside the rules. In the 20-year E-mini breakout study (86 trades), missing just the three largest winners would have cut 13.51R from a record that totals 1.87R, turning it from positive to negative. Expect live expectancy to come in below the backtest, and measure the gap on your own record.
How to Improve Trading Expectancy
Improving trading expectancy usually means removing trades and cutting costs before chasing bigger winners. It is less exciting than a new entry signal, but it is easier to measure. Work in this order.
- Stop taking the losing groups. If one setup, direction or time of day has negative expectancy over a reasonable sample, removing it raises the average without changing anything else. In the 20-year E-mini breakout study, a long-only version of the rule would have taken the +0.388R half and skipped the -0.538R half, though that is a conclusion drawn from the same data and needs fresh trades to confirm.
- Keep the average loss at or below 1R. Honor the planned stop and avoid widening it. Every loss that runs past 1R pulls expectancy down directly.
- Cut cost per R. Use limit orders where the setup allows, avoid trading through wide spreads, and size so that commissions are a small share of 1R.
- Then work on exits. Letting winners run toward their planned target improves the payoff ratio, but it usually lowers the win rate too, so test any exit change on the full sample and look at the net expectancy, not just the average win.
Each change should pass the same test as the original rule: a recomputed expectancy with its trade count and interval, on trades you have not already used to design the change.
Related lesson: Backtesting a trading strategy
Expectancy, Drawdown and Account Loss Limits
Trading expectancy tells you the average result per trade. It does not tell you how deep the account falls on the way there, and for traders working under a fixed loss limit the depth matters as much as the average. An account that hits its limit never gets to collect the long-run expectancy.
In the 20-year E-mini breakout study, the 86 trades in their actual order produced a maximum drawdown of 9.23R, with a longest losing streak of 7 trades. The order of trades is luck, though. Reshuffling the same 86 results into 10,000 random orders gave a median maximum drawdown of 11.93R, a 95th percentile of 18.36R, and a worst case of 27.52R. Same trades, same expectancy, very different paths.
That gives a direct way to size risk per trade. Under an illustrative hard loss limit of $3,000, keeping the 95th-percentile drawdown of this record inside the limit means risking no more than about $163 per trade ($3,000 / 18.36R). Sizing to the actual historical drawdown of 9.23R would allow about $325 per trade, yet 8,385 of the 10,000 reshuffled orders produced a deeper drawdown than that. A thin expectancy with wide outcomes needs small risk per trade, even when the expectancy is positive.
On our accounts, the drawdown is an end-of-day trailing drawdown enforced in real time, and touching it fails the account; on a 50K Growth Sim Funded account it is $2,000. All positions must also be closed by 4:45 PM ET, so a multi-session rule like the daily breakout in this study could not be traded as written on our accounts. Trading expectancy work for our accounts has to be done on intraday trades, with drawdown measured against that trailing limit.
Related lesson: Maximum drawdown
Trading Expectancy FAQ
What does expectancy mean in trading?
Expectancy in trading is the average profit or loss per trade over a defined sample of trades, measured in dollars or in R. It combines win rate, average win and average loss into one figure. A positive expectancy means the rule made money per trade in that sample, not that the next trade will win.
Is it true that 97% of day traders lose money?
Yes, for at least one well-documented market. Chague, De-Losso and Giovannetti studied everyone who began day trading Brazilian equity index futures between 2013 and 2015 and found that 97% of the 1,551 who persisted for more than 300 days lost money. Only 1.1% earned more than the Brazilian minimum wage, which is consistent with negative expectancy after costs for most individual traders.
What is a good trading expectancy?
Any positive expectancy after costs is the minimum, but the size matters less than the evidence behind it. A good expectancy has a trade count large enough for its 95% interval to sit above zero, survives costs at your real size, and holds up across groups and against random-entry controls. A +0.30R figure over 20 trades is weaker evidence than +0.10R over 1,000.
How is profit factor different from expectancy?
Profit factor divides gross profit by gross loss, while expectancy averages the result per trade. A profit factor above 1.0 and a positive expectancy describe the same sign of edge. Expectancy is more useful for sizing and drawdown planning because it is per trade and has a standard deviation.
Why is my expectancy positive but my account is down?
Usually because costs, uneven risk per trade or a short sample are hiding the real result. Check whether costs are included, whether losers carried larger dollar stops than winners, and whether the trade count is too small for the interval to exclude losses.
Futures trading is leveraged and carries substantial risk of loss, including losses beyond the amount you planned to risk when slippage or gaps carry a trade past its stop. The E-mini study here is a hypothetical backtest on historical daily bars that does not predict future results, evaluation and funded accounts are simulated, and nothing here is investment advice.


