




TL;DR: Profit factor is gross profit divided by gross loss; the real question is whether it is high enough, on enough trades, to trust. Above 1.0 a rule made money, below 1.0 it lost. On 20 years of E-mini S&P 500 bars, a breakout rule read 1.04 over 86 trades and fell below 1.0 when its best trade was removed. Quote the ratio with its trade count, its cost assumptions and its largest winners, or it says very little.
What Profit Factor Measures
You finish a backtest or a month of trading, the report says 1.6, and the question is whether that number means you have something. Profit factor is the single ratio behind that moment: it compares what a set of trades made to what it lost. Add up every winning trade into one total (gross profit), add up every losing trade into a second total and drop the minus sign (gross loss), then divide the first by the second. The answer says how many dollars the winners produced for every dollar the losers took back.
A profit factor of 1.0 is breakeven. Above 1.0, gross profit beat gross loss and the record made money. Below 1.0, it lost money, no matter how often it won. TradingView and NinjaTrader both define the statistic this way in their strategy reports, using closed trades only, so an open position does not count until it is closed.
The ratio is popular because it needs nothing else. No benchmark, no account size, no risk-free rate. That same simplicity is where traders get caught, because three things that decide whether a rule is worth trading are missing from it:
- How many trades produced the two totals. A 2.5 on 20 trades and a 1.3 on 2,000 trades are not the same kind of evidence.
- How the profit is spread. One giant winner can carry the whole numerator while the rest of the record loses.
- What each trade risked. The ratio is the same whether a trade risked $500 or $5,000, so it says nothing about the size of the swings in your account.
Read it as a quick health check on a record of trades, not as a grade for a strategy. A profit factor only becomes useful once it travels with a trade count, a cost assumption and a look at the largest winners.
The Profit Factor Formula With a Worked Example
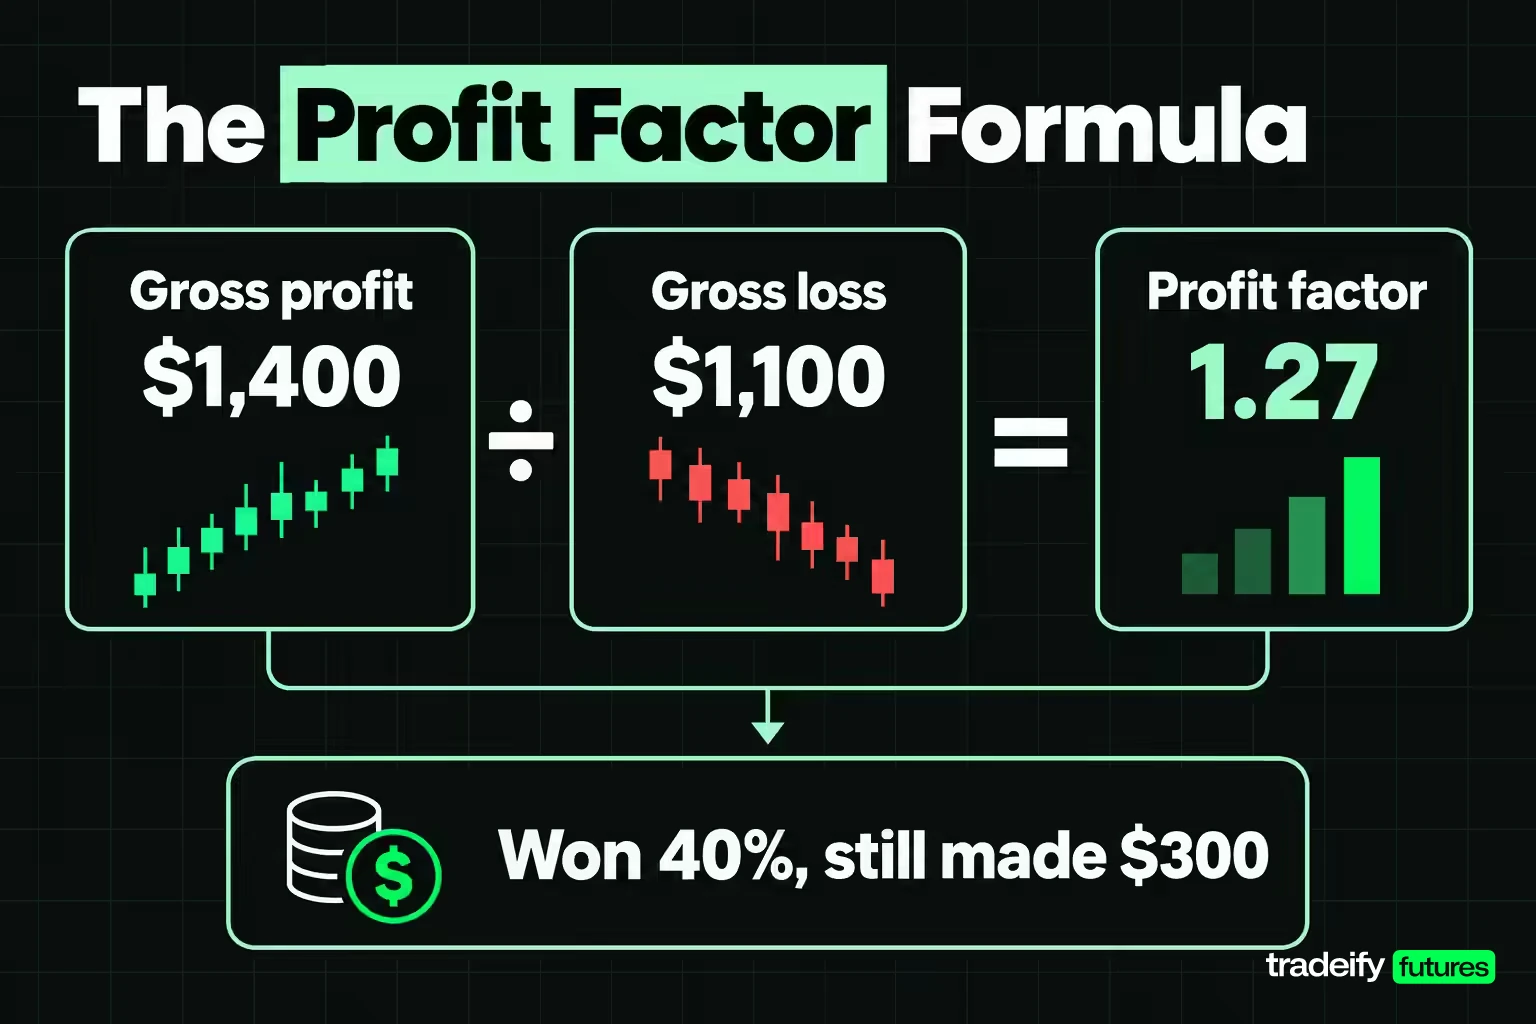
The profit factor formula is:
Profit factor = gross profit ÷ gross loss
Gross profit is the sum of every winning trade. Gross loss is the sum of every losing trade, written as a positive number. Breakeven trades add nothing to either total.
Take an illustrative record of 10 closed trades, with commissions already included in each result:
| Trade | Result |
|---|---|
| 1 | +$400 |
| 2 | -$200 |
| 3 | -$100 |
| 4 | +$250 |
| 5 | -$300 |
| 6 | +$600 |
| 7 | -$150 |
| 8 | -$250 |
| 9 | +$150 |
| 10 | -$100 |
Counting the profit factor takes three steps:
- Add the winners. $400 + $250 + $600 + $150 = $1,400 of gross profit.
- Add the losers and drop the sign. $200 + $100 + $300 + $150 + $250 + $100 = $1,100 of gross loss.
- Divide. $1,400 ÷ $1,100 = a profit factor of 1.27.
That record won 40% of the time and still made $300, or $30 per trade, because its winners were bigger than its losers.
Net, gross and the zero-loss case in the profit factor formula
Two details change the answer more than people expect.
First, use results after commissions and slippage. "Gross profit" in the formula means the total of winning trades, not "profit before costs." If you feed it pre-cost results, the ratio flatters the record, because costs shrink every winner and enlarge every loser at the same time.
Second, a record with no losing trades has no profit factor. Dividing by zero is undefined, not infinite. A journal that prints a huge number, or "100," after a run of winners is telling you the sample is too small to measure, not that the rule is perfect.
One more conversion is useful. Net profit as a share of gross profit equals 1 minus 1 divided by the profit factor. A profit factor of 2.0 means half of everything the winners made was kept, and a 1.27 means about 21% was kept. That one line explains why a ratio near 1.0 leaves so little room for anything to go wrong.
Calculating Profit Factor From Win Rate and Average Trade
You do not need the full trade list to calculate profit factor. Three numbers from any journal summary are enough: the win rate, the average winning trade and the average losing trade.
Profit factor = (win rate × average win) ÷ ((1 − win rate) × average loss)
The logic is simple. Win rate times the average win is gross profit per trade taken. The loss rate times the average loss is gross loss per trade taken. Their ratio is the same profit factor you would get from the totals.
Take an illustrative record of 10 trades with a 40% win rate, an average win of $350 and an average loss of $183.33. 0.40 × $350 = $140, and 0.60 × $183.33 = $110. $140 ÷ $110 = 1.27, the same answer the full list of trades gives.
Profit factor by win rate and payoff
The table shows profit factor for common combinations of win rate and payoff (average win divided by average loss):
| Win rate | Payoff 0.5 | Payoff 1.0 | Payoff 1.5 | Payoff 2.0 |
|---|---|---|---|---|
| 30% | 0.21 | 0.43 | 0.64 | 0.86 |
| 40% | 0.33 | 0.67 | 1.00 | 1.33 |
| 50% | 0.50 | 1.00 | 1.50 | 2.00 |
| 60% | 0.75 | 1.50 | 2.25 | 3.00 |
| 70% | 1.17 | 2.33 | 3.50 | 4.67 |
Two lines in that table are worth keeping in your head when you plan a rule. A 50% win rate with winners twice the size of losers gives a profit factor of 2.0. A 40% win rate with winners 1.5 times the losers is exactly breakeven at 1.0.
The shortcut has one trap. Averages hide the spread inside each side, so two records with the same three inputs can behave very differently trade by trade. Use the shortcut to sanity-check a report or plan a rule, and use the full list when you are judging one.
Profit Factor vs Win Rate
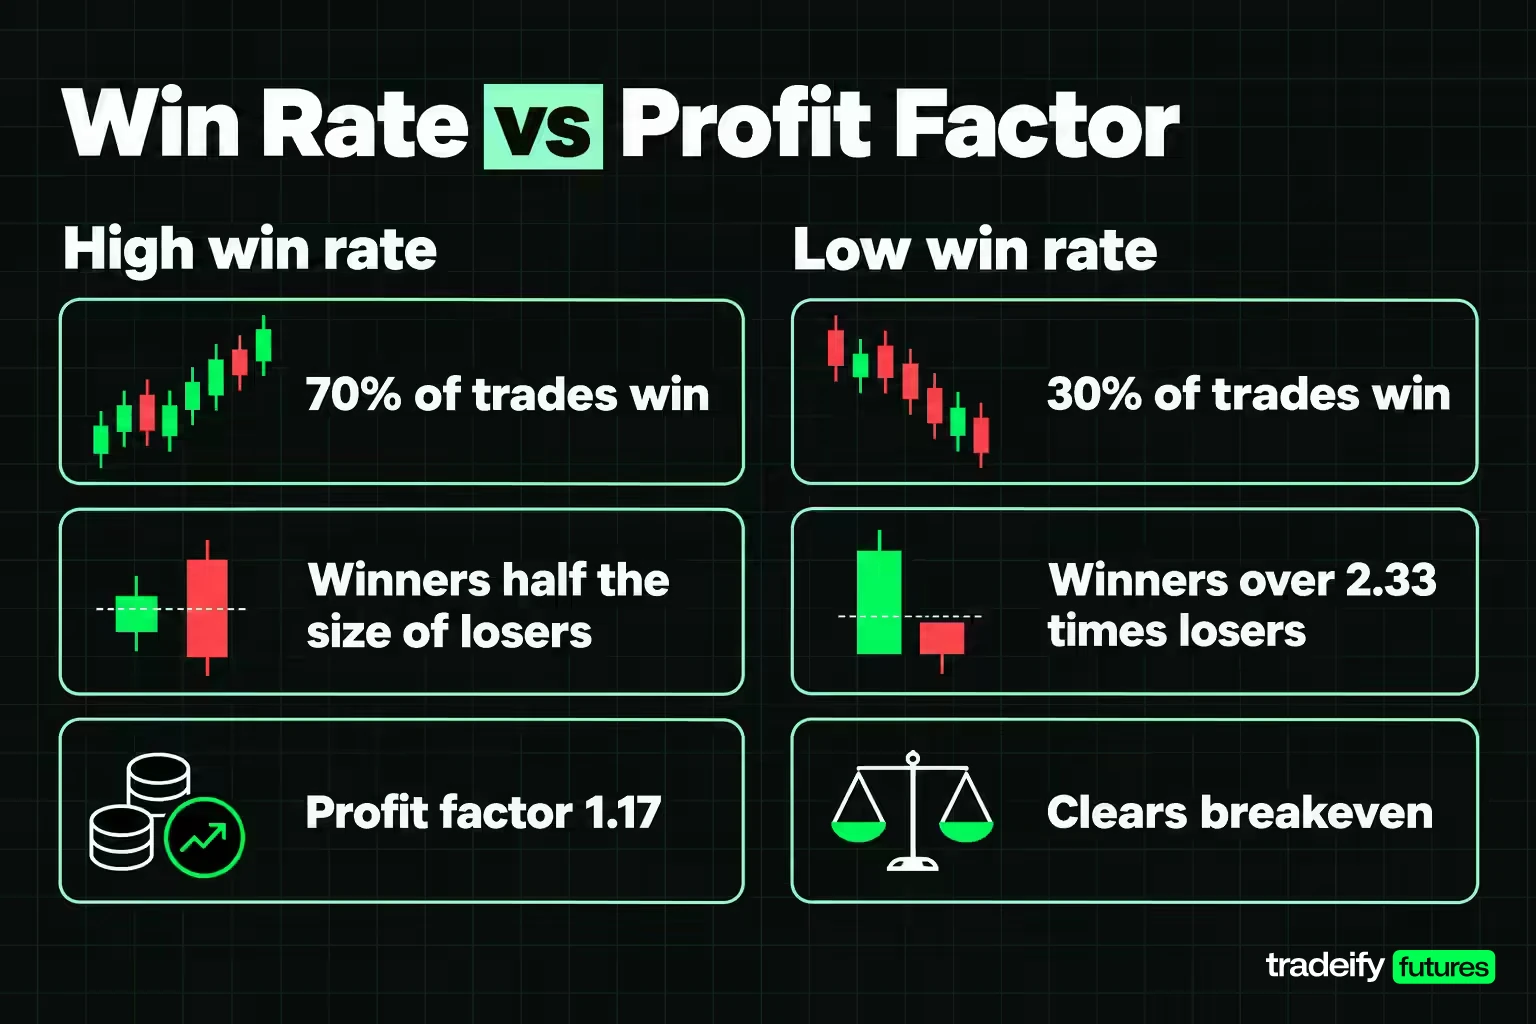
Win rate counts how often you win. Profit factor weighs how much the wins and losses were worth. The two answer different questions, and win rate is the easier one to fool yourself with.
A high win rate feels good because most days end green. But a 70% win rate with winners half the size of losers only reaches a profit factor of 1.17, and one oversized loss can push it under 1.0. A 30% win rate feels miserable, yet with winners more than 2.33 times the size of losers it clears breakeven.
The useful number that ties them together is the breakeven win rate: the win rate at which a given payoff produces a profit factor of exactly 1.0. It equals average loss divided by (average win plus average loss).
Win rate and profit factor on the E-mini breakout rule
A 20-year backtest of a 50-session breakout rule on E-mini S&P 500 (ES) daily bars shows how thin that margin can be. Its 86 trades won 38.37% of the time, with an average win of 1.42R and an average loss of 0.85R (R is the amount risked on each trade). The breakeven win rate for that payoff is 37.41%.
So the whole edge of the rule lived inside one percentage point of win rate. One more loser in place of a modest winner and the profit factor would have printed below 1.0. Neither number told the full story alone. The win rate looked poor, the payoff looked healthy, and only the combination showed how close to the line the rule sat.
If you only track one of the two, track profit factor. When your profit factor moves, the win rate and payoff tell you which side of the trade changed, and that is where the fix lives.
Related lesson: Win rate versus payoff ratio
Profit Factor vs Expectancy
Expectancy is the average result per trade: net profit divided by the number of trades. Profit factor is a ratio of the two totals. They are built from the same ingredients, so they usually agree on direction, but they answer different questions.
- Expectancy tells you how much one more trade is worth on average, in dollars or in R. It is the number to multiply by your trade count when you plan.
- Profit factor tells you how much cushion there is between what the winners made and what the losers cost. It is the number that shows how fragile the edge is.
The two are linked by one identity:
Expectancy per trade = average loss × (1 − win rate) × (profit factor − 1)
On an 86-trade backtest of a 50-session breakout rule on ES daily bars (2006 to 2026), that is 0.85R × 0.6163 × 0.0416 = about 0.022R per trade. The identity shows why a profit factor barely above 1.0 can still carry a positive expectancy, and why that expectancy is tiny: everything after the "profit factor − 1" term is multiplied by a small number.
Use expectancy to size your expectations and profit factor to judge the margin of safety. A rule with a large expectancy and a profit factor near 1.0 makes money in big, rare lumps and gives most of it back in between. A rule with a small expectancy and a profit factor well above 1.0 grinds slowly but has room for costs and bad luck.
Related lesson: Trading expectancy
Profit Factor in a 20-Year E-mini Backtest
Most profit factor guides use a made-up record. This one uses a real one, so you can see how the number behaves on a backtest report.
The E-mini breakout rule and data behind the profit factor study
The data is E-mini S&P 500 (ES) continuous daily bars from September 18, 2006 to September 16, 2026, 5,032 sessions in all. The rule is a plain trend-following breakout, fully specified so anyone can rebuild it:
- Entry: when a session closes above the highest high of the previous 50 sessions, buy at the next session's open. When it closes below the lowest low of the previous 50 sessions, sell short at the next open. One tick of slippage is charged on entry.
- Stop: 2.0 times the 14-session average true range (Wilder method), measured from the entry price. If price gaps through the stop, the trade fills at that session's open instead.
- Exit: if the stop has not been hit, exit at the next open after a close beyond the opposite 20-session channel, with one more tick of slippage. A 250-session time limit never triggered.
- One position at a time. Results are measured in R, the distance from entry to stop.
The rule produced 86 trades between December 6, 2006 and September 10, 2026. It won 33 and lost 53, for a 38.37% win rate. Gross profit was 46.91R and gross loss was 45.03R.
That is a total profit factor of 1.0416, or 1.04. Net result: 1.87R over nearly 20 years. On one ES contract, at $50 per index point, the same trades netted $21,115.
Total profit factor versus the average-trade version
Some journals and glossaries publish a second "profit factor": the average winning trade divided by the average losing trade. NinjaTrader keeps it as a separate line, Ratio Avg. Win / Avg. Loss, which is a cleaner name for it. On this sample it reads 1.6728, because the average win (1.42R) is much larger than the average loss (0.85R).
The same 86 trades therefore read 1.04 on the total version and 1.67 on the average version, a gap of 60.6%. The average version ignores how many trades sat on each side, so it can look strong even when the losers outnumber the winners enough to wipe out the profit. When a report or a forum post quotes a profit factor, check which one it is.
Profit factor across 12 E-mini breakout settings
The ES breakout rule (close beyond an N-session channel, ATR stop, 20-session exit channel) was rerun with four breakout lookbacks and three stop widths on the same 5,032 daily sessions from 2006 to 2026:
| Lookback | Stop | Trades | Total profit factor | Average-trade ratio | Win rate |
|---|---|---|---|---|---|
| 20 sessions | 1.5 ATR | 122 | 1.02 | 2.01 | 33.6% |
| 20 sessions | 2.0 ATR | 106 | 1.17 | 1.79 | 39.6% |
| 20 sessions | 3.0 ATR | 99 | 1.03 | 1.40 | 42.4% |
| 50 sessions | 1.5 ATR | 95 | 0.98 | 2.13 | 31.6% |
| 50 sessions | 2.0 ATR | 86 | 1.04 | 1.67 | 38.4% |
| 50 sessions | 3.0 ATR | 82 | 0.94 | 1.39 | 40.2% |
| 100 sessions | 1.5 ATR | 73 | 1.16 | 2.09 | 35.6% |
| 100 sessions | 2.0 ATR | 65 | 1.26 | 1.66 | 43.1% |
| 100 sessions | 3.0 ATR | 63 | 1.10 | 1.38 | 44.4% |
| 150 sessions | 1.5 ATR | 65 | 1.11 | 2.33 | 32.3% |
| 150 sessions | 2.0 ATR | 56 | 1.33 | 1.91 | 41.1% |
| 150 sessions | 3.0 ATR | 54 | 1.21 | 1.63 | 42.6% |
Across all 12 settings the total profit factor never reached 1.5. Its best cell was 1.33, and 2 of 12 cells were losers below 1.0. The average-trade ratio reached 1.5 or more in 9 of 12 cells, 2.0 or more in 4, and never fell below 1.0.
There is a second lesson in the grid. The best total reading, 1.33, came from the cell with the fewest trades (56). If you scanned this grid and picked the top number, you would be choosing the setting most exposed to luck. That is how optimization turns a profit factor into a fitting exercise.
Reading the profit factor line on a backtest report
When a strategy report shows a profit factor, read the lines next to it before you react:
- The trade count, which sets how much the ratio can be trusted.
- Whether commissions and slippage were included.
- Gross profit and the largest winning trade, to see how much one trade carries.
- Whether the number is the total version or the average-trade version.
Related lesson: Backtesting a trading strategy
What Is a Good Profit Factor
A good profit factor is one that stays above 1.0 after costs, on enough trades, without leaning on a handful of outliers. There is no single published threshold, and the commonly cited bands disagree.
Among page-one guides, one says most traders look for a minimum profit factor of 1.2 and calls above 1.5 favorable. Another calls 1.5 solid and 2.0 or more excellent. A third calls above 1.2 after fees a real but modest edge, and says anything above 2.0 deserves suspicion until the trade count backs it up. Read together, a rough consensus looks like this:
- Below 1.0: the record lost money.
- 1.0 to 1.2: barely profitable; costs and bad luck can erase it.
- 1.2 to 1.5: a modest edge, if the sample is large and costs are in.
- 1.5 to 2.0: strong, if the sample is large.
- Above 2.0: possible, but check the trade count, the costs and the largest winners first.
The bands are a rough guide, not a standard. A scalping rule that trades hundreds of times a month can live on a 1.2, while a rule that trades a few times a year needs a wider cushion because each trade carries more of the result.
What each profit factor band would actually require
A band table is easier to judge read backwards. Take an 86-trade backtest of a 50-session breakout rule on ES daily bars from 2006 to 2026, which read 1.04, and hold its 46.91R of gross profit fixed. How much loss would have to disappear to reach each band?
| Target profit factor | Loss to remove | Share of gross loss | Equivalent full 1R stop-outs |
|---|---|---|---|
| 1.2 | 5.95R | 13.2% | about 6 |
| 1.5 | 13.76R | 30.6% | about 14 |
| 1.75 | 18.23R | 40.5% | about 18 |
| 2.0 | 21.58R | 47.9% | about 22 |
The rule had 33 full stop-outs. Reaching a 1.5 would have meant about 14 of them never happening, with every winner unchanged. That is not a tweak. It is a different rule, and a different rule has to be measured on its own trades.
This is why a profit factor works badly as a target. The number is an output of the rule. Pushing it toward a band usually means adding filters until past losers disappear, which produces a better backtest and often a worse live result.
How Many Trades a Profit Factor Needs
A profit factor is an estimate from a sample, and small samples swing wildly. The cleanest way to see it is to resample a known record and watch what the ratio does at different trade counts.
The table takes the 86 trades from a 20-year E-mini S&P 500 backtest (a 50-session breakout rule on ES daily bars, 2006 to 2026, full-sample profit factor 1.04) and draws random samples from them with replacement, 5,000 times at each size. Nothing about the rule changes from row to row, only the number of trades:
| Trades in sample | 5th percentile | Median | 95th percentile | Draws at 1.5 or higher | Draws below 1.0 |
|---|---|---|---|---|---|
| 10 | 0.11 | 0.94 | 3.47 | 29.2% | 52.7% |
| 20 | 0.31 | 1.02 | 2.54 | 25.4% | 48.9% |
| 30 | 0.40 | 1.01 | 2.11 | 19.6% | 48.6% |
| 50 | 0.52 | 1.02 | 1.82 | 14.3% | 47.8% |
| 100 | 0.66 | 1.03 | 1.55 | 6.8% | 44.7% |
| 200 | 0.75 | 1.04 | 1.40 | 2.0% | 42.1% |
| 500 | 0.85 | 1.04 | 1.25 | 0.02% | 36.1% |
| 1,000 | 0.91 | 1.04 | 1.19 | 0.0% | 31.3% |
| 2,000 | 0.95 | 1.04 | 1.14 | 0.0% | 23.8% |
At 10 trades, this barely profitable rule printed 1.5 or better 29.2% of the time. Almost a third of short samples would have looked like a strong strategy. At 50 trades the range still ran from 0.52 to 1.82. Even at 2,000 trades, 23.8% of samples printed a losing ratio, because a true edge of about 1.04 is small next to normal variation.
Running profit factor of the E-mini breakout in trade order
Resampling is one view. The other is simply reading the record in the order it happened. Here is the running profit factor of the 86 trades from the 20-year ES breakout backtest (50-session breakout, 2.0 ATR stop), checked every 10 trades:
| Trades so far | Running profit factor |
|---|---|
| 10 | 0.06 |
| 20 | 0.59 |
| 30 | 0.83 |
| 40 | 0.87 |
| 50 | 0.81 |
| 60 | 0.88 |
| 70 | 0.93 |
| 86 | 1.04 |
A trader who judged this rule after its first 10 trades would have thrown it away, and most of us would have. A trader who judged it after 86 would call it modestly profitable. Both were reading the same rule. The trade count decides which story the number tells.
A practical trade count for profit factor
There is no count at which a profit factor becomes reliable for every rule, because the spread depends on how lumpy the trades are. A workable habit:
- Under 30 trades: treat the profit factor as anecdote.
- 30 to 100 trades: treat it as provisional and look at the range, not the point.
- Over 100 trades: start trusting it, as long as the margin above 1.0 is wide compared with the range.
If your rule's profit factor is close to 1.0, no reasonable sample will settle the question. That is an answer too, and it is cheaper to accept it in a spreadsheet than in an account.
Outlier Trades That Carry a Profit Factor
Profit factor compares totals, so one large trade can carry the whole record. The quickest test is to remove the biggest winners one at a time and recalculate.
On the 86-trade E-mini breakout sample (a 50-session breakout rule on ES daily bars, 2006 to 2026, profit factor 1.04):
| Largest winners removed | Profit factor | Net result | Share of gross profit removed |
|---|---|---|---|
| 0 | 1.04 | 1.87R | 0% |
| 1 | 0.93 | -3.12R | 10.6% |
| 2 | 0.83 | -7.87R | 20.8% |
| 3 | 0.74 | -11.64R | 28.8% |
| 5 | 0.58 | -18.72R | 43.9% |
| 10 | 0.32 | -30.47R | 69.0% |
Removing one trade, a 4.99R long entered November 21, 2023 and closed April 16, 2024, turned the 1.04 into a 0.93. The 20-year record depended on one trend. The ten best trades held 69.0% of all gross profit.
That is not automatically a flaw. Trend-following rules are built to pay for many small losses with a few large wins. The problem is quoting the ratio without saying so, and then sizing up as if the next 20 trades will look like the average. The exit breakdown makes the shape clear: 33 trades lost exactly 1.00R at the stop, one gapped through its stop for a 1.43R loss, and 52 trades exited on the channel rule for a combined 36.30R.
Zero losses, open trades and dollar versus R profit factor
- No losing trades. The ratio is undefined. Report it as "not yet measurable," not as a huge number.
- A tiny gross loss. A rule that rarely loses but takes tiny losses can show 5.0 or 10.0 on a short sample. The next real loss collapses it.
- Open trades. Most platforms exclude them. A rule that holds losers open while closing winners can show a flattering profit factor until the losers are finally closed.
- R versus dollars. The 86-trade ES breakout backtest's 1.04 is computed in R. In dollars on one ES contract, the same trades read 1.12, because the dollar risk per trade ranged from $1,648 at the 5th percentile to $10,644 at the 95th as volatility changed. Larger-risk trades happened to land on the winning side. Neither version is wrong, but they are different numbers, and comparing an R-based profit factor with a dollar-based one mixes units.
Profit Factor After Commissions and Slippage
Costs hit profit factor from both sides at once. A commission shaves every winner and enlarges every loser, so a rule that reads 1.05 before costs can read below 1.0 after them without either total looking unusual.
Take an 86-trade backtest of a 50-session breakout rule on ES daily bars from 2006 to 2026. Its figures already carry one tick of slippage at entry and one on channel exits. One ES tick is 0.25 index points, or $12.50. Here is what removing that slippage, or adding an illustrative commission per round turn, does to the 86 trades:
| Cost assumption | Profit factor | Net result |
|---|---|---|
| No slippage, no commission | 1.055 | not shown |
| Slippage only (study baseline) | 1.042 | 1.87R |
| Slippage plus $5 commission | 1.038 | 1.72R |
| Slippage plus $10 commission | 1.035 | 1.57R |
| Slippage plus $25 commission | 1.024 | 1.11R |
Costs barely move this rule because its stops are wide. The median stop was 57.71 points, about $2,886 of risk on one ES, so a $30 round-turn cost (two ticks plus a $5 commission) is about 1.04% of the risk on a typical trade.
Why tight stops make profit factor more cost-sensitive
The same $30 on a 15-point stop ($750 of risk on one ES) is 4.0% of the risk. Costs scale with the number of contracts and trades, not with the size of the stop, so the tighter the stop, the bigger the cost is relative to each R.
Take an illustrative rule with 40 wins of 1.8R and 60 losses of 1R. Before costs its profit factor is 1.20. At a cost of 0.0104R per trade, roughly the wide-stop case, it falls to 1.18. At 0.04R per trade, roughly the tight-stop case, it falls to 1.13. Scalping and short-hold strategies feel this the most, because their small targets leave the least room for a tick here and a commission there.
The practical rule: run every profit factor net of your real commission and a slippage assumption you can defend, and compare rules only after both are in.
Related lesson: Commission adjusted futures breakeven
Tracking Profit Factor Over Time and by Setup
One profit factor for your whole history hides almost everything that changed inside it. Tracking it in slices shows when a rule stopped working and which part of it never worked.
Profit factor by time period
Split an 86-trade E-mini breakout record (a 50-session breakout rule on ES daily bars, 2006 to 2026) into five-year blocks by entry date and the 1.04 turns out to be an average of very different periods:
| Entry period | Trades | Profit factor |
|---|---|---|
| 2006 to 2010 | 22 | 0.89 |
| 2011 to 2015 | 23 | 0.61 |
| 2016 to 2020 | 18 | 1.71 |
| 2021 to 2025 | 20 | 1.49 |
| 2026 to September 10 | 3 | 0.66 |
Ten years of losing blocks were followed by ten years of winning ones. A trader who only saw 2011 to 2015 would have quit. A trader who started in 2016 would think the rule was strong. Each block has only about 20 trades, so none of them alone is reliable, but the swing between them is the point: a rolling profit factor shows a rule's moods, which a lifetime figure averages away.
Profit factor by setup and direction
The same record split by direction tells a sharper story. The 52 long trades had a profit factor of 1.92. The 34 short trades had a profit factor of 0.21. In a market that rose over most of those 20 years, the short side lost money almost every time and dragged the overall figure down to 1.04.
Splitting your own journal by setup, session, instrument and direction works the same way. A combined profit factor near 1.0 is often one profitable setup carrying one losing one.
Tools that report profit factor
You do not have to build this by hand:
- TradingView shows profit factor in its strategy report, calculated on closed trades.
- NinjaTrader 8 reports Profit Factor (gross profit divided by gross loss) and, separately, Ratio Avg. Win / Avg. Loss in its Trade Performance statistics.
- Tradovate's Performance report shows P&L metrics, win rate and trade statistics for any date range, which gives you gross profit and gross loss to divide.
- A spreadsheet does it in two formulas: SUMIF of results above zero, divided by the absolute SUMIF of results below zero. Add a date or setup column and a pivot table gives you profit factor by period, setup and direction.
Review the slices on a fixed schedule, monthly or every 50 trades. Checking the ratio after every loss is how a normal losing stretch turns into a rule change you did not plan.
Related lesson: How to keep a trading journal
How to Improve Profit Factor Without Curve Fitting
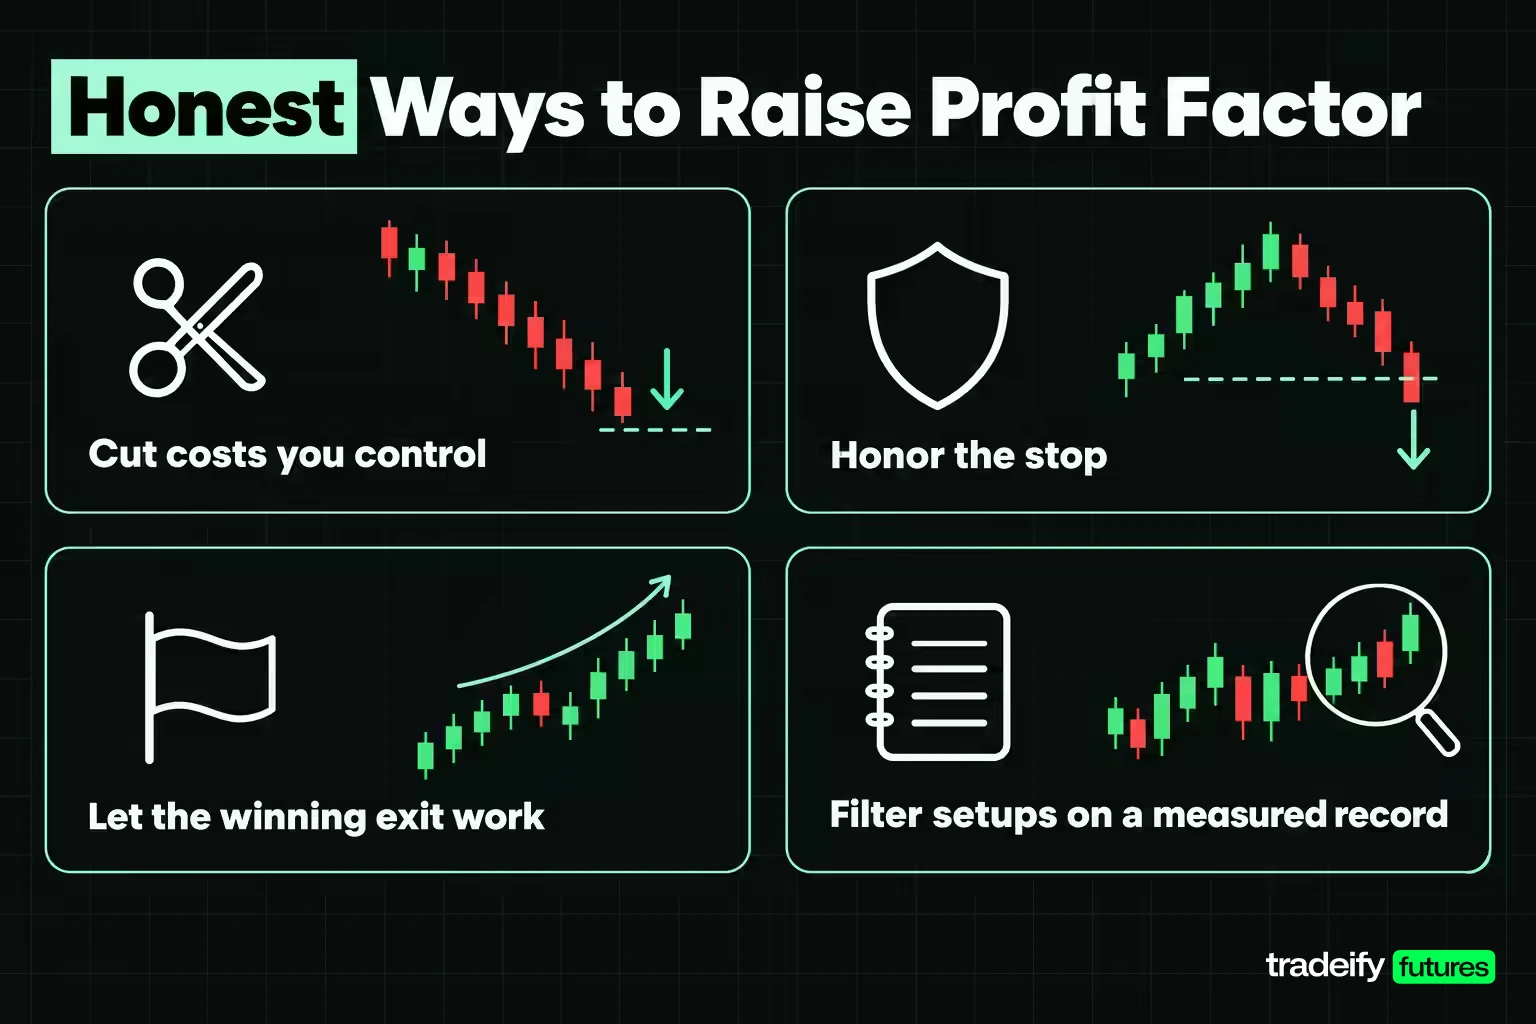
There are only two ways to raise a profit factor: make the winners add up to more, or make the losers add up to less. The honest levers are few:
- Cut costs you control. Fewer marginal trades, limit orders where they fill reliably, and the right contract size for your commission schedule all lift both sides of the ratio at once.
- Honor the stop. A profit factor collapses fastest when a planned 1R loss becomes a 3R loss. In an 86-trade ES breakout backtest, the single gap through a stop cost 1.43R; widening losses by choice costs far more.
- Let the winning exit do its job. In trend-following rules most of the profit sits in a few long trades. Cutting those early to "lock in" gains removes the trades the ratio depends on.
- Filter setups that already have a measured record. If your journal shows one setup at 0.6 over 80 trades, dropping it is evidence-based. Dropping it after 8 trades is not.
Why hindsight fixes inflate profit factor
Every change to a rule's stop, exit, filter or costs creates a new rule, and the new rule needs its own trade count. Hindsight makes this easy to miss. In an 86-trade breakout backtest on ES daily bars from 2006 to 2026, the long trades read 1.92 and its shorts read 0.21, so a "long-only" version looks like an obvious fix. But that fix was chosen after seeing the result, on a market that rose for most of the sample. It may be right. It still has to be tested on data it was not chosen from before the 1.92 means anything.
The safer workflow is to decide the change in advance, write down why, and judge it on trades that come after the decision. It is slower, and it is the only version where the new number means what you hope it means.
Profit Factor Under Prop Account Rules
On a funded or evaluation account, the account rules decide whether you keep trading, and none of them read your profit factor. Drawdown limits care about the order of your trades. A record with a 1.5 profit factor can still breach a trailing drawdown if its losers bunch together before its winners arrive. Consistency rules, which compare your biggest day with your total profit, care about concentration: how much of the result came from one big winner.
That means a profit factor carried by one huge winner has two problems on a prop account. The edge is fragile, and the profit is concentrated in exactly the way consistency rules are designed to catch.
On our accounts there is no profit factor requirement. What ends an account is the end-of-day trailing drawdown, which is enforced in real time, and payouts on funded accounts carry consistency rules: your biggest single day can be at most 35% of total profit on Growth funded accounts and 20% rising to 30% on Lightning funded accounts. Funded accounts are simulated, and every position must be closed by 4:45 PM ET, so a multi-week trend rule that holds positions for days or weeks could not run on our accounts as written. Intraday traders can still run the same profit factor checks on their own journals.
Profit Factor FAQ
How do you count profit factor?
Add all winning trades into gross profit and all losing trades into gross loss, drop the minus sign, and divide. Winners of $1,400 against losers of $1,100 give a profit factor of 1.27. Use results after commissions and slippage.
What does a profit factor of 1.0 mean?
It means gross profit equals gross loss, so the record broke even. Above 1.0 it made money and below 1.0 it lost money. A profit factor cannot be negative, because both totals are positive numbers.
Is a profit factor of 1.5 good?
On a large sample with costs included, 1.5 is a strong result. On 20 trades it may be luck: in an 86-trade ES breakout backtest that read 1.04, resampled 20-trade sets printed 1.5 or better 25.4% of the time. Always ask how many trades produced it.
Is a 50% profit margin too much?
A 50% profit margin is not too much, but it is a different statistic from profit factor: margin is net profit divided by revenue. The closest trading version is net profit as a share of gross profit, which equals 1 minus 1 divided by the profit factor. A 50% share means a profit factor of 2.0, which is strong and deserves a check of the trade count and costs.
How much money do day traders with $100,000 accounts make per day on average?
There is no reliable average, and account size alone does not set daily income. In "Day Trading for a Living?", economists Fernando Chague, Rodrigo De-Losso and Bruno Giovannetti found that 97% of individuals who day traded Brazilian equity index mini futures for more than 300 days lost money. A trader's profit factor, trade count and risk per trade say more than the account size.
What is the 3-5-7 rule in trading?
The 3-5-7 rule is an informal risk guideline: risk no more than 3% of capital on one trade, keep total open exposure under 5%, and aim for winners at least 7% larger than losers. Definitions vary between sources. It is a sizing habit, not a performance measure like profit factor.
Can profit factor be too high?
It can be uninformative. Very high readings usually come from a small sample, a rule with almost no losing trades, or a backtest that left out costs. Check the trade count and remove the largest winners before trusting it.
Why is my profit factor high but my account still losing?
Common reasons are costs left out of the calculation, open losing trades that are not counted yet, or an average-trade ratio being shown instead of the total version. Recalculate from closed, net results to see the real figure.
Futures trading uses leverage, and losses can exceed what you planned or deposited. The breakout study described here is a historical backtest on continuous ES bars with stated assumptions; it is not a prediction and does not reflect live fills or a trader's own behavior. Funded and evaluation accounts are simulated. Nothing here is investment advice or a recommendation to trade any instrument or strategy, and no ratio, stop or rule removes the risk of loss.


