




TL;DR: Pivot points are price levels built from the prior session's high, low and close, and the main decision is which of them to plan around. Across 500 ES and NQ sessions, the pivot was reached in about three of every four sessions. The first levels came in near 44%, and R3 in 3% to 4%. Plan around the pivot and the nearer first level, and treat the outer levels as context.
What Are Pivot Points
Every charting platform will draw pivot points for you. The harder question is which of the seven lines deserve your attention in the next session, and that is a question of numbers, not of how clean the chart looks.
Pivot points are a set of price levels calculated from the prior session's high, low and close. The central level, the pivot (P), is the average of those three prices. Support levels (S1, S2, S3) sit below it and resistance levels (R1, R2, R3) sit above it, each spaced off the pivot using the prior session's range.
The defining feature is that the levels are fixed before the session opens. A moving average redraws with every new bar. A daily pivot line for today was settled when yesterday closed, and it reads the same at the open and at the close.
That is what pivot points do: they hand you a short list of pre-calculated prices where the market may pause, reverse or accelerate, before any of today's trading has happened. TradingView's own description is that the indicator displays levels where price might meet support or resistance. Might is the right word.
The word pivot itself just means the point something turns on. In this context it is the level that splits the session in two. Trading above the pivot is usually read as a bullish lean for the session, and trading below it as a bearish lean. That reading is a convention, not a law. In a 500-session ES study run for this guide on Yahoo Finance daily bars (November 2024 to November 2026), an open above the pivot ended with a close above it about two times in three, which is a lean worth knowing and nowhere near a sure thing.
How to Calculate Pivot Points
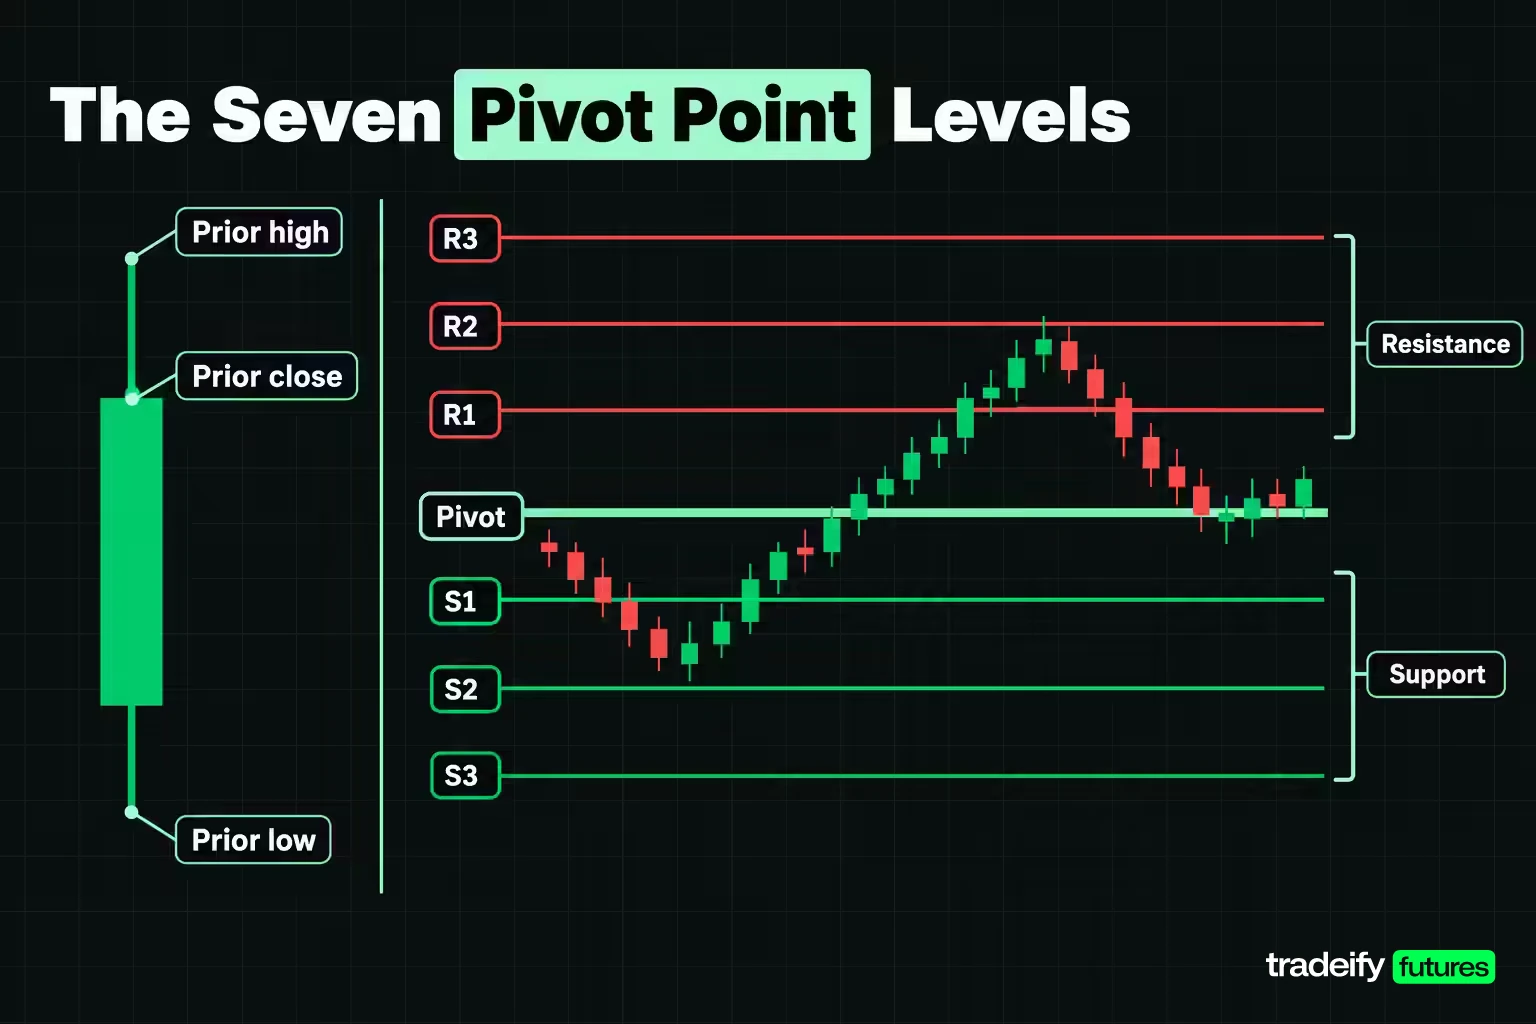
The standard calculation (TradingView calls it Traditional, many traders call it the floor pivot) uses three inputs from the prior session and produces seven levels.
- P = (prior high + prior low + prior close) / 3
- R1 = 2 x P - prior low
- S1 = 2 x P - prior high
- R2 = P + (prior high - prior low)
- S2 = P - (prior high - prior low)
- R3 = prior high + 2 x (P - prior low)
- S3 = prior low - 2 x (prior high - P)
Read the structure rather than memorising it. R1 adds the distance from the prior low to the pivot onto the pivot. S1 subtracts the distance from the pivot to the prior high. R2 and S2 add and subtract the whole prior range. R3 and S3 push out one more full range from R1 and S1.
Illustrative pivot point example with round numbers
Take an illustrative market with a prior high of 110.00, a prior low of 100.00 and a prior close of 106.00. The range is 10.00.
| Level | Calculation | Result |
|---|---|---|
| R3 | 110 + 2 x (105.33 - 100) | 120.67 |
| R2 | 105.33 + 10 | 115.33 |
| R1 | 2 x 105.33 - 100 | 110.67 |
| P | (110 + 100 + 106) / 3 | 105.33 |
| S1 | 2 x 105.33 - 110 | 100.67 |
| S2 | 105.33 - 10 | 95.33 |
| S3 | 100 - 2 x (110 - 105.33) | 90.67 |
Notice that R1 sits 5.33 above the pivot and S1 sits 4.67 below it, measured from the unrounded pivot of 105.333. The close finished in the upper part of the range, which pulled the pivot up and made the upper leg wider. That small asymmetry matters more than it looks, because it puts the long target and the short target at different distances from the pivot.
Calculating pivot points in a spreadsheet
A spreadsheet handles this in seven cells. Put the prior high, low and close in B2, C2 and D2, then use:
- P in E2: =(B2+C2+D2)/3
- R1: =2*E2-C2
- S1: =2*E2-B2
- R2: =E2+(B2-C2)
- S2: =E2-(B2-C2)
- R3: =B2+2*(E2-C2)
- S3: =C2-2*(B2-E2)
Fill the rows down a daily price history and each row gives the levels for the following session. Keep the inputs from the same session definition your chart uses, because a pivot built from regular-hours prices and one built from the full electronic session are different numbers.
Pivot Points Worked on a Real ES and NQ Session
Formulas are easy to agree with and easy to misapply, so here are pivot points on two real sessions. The data is the continuous front-month E-mini S&P 500 (ES) and E-mini Nasdaq-100 (NQ) daily bars from the Yahoo Finance chart feed.
On Friday, October 30, 2026, ES printed a high of 7713.00, a low of 7558.25 and a close of 7614.00, a range of 154.75 points. The pivot for Monday, November 2 was (7713.00 + 7558.25 + 7614.00) / 3 = 7628.42. NQ printed a high of 29180.00, a low of 28232.75 and a close of 28534.00, a range of 947.25 points, for a pivot of 28648.92.
| Level | ES level for Nov 2 | ES reached on Nov 2 | NQ level for Nov 2 | NQ reached on Nov 2 |
|---|---|---|---|---|
| R3 | 7853.33 | No | 30012.33 | No |
| R2 | 7783.17 | No | 29596.17 | No |
| R1 | 7698.58 | No | 29065.08 | No |
| P | 7628.42 | Yes | 28648.92 | Yes |
| S1 | 7543.83 | No | 28117.83 | Yes |
| S2 | 7473.67 | No | 27701.67 | No |
| S3 | 7389.08 | No | 27170.58 | No |
ES opened on November 2 at 7626.00, almost on the pivot. It ran to a high of 7693.75, which missed R1 by 4.83 points, then reversed to a low of 7570.75 and closed at 7574.50, 53.92 points under the pivot. NQ opened at 28587.75, traded as low as 28101.75 (through S1) and closed at 28127.50, 9.67 points back above S1.
Two lessons sit in that one session. First, a level missed by under five points counts as not reached, so any touch count is strict by design. Second, the pivot was in play on both contracts, while R1 was not reached on either, even on a session that rallied more than 65 points off the open on ES. That pattern repeats across 500 sessions.
Why Pivot Point R1 and S1 Sit at Unequal Distances
Look at the two first-level pivot legs. The distance from the pivot up to R1 is P minus the prior low. The distance down to S1 is the prior high minus P. They are equal only when the prior close landed exactly on the midpoint of the prior range.
The gap between the two legs has an exact form: R1 leg minus S1 leg equals two thirds of (prior close minus the prior range midpoint). A close in the upper half of the range widens the upper leg, and a close in the lower half widens the lower leg. The second and third levels do not share this lopsidedness, because they are built from the full range and sit symmetrically around the pivot.
Across 500 ES and NQ sessions from November 2024 to November 2026, the prior close finished above its range midpoint on 277 of 500 ES sessions and 289 of 500 NQ sessions. So the median ES distance from the pivot up to R1 was 38.96 points, against 34.79 down to S1, an upper leg about 12% wider. On NQ the medians were 211.25 and 182.46 points, about 16% wider.
The practical consequence: if you plan a pivot trade with R1 as the long target and S1 as the short target, the two trades usually do not offer the same distance. Treating them as mirror images builds a hidden error into your reward-to-risk math. Measure each leg on the day.
Pivot Points as Support and Resistance in 500 Sessions
A level only matters if price reaches it. To see how pivot points behave as support and resistance, the traditional levels were calculated for 500 consecutive ES and NQ sessions, from November 7, 2024 to November 3, 2026, each from the session before it.
Two counts were taken for each level. Reached means the level sat inside the next session's high-to-low range. Held means that, on the sessions where it was reached, the close finished back on the near side (below a resistance level, above a support level).
| Level | ES reached | ES share | ES held when reached | NQ reached | NQ share | NQ held when reached |
|---|---|---|---|---|---|---|
| R3 | 20 | 4.0% | 9 of 20 (45.0%) | 15 | 3.0% | 6 of 15 (40.0%) |
| R2 | 63 | 12.6% | 30 of 63 (47.6%) | 75 | 15.0% | 42 of 75 (56.0%) |
| R1 | 221 | 44.2% | 105 of 221 (47.5%) | 220 | 44.0% | 111 of 220 (50.5%) |
| P | 373 | 74.6% | Closed above 197 of 373 | 362 | 72.4% | Closed above 195 of 362 |
| S1 | 215 | 43.0% | 122 of 215 (56.7%) | 205 | 41.0% | 108 of 205 (52.7%) |
| S2 | 103 | 20.6% | 55 of 103 (53.4%) | 100 | 20.0% | 52 of 100 (52.0%) |
| S3 | 50 | 10.0% | 29 of 50 (58.0%) | 54 | 10.8% | 32 of 54 (59.3%) |
How often each pivot level was reached
In this guide's 500-session study of Yahoo Finance daily bars, the pivot is the only level that is in play on most days: 74.6% of ES sessions and 72.4% of NQ sessions reached it. The first levels are close to a coin flip at 41% to 44%. The second levels came in near one session in five or less, and R3 at 4.0% on ES and 3.0% on NQ.
So R3 is not a daily target. In that same study it is closer to a one-in-25 event, and a plan that needs it to trigger will spend most of its time waiting.
What the held column says about stops and targets
Being reached is not the same as being respected. Once price got to R1 on ES, the close finished back below it in 105 of 221 sessions (47.5%), which means it closed through in the other 116. S1 held more often, at 56.7%. On NQ the first levels were closer to even.
None of these held rates is far from 50%. That is the honest finding: a first-level pivot is a place where a decision becomes due, not a place where the market reliably turns. Use it the way that matches the numbers:
- As a target, a first level is reasonable because it is reached often enough to be realistic.
- As an entry by itself, it is a coin flip, so it needs a reaction on your own chart (a rejection candle, a failed break, a shift in order flow) before it becomes a trade.
- As a stop location, place the stop beyond the level with room for noise, not exactly on it, because price trades through first levels about half the time even when the session later turns.
How the Prior Close Changes Which Pivot Levels Get Reached
Pivot levels are fixed, but how reachable they are is not. Where the prior session closed inside its own range decides which side of the pivot sits near the next open, and you know that before the bell.
Splitting the 500 ES and NQ sessions (measured for this guide on Yahoo Finance daily bars, November 2024 to November 2026) into thirds by the prior close's position in its range gives this:
| Prior close position | ES sessions | ES P reached | ES R1 reached | ES S1 reached | ES S2 reached |
|---|---|---|---|---|---|
| Bottom third | 144 | 77.8% | 40.3% | 53.5% | 26.4% |
| Middle third | 139 | 87.8% | 44.6% | 51.1% | 28.8% |
| Top third | 217 | 64.1% | 46.5% | 30.9% | 11.5% |
| Prior close third | NQ sessions | NQ P reached | NQ R1 reached | NQ S1 reached | NQ S2 reached |
|---|---|---|---|---|---|
| Bottom third | 131 | 71.8% | 38.2% | 48.9% | 21.4% |
| Middle third | 155 | 87.1% | 44.5% | 47.7% | 26.5% |
| Top third | 214 | 62.1% | 47.2% | 31.3% | 14.5% |
Three things stand out in that study. After a mid-range close, the pivot was reached in nearly nine sessions out of ten, because the open tends to start close to it. After a top-third close, the pivot was reached least often (64.1% on ES), since a session that opens and stays above the pivot never needs to come back. And after a top-third close, S1 was reached in under a third of sessions while S2 fell to 11.5% on ES.
The open positions in the same Yahoo Finance data explain why. After a top-third close, the median ES open sat 60.8% of the prior range above S1 and only 39.2% below R1. After a bottom-third close it flipped to 42.0% above S1 and 58.0% below R1. NQ showed the same shape.
The takeaway is a ranking, not a prediction. Yesterday's close tells you which first level is near and which is a stretch, so you can rank levels by reachability before you look for a setup.
Pivot Point Types Compared
Most charting platforms ship several pivot point types, and choosing between them changes your levels more than most traders expect. TradingView lists Traditional, Fibonacci, Woodie, Classic, DM (DeMark) and Camarilla.
- Traditional (floor): P is the average of the prior high, low and close; R1 = 2 x P - prior low, S1 = 2 x P - prior high, and R2 and S2 add and subtract the prior range.
- Classic: same P, R1, S1, R2 and S2 as Traditional; R3 and S3 sit two full ranges from the pivot.
- Fibonacci: same pivot, with R1 and S1 at 0.382 of the prior range from P, R2 and S2 at 0.618, and R3 and S3 at 1.0.
- Woodie: P = (prior high + prior low + 2 x current open) / 4, so today's open gets double weight; R1 and S1 use the traditional form around that pivot.
- Camarilla: levels are built off the prior close, not the pivot. R1 and S1 sit 1.1 x range / 12 from the close, R3 and S3 at 1.1 x range / 4, R4 and S4 at 1.1 x range / 2.
- DeMark: the pivot depends on whether the prior session closed above or below its open, with X = 2 x high + low + close on an up session and X = high + 2 x low + close on a down session; P = X / 4, R1 = X / 2 - prior low, S1 = X / 2 - prior high.
- Central Pivot Range (CPR): a band rather than a line. The bottom central level is (high + low) / 2 and the top central level is 2 x P minus that midpoint.
The same session in five pivot types
On the ES session for November 2, built from the October 30 bar, the types gave these first levels:
| Pivot type | ES pivot | ES R1 | ES S1 |
|---|---|---|---|
| Traditional | 7628.42 | 7698.58 | 7543.83 |
| Fibonacci | 7628.42 | 7687.53 | 7569.30 |
| Woodie | 7630.81 | 7703.38 | 7548.62 |
| Camarilla | 7628.42 | 7628.19 | 7599.81 |
| DeMark | 7610.88 | 7663.50 | 7508.75 |
Same inputs, very different trading days for anyone using these pivot point types. The Fibonacci R1 at 7687.53 was reached (high 7693.75) and its S1 at 7569.30 was missed by 1.45 points, while the traditional R1 was missed. Camarilla's R1 at 7628.19 actually sat below the traditional pivot, because the prior close was weak and Camarilla builds from the close. Its R3 and S3 at 7656.56 and 7571.44 are the levels Camarilla traders usually watch, and its R4 at 7699.11 landed almost on the traditional R1.
The CPR for that session ran from 7621.21 to 7635.63, a band 14.42 points wide. Because the prior close sat below its range midpoint, the formula's top central level came out below the bottom central level, so read CPR as the zone between the two numbers.
How pivot point types differed over 500 sessions
Measured across the same 500 sessions, the types separate cleanly:
| Pivot type | ES open on other side of Traditional P | ES median S1 to R1 band as share of P | ES median open to S1 as share of prior range | NQ open on other side of Traditional P | NQ median open to S1 as share of prior range |
|---|---|---|---|---|---|
| Traditional | 0 | 1.12% | 53.5% | 0 | 53.2% |
| Fibonacci | 0 | 0.85% | 45.7% | 0 | 46.3% |
| Woodie | 18 (3.6%) | 1.12% | 50.0% | 14 (2.8%) | 50.0% |
| Camarilla | 0 | 0.21% | 11.4% | 0 | 10.9% |
| DeMark | 88 (17.6%) | 1.12% | 49.7% | 90 (18.0%) | 50.4% |
The first column counts sessions where the open sat above one type's pivot and below the traditional pivot, or the reverse. Traditional, Fibonacci and Camarilla share the same pivot, so they never disagree. Woodie flipped the open's side in 18 ES sessions. DeMark flipped it in 88 ES and 90 NQ sessions, about one session in six, which means a DeMark user and a traditional user would read the day's bias differently that often.
The distance column is the one you feel in execution. Camarilla's S1 sat a median 11.4% of the prior range from the ES open, against 53.5% for the traditional S1. That is not a finer version of the same tool. Camarilla's inner levels are close enough to be tagged almost immediately, while traditional first levels are far enough away that reaching them is an event. Pick one type that fits your holding period and stay with it, because switching types moves the first level by a factor of four or five.
Pivot Point Trading Strategies
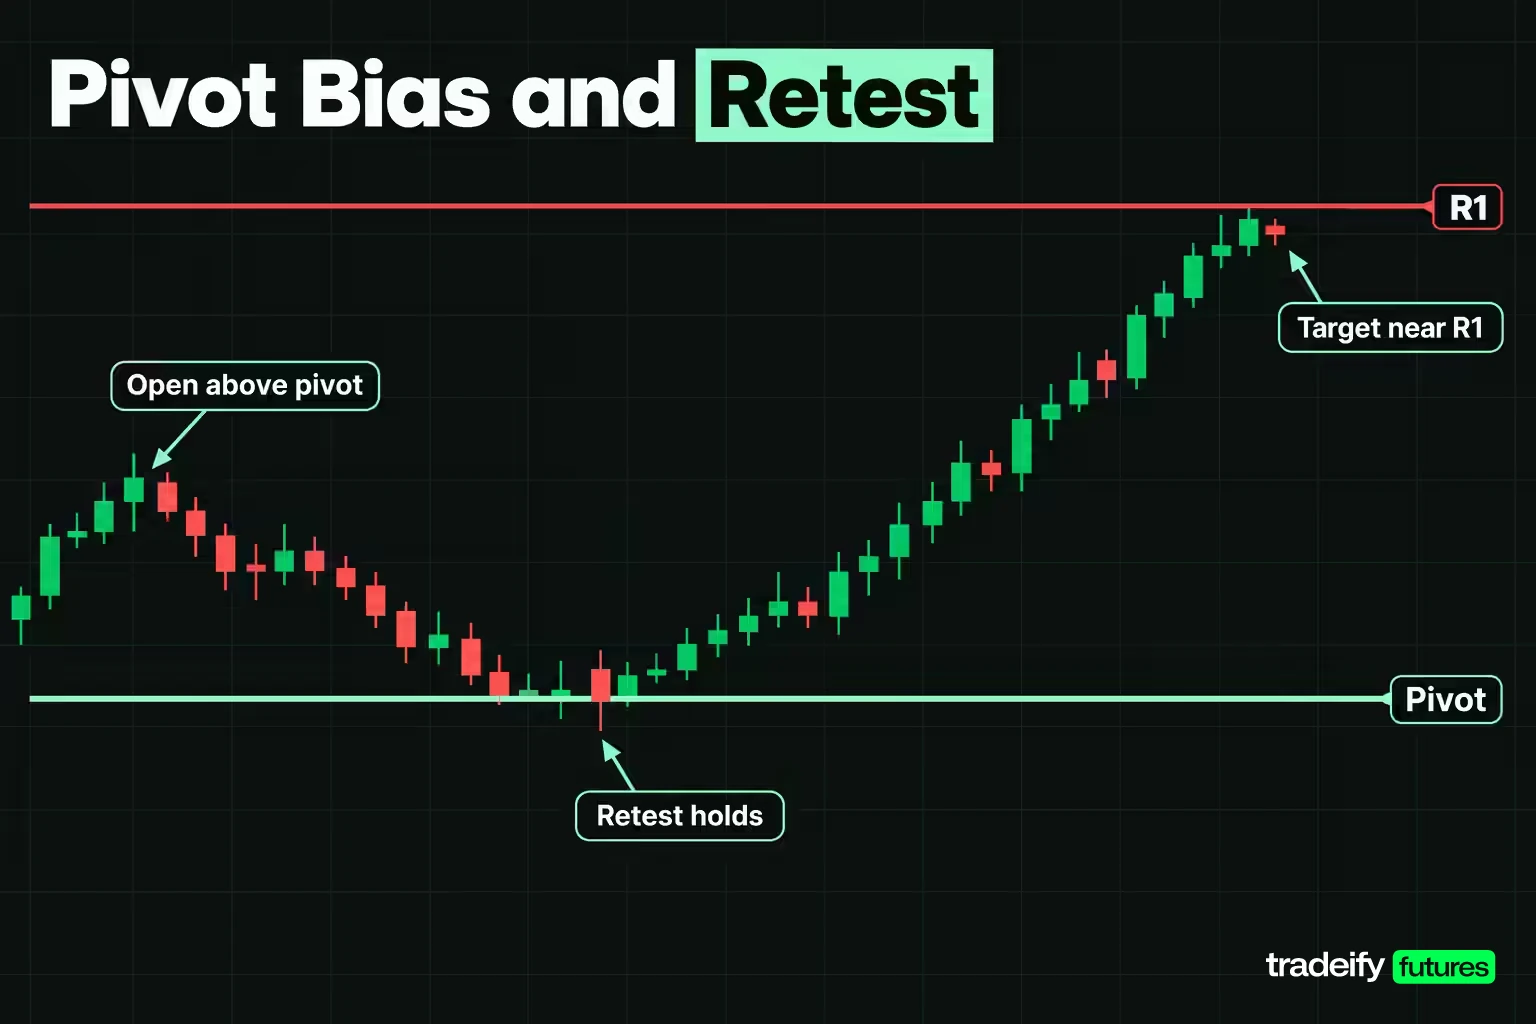
Most pivot point strategies reduce to four ideas. Each one below has a condition, what would confirm it, what would cancel it, and the base rate from 500 ES and NQ sessions (November 2024 to November 2026), so you can judge it on numbers rather than on a screenshot.
Pivot bias strategy
Condition: the session opens above the pivot (lean long) or below it (lean short). Confirmation: price holds that side after the first test. Invalidation: a sustained move back through the pivot.
Base rate (measured for this guide on Yahoo Finance daily bars, November 2024 to November 2026): when ES opened above the pivot (286 sessions), it closed above it in 188, or 65.7%. When it opened below (212 sessions), it closed below in 117, or 55.2%. NQ was similar at 67.7% and 57.6%. The bias has some value, more on the long side here, in a window where ES rose from 5958.25 to 7596.75. It is a lean, not a signal.
Pivot retest strategy
Condition: the open is on one side of the pivot and price pulls back toward it. Confirmation: a rejection at or near the pivot on your entry timeframe. Invalidation: a close on your entry timeframe through the pivot.
Base rate in the same study: after an above-pivot open, ES traded back down to the pivot in 199 of 286 sessions (69.6%). After a below-pivot open, it traded back up to the pivot in 172 of 212 (81.1%). So a retest is the normal case, not a rare gift. That also means chasing an early move away from the pivot often gets you filled right before the pullback you could have waited for.
First-level bounce or break strategy
Condition: price reaches R1 or S1. Confirmation for a bounce: rejection and a failure to hold beyond the level. Confirmation for a break: acceptance beyond it (a pullback that holds the level from the other side). Invalidation: whichever outcome the other side confirms.
Base rate (measured for this guide on Yahoo Finance daily bars, November 2024 to November 2026): first levels held on the close roughly half the time (47.5% for ES R1, 56.7% for ES S1). Neither outcome dominates, which is exactly why this strategy lives or dies on the confirmation step. Trading the level blind is trading a coin flip with costs attached.
Outer-level exhaustion strategy
Condition: price reaches R2 or S2 or beyond. The idea is that the session has stretched well past its expected range. Base rate in the same Yahoo Finance study: R2 and S2 were reached on about 12.6% to 20.6% of ES sessions. Because those days are rare and often driven by news, they are better for managing an open trade (taking profit, tightening risk) than for opening a fresh fade with nothing else behind it.
Trend following, mean reversion and breakout trading are the three broad families most trading strategies fall into. Pivot points slot into all three: the pivot bias is a trend tool, the first-level bounce is mean reversion, and the first-level break is a breakout.
Pivot Points on Daily, Weekly and Monthly Timeframes
Pivot points belong to the period they are calculated from, not to the chart interval you display them on. Daily pivots come from the prior session and last one session. Weekly pivots come from the prior week and last a week. Monthly pivots come from the prior month.
TradingView's Auto setting shows the usual pairing: daily pivots on charts up to and including 15 minutes, weekly pivots on charts above 15 minutes and below one day, and monthly pivots on daily charts and above. That matches how most traders use them. A day trader on a 5-minute chart watches daily pivots, a swing trader on an hourly chart watches weekly ones.
Higher-period pivots are useful context on an intraday chart. Using the week of October 26 to 30, the ES weekly high was 7819.50 (October 28), the low 7558.25 and the close 7614.00. That puts the weekly pivot for the week of November 2 at 7663.92, with weekly R1 at 7769.58 and weekly S1 at 7508.33. The daily pivot for November 2 sat 35.50 points below the weekly pivot, so a long trade from the daily pivot had a higher-timeframe level waiting overhead before R1.
Two settings decide whether your daily pivots match anyone else's:
- Session definition. A pivot from the full electronic session and one from regular trading hours use different highs, lows and closes. TradingView notes that its daily candle for futures uses Electronic Trading Hours.
- Close definition. TradingView notes that a futures daily close usually represents the settlement price, not the last trade, unless that option is turned off. Intraday-built pivots use the last trade instead, so the two can disagree.
Using Pivot Points With Other Levels and Markets
Pivot points are mechanical support and resistance. They do not care where the swing highs and lows are. That makes them a useful cross-check on levels you mark by hand: when a pivot and a hand-drawn level land within a few ticks of each other, the area deserves more attention than either alone.
Related lesson: Support and resistance
Against VWAP, the difference is the input. VWAP resets every session and moves with the volume traded, while pivot points are fixed before the open. A common read is that price holding above both the pivot and VWAP is a firmer bullish lean than either alone, and price stuck between them is a balance zone where neither has control.
Against Fibonacci retracements, the difference is reproducibility. A Fibonacci retracement depends on which swing you anchor, so two traders can draw different levels. Two traders running the same pivot formula on the same session data get the same seven numbers.
Against the opening range, the pivot and the first levels often sit near the early high or low, and that overlap is where many session-open decisions get made.
Pivot points are used across futures, forex and stocks. In forex, where trading runs around the clock, the session that defines the prior high, low and close becomes the key choice; a pivot built on a New York close and one built on a midnight UTC close are not the same levels. In futures, the same issue shows up as electronic versus regular-hours sessions.
Why Pivot Points Work at All
There is no hidden force in the pivot point formula. Pivot points work, when they do, for three plain reasons.
They anchor on the prior range. Most sessions overlap the session before (in Yahoo Finance daily bars from November 2024 to November 2026, the next range overlapped the prior one in 487 of 500 ES sessions), so a level derived from that range is likely to sit inside today's action. The pivot was reached in roughly three of four sessions here mostly because it sits near the middle of where price recently traded.
They are shared. Every major platform ships the same formulas, so many traders watch the same prices. Orders cluster around levels that are widely watched, which can produce reactions there.
They are reproducible. Unlike hand-drawn levels, two traders with the same data get the same answer, which makes pivot points easy to test on your own data.
The limit on that reasoning is the held data. In the same 500-session study, a first level that many people watch still closed through about half the time. Attention creates a reaction point, not a reliable turn.
Limitations of Pivot Points
Pivot points fail in recognisable ways, and most of them show up in 500 sessions of ES and NQ data.
- A touch is not a reaction. In this guide's 500-session study of Yahoo Finance daily bars, ES R1 closed through in 116 of 221 sessions where it was reached. A level that gets traded through half the time cannot be an entry signal on its own.
- Gap opens strand the levels. In the same study, on 27 of 500 ES sessions and 30 of 500 NQ sessions, the open landed outside the S1-to-R1 band, about 5% to 6% of sessions. On those days the inner levels sat behind price from the first tick, and they cluster around news and gap opens.
- The type and session are invisible on the chart. Two platforms can print the same R1 label at different prices because of a different type, session or close definition. Levels copied from someone else's screen may not be yours.
- Outer levels are rare. In the same study, R3 was reached in 4.0% of ES sessions. A plan built around outer levels spends most days waiting.
- Contract rolls distort continuous data. A continuous front-month series stitches contracts together, and two years of ES data span eight quarterly rolls. Pivots built across a roll compare two different contracts, so check that your prior bar is the contract you trade.
- They ignore volume and trend. A pivot level from a quiet session and one from a news-driven session look the same on the chart.
The fix for all of these is the same: treat pivot points as a map of where decisions come due, and let price behaviour at the level make the decision.
How to Add Pivot Points to a Chart
Most platforms include pivot points as a built-in indicator. The settings that matter are the same everywhere: the type, the period, and the data the period is built from.
TradingView (Pivot Points Standard):
- Type: Traditional, Fibonacci, Woodie, Classic, DM or Camarilla.
- Pivots Timeframe: Auto, or a fixed daily, weekly or monthly period.
- Number of Pivots Back: how many past periods to draw (default 15).
- Use Daily-based Values: on by default, which keeps intraday and daily pivots consistent; turn it off to build futures pivots from regular trading hours instead.
NinjaTrader 8 (Pivots):
- Pivot range: Daily, Weekly or Monthly.
- HLC calculation mode: calculate from intraday data, use daily bars, or enter user-defined high, low and close values.
The user-defined mode is worth knowing. If you calculated the levels yourself from a specific session definition, you can type the inputs in and make the chart match your numbers rather than the other way round.
Related lesson: Multiple timeframe analysis
A Pivot Point Routine Before the Open
Five steps, all arithmetic you can finish before the session starts.
- Pull the prior high, low and close for the contract you actually trade, from the session definition your chart uses.
- Calculate the seven traditional levels and write them down rather than reading them off a chart, so you know the inputs.
- Locate the prior close in the prior range: bottom, middle or top third. That tells you which first level is near.
- Rank the levels by reachability: the pivot first, then whichever of R1 and S1 is nearer the open, then the other first level, with second and third levels as context.
- Decide what a reaction at each ranked level has to look like before you act, set the stop beyond the level, and size from the stop.
Related lesson: Position sizing
On our accounts, the trading day runs 6:00 PM to 5:00 PM ET and every position is closed by 4:45 PM ET, with no overnight holds. That lines up with daily pivot points: the levels you mark before the session expire with it, and no position carries into the next set. Our accounts connect to TradingView through Tradovate and to NinjaTrader with Tradovate credentials, so both built-in pivot indicators are available.
Pivot Points FAQ
What do pivot points do?
Pivot points give you a set of support and resistance levels calculated before the session from the prior high, low and close. They show where price may pause or turn and which side of the pivot the session is leaning. They do not predict direction on their own.
What does pivot mean in trading?
A pivot is the level a market turns on. In pivot point analysis it is the average of the prior session's high, low and close, and it splits the session into an upper and a lower half. Trading above it is usually read as a bullish lean, and trading below it as a bearish lean.
Which pivot point type is best?
No type is best in general. Traditional and Fibonacci suit traders who want levels far enough from the open to matter as targets, while Camarilla suits very short-term traders who want levels near the open. Pick one and stay with it, because types disagree enough to change your plan.
Do pivot points work for day trading?
Yes, pivot points work for day trading as a planning tool, because daily pivots are recalculated every session. In a 500-session ES study on Yahoo Finance daily bars, the pivot was reached 74.6% of the time and the first levels about 44%. They work best as a plan for where decisions come due, combined with a reaction on your own chart.
What is the 3-5-7 rule in trading?
The 3-5-7 rule is an informal risk guideline that caps risk at 3% of the account per trade and combined open risk at 5%. It is a rule of thumb, not an industry standard. The 7 is the least consistent part: some use it as a 7% profit target, others as a reminder to make winners larger than losers.
What are the top 3 trading strategies?
Trend following, mean reversion and breakout trading are the three strategy families most methods belong to. Trend following trades in the direction of an established move, mean reversion fades stretched moves back toward an average, and breakout trading enters when price leaves a range. Pivot points fit all three: the pivot side as a trend lean, a first-level rejection as mean reversion, and a first-level break with acceptance as a breakout.
Trading futures involves substantial risk of loss, leverage means losses can exceed what you expect, and funded and evaluation accounts are simulated. The figures here are measurements of historical data and worked arithmetic, not predictions or investment advice.


