



TL;DR: Multiple timeframe analysis reads one market on two or three charts and gives each chart a single job. The higher chart sets direction, the middle chart finds the location, and the lowest chart times the entry. Space the charts about four to six times apart and stop at three, because extra charts add vetoes, not information. The chart your stop comes from sets your position size, so choose it before you see the size you want.
A single chart answers one question well and two questions badly. That gap is where a lot of good reads turn into bad trades. Ask a 3 minute chart which way the market is trending and it will tell you about the last half hour. Ask a daily chart where to enter and it will hand you a stop so wide the position barely exists.
Multiple timeframe analysis splits those questions across charts so direction and timing stop competing for the same decision. The higher chart decides which side you are allowed to look at. The lower chart decides the exact price, and the price where you are wrong.
That second half is the part most traders skip. A stop is a price, and the price you choose comes from one specific chart. The chart you take the stop from is the chart that sets your size, which makes timeframe choice a risk decision before it is a chart decision.
What Multiple Timeframe Analysis Means
Multiple timeframe analysis is the practice of reading the same instrument on charts of different bar lengths, for example a 60 minute, a 15 minute and a 3 minute chart of the same futures contract, and combining what each one shows into one trade decision. The market is the same on every chart. What changes is how much history each bar compresses and how much noise each bar hides.
A workable ladder gives each chart exactly one job.
- Bias chart. Answers up, down or sideways, and nothing else. You are not hunting for entries here.
- Setup chart. Answers where, inside that direction, price is offering a location worth acting on, such as a pullback into a level, a range edge or a retest.
- Entry chart. Answers the exact trigger price and the level that proves the idea wrong. This is the chart that produces the stop.
If two charts do the same job, one of them is decoration. A fourth chart does not add a fourth job either. It adds a fourth veto, and a veto with no job attached produces hesitation rather than patience.
Some traders call this top-down analysis, because the routine starts on the slowest chart and works down. The name matters less than the order. Reading the entry chart first tends to bias everything after it, since a trader who has already seen a tempting trigger will read the higher chart looking for permission rather than information.
Related lesson: Market structure
Why Traders Read More Than One Timeframe
The case for reading more than one timeframe is practical. Each benefit is a specific mistake the method is designed to catch, and each one shows up in a trading journal as a type of loss you stop taking.
- Trend context. A sell signal on a 3 minute chart looks very different when the 60 minute chart is printing higher highs and higher lows. The higher chart tells you whether that signal is a reversal or just the next pullback in an uptrend.
- Fewer countertrend entries. Most lower-chart signals that fail against the larger trend look identical to the ones that work. Requiring the higher timeframe to agree on direction removes a whole category of trades before they happen.
- Better located stops. A level that shows up on the setup chart usually carries more weight than a wiggle on the entry chart. Knowing both lets you pick the stop on purpose.
- Fewer noise trades. Short charts fire signals constantly. A higher timeframe filter cuts the count, which also cuts commissions and the number of decisions made while tired.
- Clearer targets. The next level on the higher chart is a natural target, so the trade has a reason to exit as well as a reason to enter.
The honest limit belongs here too. A higher timeframe filter changes which trades you take; it does not make the market predictable. The charts can line up perfectly and the trade can still lose, because agreement on direction says nothing about whether the next move starts before your stop is hit.
Higher Timeframe Analysis for Direction and Levels
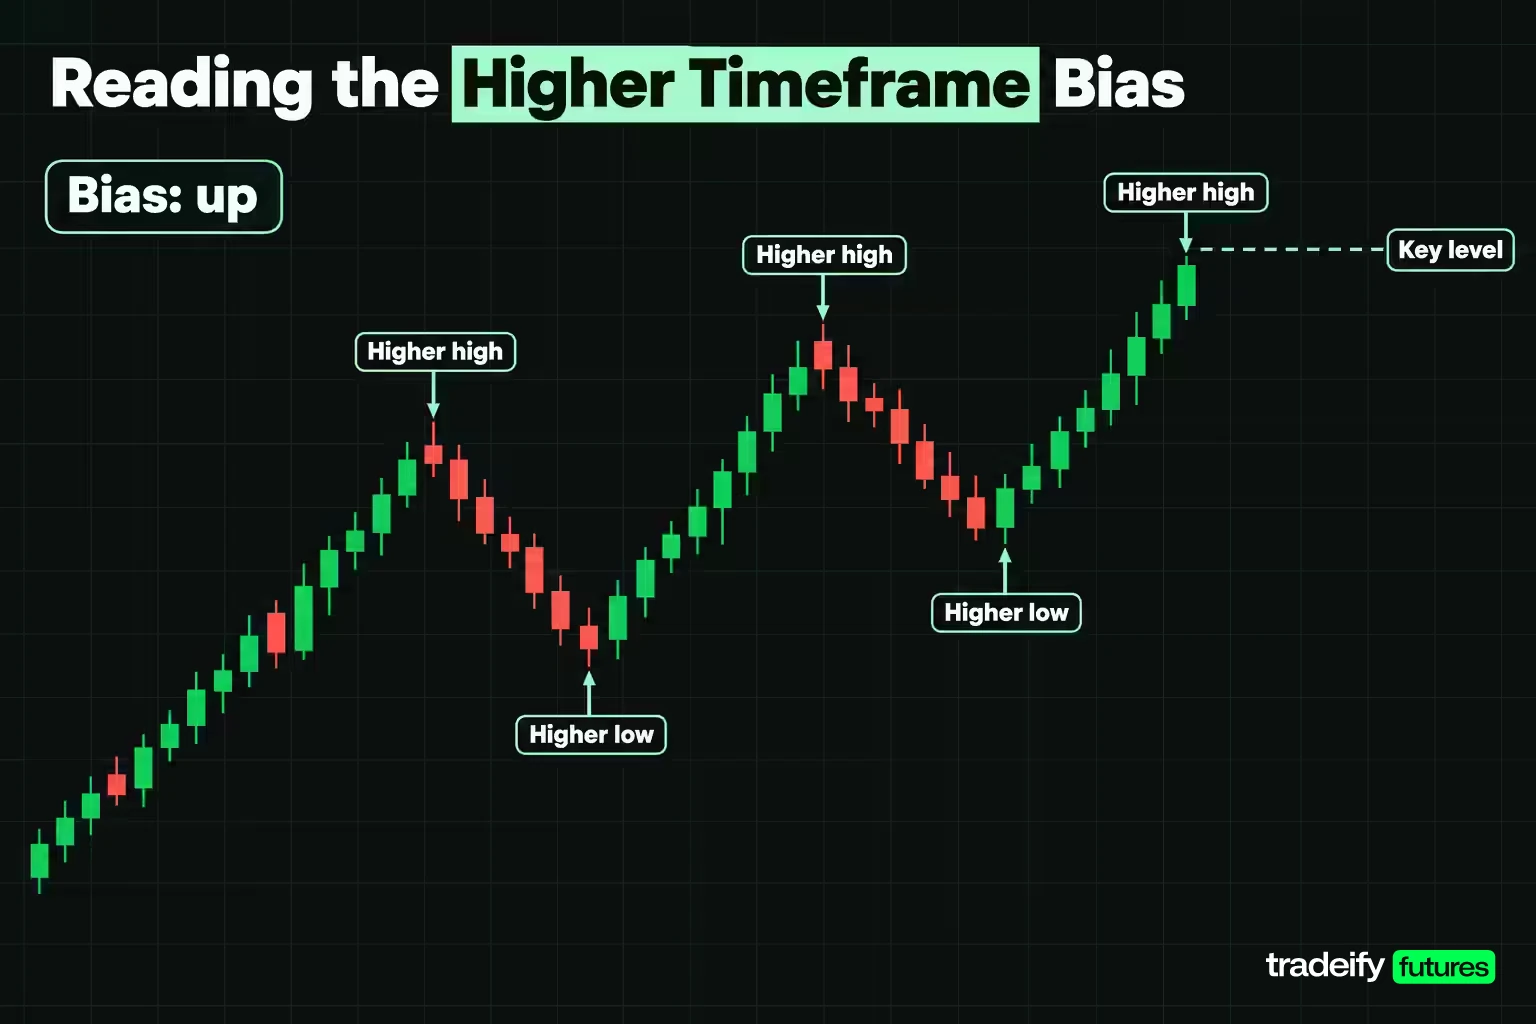
Higher timeframe analysis has two outputs: a one-word bias and a short list of levels. Anything more than that on the slow chart is usually procrastination.
For the bias, read swing structure. A sequence of higher highs and higher lows is up. Lower highs and lower lows is down. Overlapping swings that fail to extend either way is sideways, and sideways is a reading in its own right, not an absence of one. When the higher chart is sideways, breakouts on the lower chart become less reliable and the edges of the range become the places worth watching.
For the levels, mark the prices where the higher chart turned: the last clear swing high and swing low, the edges of any range, and prior-session highs and lows if you trade intraday. These are the prices a lot of traders on slower charts are also watching, which is why reactions there tend to be sharper.
Then stop looking. The higher timeframe is not where you hunt for entries. Its bars are too long; by the time a 60 minute candle confirms a reversal, the move it confirms may already be most of the way to your target. The slow chart grants permission and sets the map. The faster charts do the work.
One practical test: write the bias down before opening the next chart. If you cannot say it in one word, the higher timeframe is telling you it has no strong view, and the plan should shrink (smaller size, range tactics, or no trade) rather than borrowing a view from a faster chart.
Related lesson: Dow theory
Stacked Levels and Patterns Across Timeframes
A stacked level is a price that matters on more than one timeframe at once. A breakout level on the 60 minute chart that also lines up with a 15 minute swing high turned support is a stronger location than either on its own, because traders working off both charts have a reason to act there.
To find stacked levels, mark levels from the slowest chart first and carry them down. Then look for lower-chart structure that sits on, or very close to, those prices. Take an illustrative ES chart where 5,000.00 is both the 60 minute breakout level and an old 15 minute swing high. A pullback into 5,000.00 is no longer just a pullback. It is price returning to a level two groups of traders already care about, and that overlap is what turns it into a setup.
Patterns stack the same way. A pullback that forms a small bull flag on the 15 minute chart while price sits on 60 minute support is a pattern inside a location. The flag on its own is common. The flag at a level that matters on the higher chart is the setup.
Ranking helps when a chart is full of lines:
- Levels visible on the bias chart and the setup chart.
- Levels visible on the setup chart only.
- Levels visible only on the entry chart, which are mostly useful for stop placement, not for choosing where to trade.
A stack is a zone, not a laser line. Two charts rarely agree to the tick, so treat the overlap as an area a few ticks wide and let the entry chart show you what price does inside it.
Related lesson: Support and resistance
How Many Timeframes to Use and How Far Apart
Two timeframes are enough to start and three is a practical ceiling. Beyond three, each added chart sits close enough to its neighbour that it mostly disagrees about timing, which is worse than useless because it gives you another reason to hesitate without telling you anything new.
The spacing rule most traders quote is to keep each chart roughly four to six times the length of the next one down. The reason is simple. A chart too close to its neighbour sees the same swings, so its agreement is not independent evidence. A chart too far away shares no context with the entry chart, so its reading has nothing to say about a trade held for minutes.
Elder's Triple Screen and the Factor of Five
The best-known formal version of this idea is Alexander Elder's Triple Screen trading system, which he first presented in an April 1986 article in Futures magazine and later described in his book The New Trading for a Living. Elder starts from the chart you like to trade, calls it the intermediate timeframe, and pairs it with a long-term chart about five times longer. He calls this the factor of five.
His screens run in a fixed order:
- First screen, the long-term chart. Decide to be a bull or a bear using a trend-following tool. His original version used the slope of the weekly MACD-Histogram, and he later moved to the slope of a weekly exponential moving average.
- Second screen, the intermediate chart. Use an oscillator to find waves against that tide, such as daily declines inside a weekly uptrend.
- Third screen, the entry technique. Time the order inside that countertrend wave, on the intermediate chart or a shorter one.
Elder's own day-trading examples keep the same ratio: a 25 or 30 minute chart for the long-term screen with a 5 minute chart for tactics, and a 2 minute chart where a shorter screen is needed. He also suggests a neat combination for US stocks. The cash session runs 9:30 AM to 4:00 PM ET, which is 390 minutes, so a 39 minute chart divides the day into 10 bars and an 8 minute chart sits about five times faster underneath it.
The spirit matters more than the exact multiplier. Rounding is fine. A 4 to 6 times step and a factor of five describe the same band.
Where Timeframe Spacing Breaks Down
The ratios work cleanly on paper and less cleanly on real sessions. This table shows common ladders and where each one strains.
| Chart ladder | Spacing between charts | Where the spacing strains | Practical fix |
|---|---|---|---|
| 1 minute, 5 minute, 15 minute | 5 times, then 3 times | The 15 minute chart is too close to the 5 minute chart to add independent context | Move the bias chart up to 60 minutes |
| 3 minute, 15 minute, 60 minute | 5 times, then 4 times | Works inside a session, but the 60 minute bias can flip within one day | Treat the bias as intraday only |
| 15 minute, 60 minute, daily | 4 times, then 6.5 times on a 390 minute session | The daily bar on a futures chart also contains the overnight session the hourly cash-hours chart never showed | Decide whether your daily bar means the full session or cash hours, and keep it consistent |
| 60 minute, daily, weekly | about 6.5 times, then 5 times | A weekly bar can carry several news events while the entry chart shows a few days | Use for multi-day holds only |
| 1 minute, 60 minute, weekly | 60 times, then far more | No shared context; the weekly reading has nothing to say about a trade held for minutes | This ladder is not a method |
The last row is the one to remember. A 1 minute chart paired with a weekly chart is not an aggressive version of the method. It is two unrelated datasets, and any agreement between them is a coincidence.
Timeframe Combinations by Trading Style
The right combination is the one whose middle chart matches how long you actually hold a trade. A ladder whose setup chart needs attention every 15 minutes is not a swing method, whatever the label says.
| Trading style | Typical hold | Bias chart | Setup chart | Entry chart |
|---|---|---|---|---|
| Scalping | Seconds to a few minutes | 15 minute | 3 minute | 1 minute or tick chart |
| Day trading | Minutes to a few hours | 60 minute | 15 minute | 3 minute or 5 minute |
| Intraday with a daily bias | A few hours inside one session | Daily | 60 minute | 15 minute |
| Swing trading | Days to a couple of weeks | Weekly | Daily | 60 minute |
| Position trading | Weeks to months | Monthly | Weekly | Daily |
These are starting points, not rules. Pick one combination and keep it for a meaningful sample, at least 30 trades, before judging it. Switching ladders after every loss is the fastest way to make your journal useless, because every trade ends up measured with a different ruler.
Scalpers face a specific trap. On very short charts, a stop derived from a 1 minute swing is often inside ordinary noise. If the stop keeps getting tagged by random wiggles, move the entry chart up one step rather than squeezing the stop tighter.
Related lesson: Day trading vs swing trading
Aligning Timeframes for Entry Confirmation
Alignment advice often turns into waiting for every chart to point the same way at the same moment. On a three-chart ladder that condition is uncommon, and demanding it produces two bad habits: no trades at all, or a looser definition of "aligned" every time impatience sets in.
A stricter and more useful split is permission versus action.
- The bias chart grants permission to look in one direction. It can also withdraw that permission.
- The setup chart names the location and the condition that has to happen there.
- The entry chart is the only chart that authorises the order, and it does so with a trigger price and a stop, not with an opinion.
Under that split, disagreement between the bias chart and the entry chart is not a paradox. It is the normal state of a pullback: the entry chart is falling while the bias chart is still up. Alignment arrives when the entry chart stops falling and turns back in the bias direction at the location the setup chart named. That turn is the confirmation. Seeing price at the level is only the observation.
Break of Structure Across Timeframes
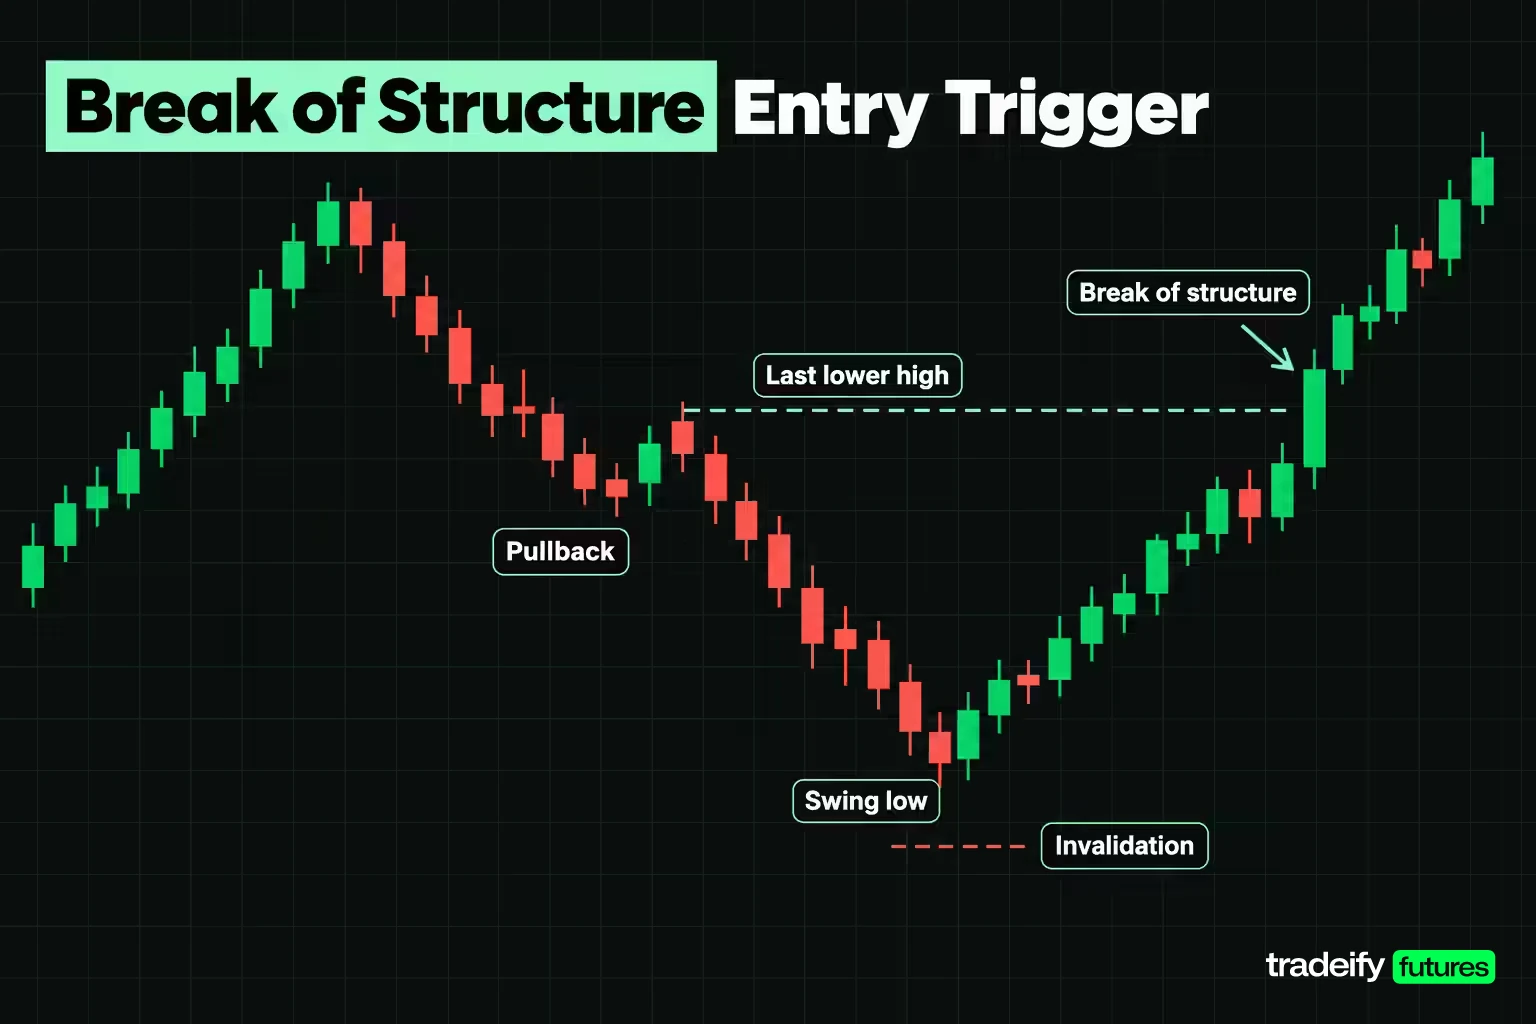
A break of structure is the moment price takes out the swing point that defined the previous move. In an uptrend pullback on the entry chart, price prints lower highs on the way down. When it then breaks above the most recent lower high, the entry chart's structure has flipped back in line with the higher timeframe.
That lower-timeframe break is one of the cleanest confirmation triggers in multiple timeframe trading, because it has a built-in invalidation: the swing low that formed just before the break. If price falls back below that low, the turn failed.
Two cautions keep it honest. First, a break on the entry chart against the bias chart is a pullback signal, not a reversal, until the setup chart breaks too. Second, a break on the 60 minute chart often arrives long after the 3 minute chart already showed it, so waiting for every timeframe to break before acting usually means entering late, at a worse price, with a wider stop.
Related lesson: Break of structure
Using Indicators on Multiple Timeframes
Indicators can carry the same jobs across charts: a trend tool on the bias chart, an oscillator on the setup chart, price structure on the entry chart. That division is essentially Elder's Triple Screen, and it works better than running the same indicator three times.
The reason is arithmetic. A 20 period moving average on a 60 minute chart covers 1,200 minutes of price. On a 15 minute chart, the same span is an 80 period average, and on a 3 minute chart it is a 400 period average. The values will not be identical, because the averages sample different closes, but they describe roughly the same stretch of the market. Plotting a 20 period average on all three charts does not give you three confirmations; it gives you three different lookbacks, and only one of them was chosen on purpose.
Practical ways to use common indicators across a ladder:
- Moving averages. Use the slope of one average on the bias chart as the direction rule. If you want that same line on the entry chart, scale the period rather than copying the number.
- RSI. On the setup chart, a pullback that pushes RSI toward its lower band inside a higher-timeframe uptrend marks a wave against the tide. RSI that stays pinned in an extreme on the bias chart often means a strong trend, not a reversal.
- MACD. The histogram's slope on the bias chart is a simple, rule-based way to read direction, which is how the Triple Screen began.
The trap is indicator voting. If three charts each show the same oscillator, they are not independent witnesses; they are three views of one calculation. Pick one indicator per job, and let price structure on the entry chart make the final call.
Related lesson: Moving averages
What to Do When Timeframes Disagree
Disagreement between timeframes is the normal case, so the plan needs a written sentence for it rather than a mood. These four conflicts cover most of what you will see.
- Bias chart down, setup chart offering a long. The setup is countertrend until the bias chart changes. Either trade it as a reversal with reduced size and a near target, or skip it.
- Bias chart up, entry chart printing a short trigger. The entry chart is describing a pullback inside an uptrend, not a downtrend. Do not flip the bias; wait for the pullback to finish and look for the long.
- Bias chart sideways. Breakouts are less reliable and range edges more informative, so read the entry chart at the edges and ignore the middle.
- All charts agree, but price is already far from the level. The direction is right and the location is poor. This is one of the most common ways a correct read loses money, because the stop has to sit far away or at a random price.
Should the higher timeframe always win? It should control direction. It should not automatically control the stop. The entry chart is the only place that can tell you the idea is failing right now, and the setup chart is usually where the idea is fully wrong. Which of those you use is a sizing decision. A stop from the entry chart allows a bigger position than a stop from the setup chart, so the stop timeframe has to be chosen before the size is calculated, not after.
Write the rule for each conflict before the session starts. A rule written during the trade is usually a justification for the position you already want.
Multiple Timeframe Analysis for Day Trading Futures
Multiple timeframe analysis for day trading futures has one wrinkle that stock-focused guides skip: the futures trading day is not the stock market's trading day.
E-mini S&P 500 futures (ES) trade on CME Globex from Sunday 6:00 PM to Friday 5:00 PM ET, with a daily maintenance break from 5:00 PM to 6:00 PM ET. That makes a full session 23 hours, or 1,380 minutes, which is 23 bars on a 60 minute chart. The NYSE core session, by contrast, runs 9:30 AM to 4:00 PM ET, or 390 minutes, which is 6.5 hourly bars.
So "the daily chart" means two different things depending on your chart settings. A full-session daily bar includes overnight trading. A cash-hours daily bar does not, and it opens with a gap whenever the overnight session moved. Neither is wrong, but mixing them (a full-session daily bias with cash-hours intraday charts) quietly changes where your levels sit.
Practical choices for intraday futures traders:
- Decide whether your levels come from the full session or cash hours, and set every chart in the ladder the same way.
- Mark the overnight high and low separately. They are often the first levels tested after the cash open.
- On a 390 minute session, Elder's 39 minute and 8 minute pairing fits neatly, giving 10 bars a day on the slower chart. A 60 minute, 15 minute and 3 minute ladder also works and gives 26 bars on the 15 minute chart over cash hours.
- Expect the first 30 minutes after the cash open to distort the entry chart. Many day traders let the setup chart print a bar or two before trusting any lower-timeframe trigger.
For a day trader, the weekly chart is rarely relevant. A quick look at the daily chart for context is enough, and the real bias comes from the 60 minute chart.
A Worked Timeframe Example on ES Futures
This worked timeframe example uses round, illustrative ES prices to show the routine step by step. They are not a record of any real session.
ES moves $50 per index point, and its minimum tick of 0.25 points is worth $12.50. The Micro E-mini (MES) moves $5 per point, with the same 0.25 point tick worth $1.25. Ten MES contracts carry the same point value as one ES.
The ladder is 60 minute bias, 15 minute setup, 3 minute entry.
- Bias chart, 60 minute. Higher highs and higher lows through the morning, with a breakout above 5,000.00 earlier in the session. Bias: up. The prior 60 minute swing high sits at 5,029.00, which becomes the target.
- Setup chart, 15 minute. Price pulls back into 5,000.00, which is both the 60 minute breakout level and an old 15 minute swing high. That stacked level is the location. The 15 minute pullback low so far is 4,991.00.
- Entry chart, 3 minute. During the pullback the 3 minute chart prints lower highs. Price holds above a 3 minute swing low at 4,999.00, then breaks above the most recent lower high at 5,003.00. That break of structure is the trigger, and the long entry is 5,003.00.
At this point the analysis has said what and where. It has not said how much. On this trade the 3 minute swing low, the 15 minute pullback low and the 60 minute swing low are all valid stops, and each one implies a very different position size. Deciding which chart owns the stop is the last step of the analysis, not an afterthought.
Related lesson: Price action trading
Stop Placement and Position Size by Timeframe
Stop placement is where multiple timeframe trading turns into money. Using the illustrative ES long at 5,003.00 from the worked example (60 minute uptrend, 15 minute pullback into a stacked 5,000.00 level, 3 minute break of structure), each chart offers a different invalidation level. Assume a 1 point buffer beyond each swing low and a fixed risk budget of $500 per trade.
| Stop taken from | Stop price with 1 point buffer | Distance from 5,003.00 | Risk per ES | Risk per MES | Size inside $500 | Actual risk | Reward to the 5,029.00 target |
|---|---|---|---|---|---|---|---|
| 3 minute swing low 4,999.00 | 4,998.00 | 5.00 points (20 ticks) | $250 | $25 | 2 ES | $500 | 5.2 times risk |
| 15 minute pullback low 4,991.00 | 4,990.00 | 13.00 points (52 ticks) | $650 | $65 | 7 MES | $455 | 2 times risk |
| 60 minute swing low 4,976.00 | 4,975.00 | 28.00 points (112 ticks) | $1,400 | $140 | 3 MES | $420 | 0.93 times risk |
Read the table as three different trades that happen to share an entry.
The 3 minute stop allows 2 ES, the same exposure as 20 MES, and offers 5.2 times the risk to the target. It also sits inside the pullback, so ordinary noise can tag it before the setup has really failed.
The 15 minute stop allows 7 MES, less than half the exposure, and offers 2 times the risk. It sits below the low that defines the setup, so if it is hit the idea genuinely failed.
The 60 minute stop is so far away that the 26 point target is smaller than the 28 point stop. At that distance the trade does not fit the plan, and the honest answer is to pass.
The Cost of Mixing Stop Timeframes
The expensive mistake is sizing from one chart and defending another. Size 2 ES from the 3 minute stop, then decide in the moment that the "real" stop is the 15 minute low, and the loss at 4,990.00 is 13 points times $50 times 2 contracts, or $1,300. That is 2.6 times the $500 budget, from a trade that was never wrong on analysis.
Nothing about the entry caused that. The stop moved to a different chart after the size had been set by the first one.
The rule that prevents it is short. Choose the stop timeframe before you calculate size, write it down, and let the other levels serve as targets or as reasons to skip. If you want the wider 15 minute stop, trade the 7 MES size it allows. That is not timidity. It is the only version where the risk number and the reason for the trade refer to the same price.
Related lesson: Position sizing
Common Timeframe Mistakes and False Signals
Most multiple timeframe losses come from decision errors rather than missing knowledge. Each has a rule that catches it.
| What it looks like | What is actually happening | The rule that catches it |
|---|---|---|
| The higher chart is up, so I buy the dip right now | The bias is correct, but the entry chart has not shown the pullback ending | Require a lower-timeframe break of structure before entering |
| More charts mean more confirmation | Charts spaced closely repeat each other and add vetoes, not evidence | Cap the ladder at three charts spaced about four to six times apart |
| I could not find agreement, so I checked a fourth chart | Timeframe shopping for a chart that agrees with the trade you want | Fix the ladder before the session and do not add charts mid-trade |
| Both levels are close enough, so either stop will do | The two stops imply very different sizes and very different risk | Pick the stop timeframe first, then size from it |
| No signal on the higher chart, so there is no bias | Sideways is a reading that favours range edges over breakouts | Switch tactics, not charts, or stand aside |
| The 3 minute chart reversed, so the trend is over | A lower-timeframe break against the bias is usually a pullback | Wait for the setup chart to break before calling a reversal |
| I keep freezing because the charts never fully line up | Analysis paralysis from demanding perfect alignment | Use permission versus action, not unanimity |
False signals deserve a separate word. A lower-timeframe trigger that fires in the middle of a range on the higher chart is the classic false signal in multiple timeframe trading. It looks identical to a good trigger, and the only thing that separates them is location. That is why the setup chart's job matters: it decides where a trigger is worth taking.
Related lesson: Trading journal
What the Evidence Says About Timeframe Filters
Timeframe agreement sounds obviously useful, and it is easy to overstate. The published evidence supports a narrower claim.
On technical analysis in general, Cheol-Ho Park and Scott Irwin's 2007 review in the Journal of Economic Surveys counted 95 modern studies: 56 found positive results for technical trading strategies, 20 negative and 19 mixed. They also warned that most studies suffer from testing problems such as data snooping and choosing rules after the fact. In plain terms, a rule that looks good in hindsight often looks good because it was picked in hindsight.
On timeframe filters specifically, a 2026 SSRN preprint by Raghav Goswami tested taking a 5 minute signal on ETH/USDT only when the 15 minute chart agreed, using one year of KuCoin data from April 2025 to April 2026. Without the filter, the strategy made 1,969 trades with a profit factor of 0.106 and a maximum drawdown of 99.17%. With the filter, it made 9 trades, with a profit factor of 0.722 and a maximum drawdown of 1.46%. Both versions still lost money (a profit factor under 1), and the author reports p = 0.687 on the nine trades and says the sample is too small to draw firm conclusions.
Read together, the evidence says a higher timeframe filter mostly works by removing trades, especially noisy ones. It does not turn a losing signal into a winning one by itself. The way to know whether your ladder helps is to fix it in advance and judge it on your own sample, not to keep adjusting it after each result.
A Six Step Timeframe Routine Before Each Trade
Run these steps in order so each timeframe narrows the next one.
- Open the bias chart and write one word: up, down or sideways.
- Open the setup chart and mark the levels that matter inside that direction, starting with any that stack with the bias chart.
- Open the entry chart and wait for the condition you wrote down, such as a break of structure at the level. If it does not happen, there is no trade.
- Name the stop timeframe and the invalidation price. Write both down.
- Divide the risk budget by the stop's dollar risk per contract and round down. If the result is below one contract of the smallest size you trade, the setup does not fit the account.
- Log the levels from each chart, the stop you chose, the size and the result. After 30 trades, your own record will show which stop timeframe served you better.
Step four is the one most traders never write down, and it is the one that decides the size. If you only adopt one habit from this routine, make it that one.
On our accounts, every position has to be closed by 4:45 PM ET on regular trading days, and nothing is held overnight or over a weekend, so a daily chart can set the bias but the trade itself has to start and finish inside one session. Our contract limits are set in minis and micros (for example 4 minis or 40 micros on a 50K account, with 10 micros counting as one mini), which is why choosing the stop timeframe first and then sizing in MES or ES is a natural fit. If you use WealthCharts with us, it supports custom tick, minute, hour and day timeframes and a Chart Replay mode, which makes it practical to build a 39 minute and 8 minute ladder and rehearse the routine on historical data.
Related lesson: Technical analysis complete beginner guide
Multiple Timeframe Analysis FAQ
What is multiple timeframe analysis in simple terms?
It is reading the same market on two or three charts of different bar lengths. The higher chart sets direction and the lower chart times the entry and provides the stop.
How many timeframes should I use?
Two is enough to start and three is a practical ceiling. More charts mostly add reasons to hesitate, because closely spaced charts repeat each other and disagree only about timing.
What is the 3 time frame trading strategy?
It assigns three roles: a higher chart for the trend, a middle chart for the location, and a lower chart for the trigger. A common intraday version is 60 minute, 15 minute and 3 or 5 minute charts.
What is the best timeframe combination for day trading?
The best day trading timeframe combination is the one whose middle chart matches your holding time, with charts about four to six times apart. Many futures day traders use 60 minute, 15 minute and 3 minute charts, or a 39 minute and 8 minute pair on the 390 minute cash session.
Should the higher timeframe always win when charts disagree?
The higher timeframe should decide direction when charts disagree. It should not automatically decide the stop, because the chart the stop comes from sets the position size, so the stop timeframe has to be chosen on purpose before the trade.
Does multiple timeframe analysis work?
It works as a filter that removes many low-quality trades, but research on timeframe filters is thin and small-sample. Judge your own ladder over at least 30 trades before trusting it.
This article is general education about reading charts on more than one timeframe, not investment advice or a recommendation to trade any product. Futures are leveraged, losses can exceed what you expect, and a fast market can fill a stop well past its price. Evaluation and funded accounts at prop firms are simulated, and simulated results do not guarantee future results. All prices, levels and sizes in the worked example are illustrative.


