



TL;DR: Support and resistance are price zones where buying or selling previously stopped a move, not exact lines that must hold. Draw them from dated swing points, size the zone from the chart's average range, and judge each test by the close. A wick through the zone is a test; a close beyond its far edge is a break. Put stops beyond the zone, never on the level.
What Support and Resistance Mean
Support and resistance are the two most common ways traders mark where a market has changed direction before. Support is a price area where a decline stopped because buyers absorbed the selling. Resistance is a price area where an advance stopped because sellers absorbed the buying.
Traders often call them a floor and a ceiling. That shorthand is fine until you have to put money behind it, because a floor in a building is guaranteed to hold and a support level is not.
A support or resistance level is a record of past behaviour. It matters today only if enough of the participants who caused that stop are still positioned the same way, or if new participants watch the same price. When the market closes through a level and stays there, the level has not "failed". It has changed meaning.
That framing changes how you use support and resistance. You stop asking "will it hold?" and start asking three narrower questions:
- Where exactly did the turn happen, and how wide was the area?
- How recently was the level tested, and how did the closes behave?
- What price action would prove the read wrong?
Related lesson: Price action trading
Why Support and Resistance Levels Form
Support and resistance levels form for two reasons that reinforce each other: memory and resting orders.
Memory is the behavioural part. Traders who bought at a level and watched price rally often add there again if price returns. Traders who sold too early, or missed the move, often treat the same price as a second chance. Traders who bought near a top and sat through a drawdown often sell when price comes back to their entry, just to get out flat. Each group gives the old price a reason to matter again.
Resting orders are the mechanical part, and they are better documented. Carol Osler's study of stop-loss and take-profit orders at a large foreign exchange dealing bank, published as a Federal Reserve Bank of New York staff report in April 2001 and in the Journal of Finance in 2003, found that the requested execution prices of those orders were strongly clustered at round numbers, which are often used as support and resistance levels.
The study also found that take-profit orders and stop-loss orders cluster differently. Osler used that difference to explain two familiar observations: trends tend to reverse at predictable support and resistance levels, and trends tend to gain momentum once those levels are crossed.
Two practical conclusions follow:
- Levels are not superstition. Real orders sit around them, which is why price often reacts there.
- The clustering is predictable, so a stop placed exactly on an obvious level sits among many similar stops. When those stops trigger together, they can push price through the level quickly.
Horizontal Levels From Swing Highs and Lows
Horizontal support and resistance is the classic version: a flat price area where turns have happened more than once. Most of the levels traders actually use come from a short list of sources.
- Swing highs and swing lows. The turning points of visible moves, not every small pause between bars.
- Prior session high, low and close. On intraday charts, yesterday's extremes are watched by many participants because they are easy to find.
- Range edges. When price rotates between two prices for several sessions, the top and bottom of that range are resistance and support until a close outside it.
- Round numbers. Prices such as 5,000 on an index future draw resting orders, which links directly to the order clustering research.
- Gaps. The price where a gap opened often acts as a reference when price returns to it.
Horizontal levels are the easiest to check because anyone can see the same swing points. They are also the easiest to over-draw. A chart with twelve horizontal lines has a line near every price, which means none of them tells you anything.
Related lesson: Market structure highs lows and trends
Major and Minor Price Levels
Not every support or resistance level carries the same weight. Major levels stopped large moves on higher timeframes. Minor levels stopped small pullbacks inside a trend.
| Trait | Major support or resistance | Minor support or resistance |
|---|---|---|
| Timeframe it shows on | Daily and weekly charts, still visible intraday | Intraday charts only |
| Size of the move it stopped | A trend or a multi-session swing | A pullback inside a move |
| Number of dated tests | Several, spread over time | One or two, close together |
| What a break usually means | A change in the larger structure | A pause or continuation of the current move |
| How to use it | Context and target areas | Entry timing inside the larger plan |
The test count needs a date attached. Research by Ken Chung and Anthony Bellotti on intraday price series, posted to arXiv in January 2021, found that price entering a level with more previous bounces was more likely to bounce there again, and that the probability of a bounce decreased as the level aged. So two things are true at once: more touches carry information, and old touches carry less of it.
A practical rule follows. Three tests inside one month describe a live area. Three tests spread across three years describe a historical marker, and they should not be added together as if they were the same evidence.
Related lesson: Multiple timeframe analysis
Support and Resistance Zones Instead of Lines
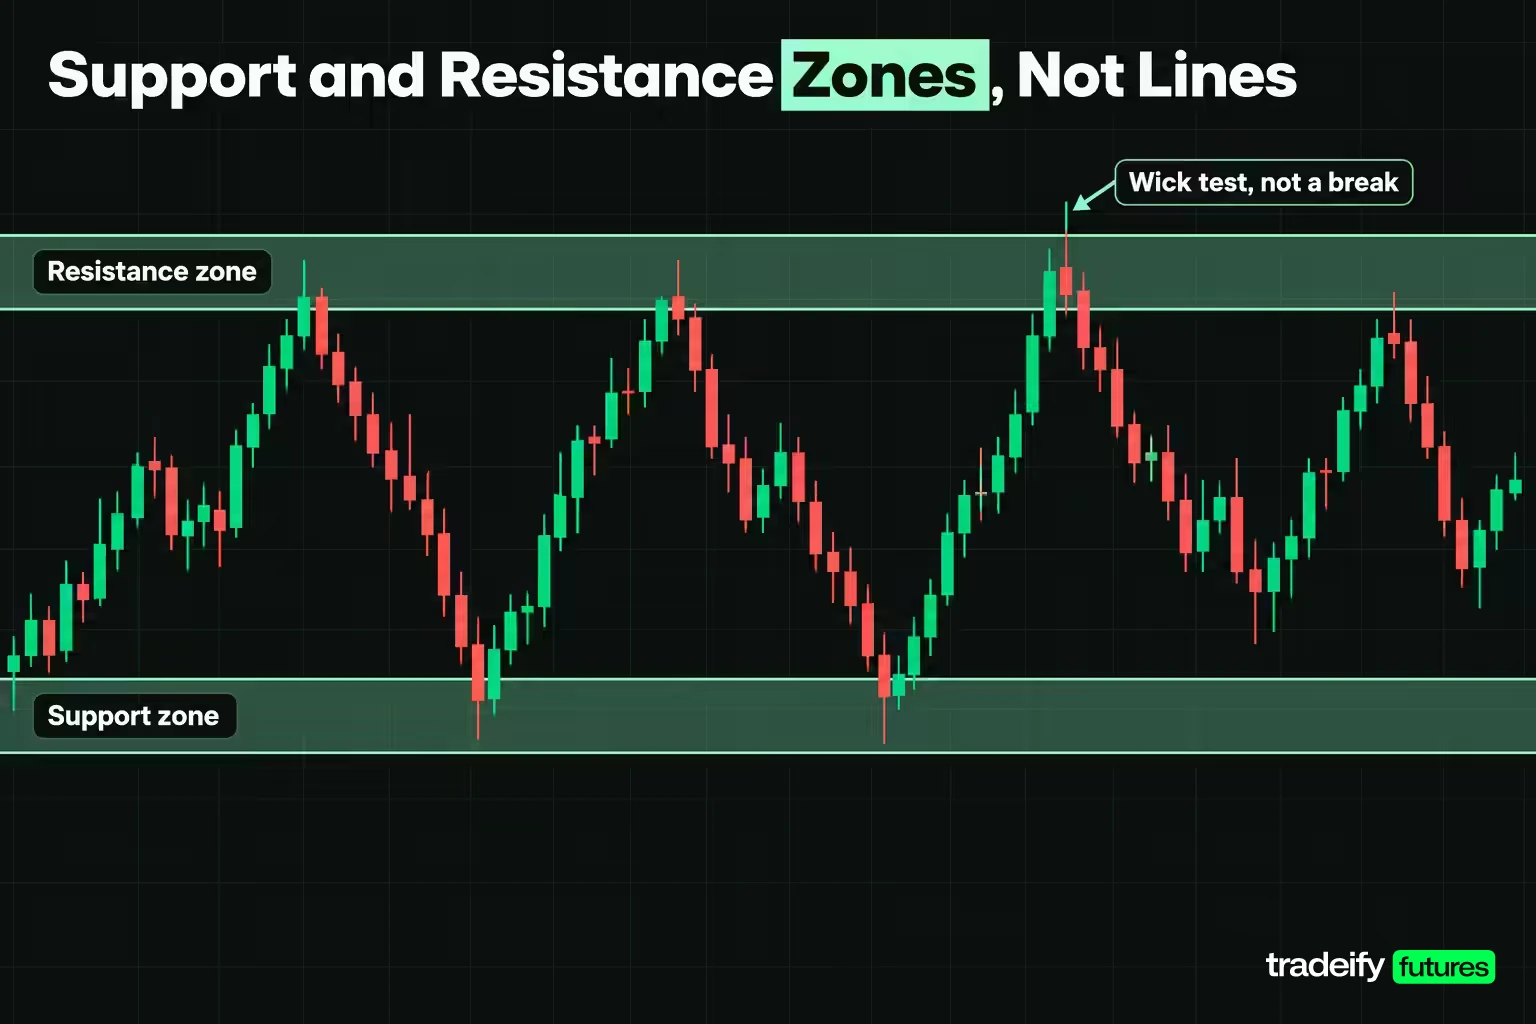
A single price implies a precision the market does not offer. An instrument that moves several points in a normal bar trades through a thin line as a matter of routine. That is why most experienced traders mark support and resistance as zones: a band of prices around the level.
The hard part is deciding how wide the band should be. A fixed number of points is the wrong answer, because the same width means different things on a quiet five-minute chart and a volatile daily chart. A more consistent starting point is a fraction of the chart's own average range, such as one quarter of the average true range (ATR). It is a convention, not a law, but it scales with volatility instead of with opinion.
Pricing a zone on ES and MES
The table prices the one-quarter-of-range rule on the E-mini S&P 500 (ES) and the Micro E-mini S&P 500 (MES). CME lists ES at $50 times the S&P 500 Index with a minimum tick of 0.25 index points, worth $12.50. MES is $5 times the index with the same 0.25 tick, worth $1.25. The average ranges are illustrative round numbers, not live readings.
| Chart timeframe | Illustrative average range (points) | Zone width at one quarter of range (points) | Zone width (ticks) | Zone width per ES contract | Zone width per MES contract |
|---|---|---|---|---|---|
| 5-minute | 4 | 1.00 | 4 | $50.00 | $5.00 |
| 15-minute | 12 | 3.00 | 12 | $150.00 | $15.00 |
| Daily | 60 | 15.00 | 60 | $750.00 | $75.00 |
Read the last two columns as the price of a careless zone. The same rule produces a 1.00 point zone on a five-minute chart, worth $50.00 per ES contract, and a 15.00 point zone on a daily chart, worth $750.00 per ES contract. Only the timeframe changed. A trader who widens a zone without reducing size has widened the risk too.
Related lesson: Average true range ATR
How to Draw Support and Resistance Levels
Drawing support and resistance is a skill, but it does not have to be a mood. The goal is a method that another trader could follow on the same chart and get roughly the same marks.
- Pick one instrument and one timeframe. A level drawn on a weekly chart and traded on a five-minute chart is two different claims. Mark higher-timeframe levels as context, and draw the levels you trade on the chart you trade.
- Find swing extremes that turned real moves. Require at least two turns at a similar price, separated in time. Two swing lows an hour apart on a five-minute chart are usually one event, not two tests.
- Draw the zone across the turns, not through the extreme tick. Use the area where the bodies and closes turned, and let the zone width cover the small overshoots.
- Date every test and record its close. The date tells you how old the evidence is. The close separates a test from a break.
Then cut the chart back. Keep the levels closest to current price and the major levels from higher timeframes, and delete the rest. If you cannot say which level you would act on and which you would ignore, there are too many lines.
One discipline matters more than the drawing itself: mark the levels before the session, not after. A level drawn once the reversal is obvious goes straight through the turning point and looks perfect, which is exactly why it proves nothing.
Trendlines and Dynamic Levels
Not all support and resistance is flat. In a trend, the turning points rise or fall, so the level that matters moves with them.
Diagonal support and resistance comes from trendlines. In an uptrend, a line connecting two or more rising swing lows acts as support. In a downtrend, a line connecting falling swing highs acts as resistance. A parallel line on the other side of price turns the pair into a channel.
Trendlines carry more judgement than horizontal levels. Whether you connect the wicks or the bodies, and which two swings you start from, changes the angle and the price the line implies today. The same rules apply as for horizontal levels: at least two swings, separated in time, drawn before the session.
Dynamic support and resistance comes from values that are recalculated as each bar closes. A moving average in a steady trend often acts as a moving floor or ceiling, because many traders watch the same average and price tends to pull back toward its mean. VWAP plays a similar role intraday.
The difference from horizontal levels is important. A horizontal level stays at one price. A dynamic level is a different price every bar, so "price is at support" only means something if you say which average, on which timeframe, and how many recent tests it has held.
Related lesson: Trendlines and channels
Indicators That Mark Key Price Levels
Several indicators turn support and resistance into a calculation. They help because they are objective: two traders using the same settings get the same price. They do not add new information about order flow; they repackage price and volume into levels.
Pivot points as calculated support and resistance
Pivot points use the previous period's high, low and close. TradingView's documentation for its standard pivot indicator gives the traditional formulas: the pivot P is the previous high plus low plus close, divided by 3; R1 is P times 2 minus the previous low; S1 is P times 2 minus the previous high; R2 is P plus the previous range; S2 is P minus the previous range.
A worked example with illustrative round prices on ES: the previous session's high was 5,040, low 4,970 and close 5,020.
| Pivot level | Calculation | Result |
|---|---|---|
| Pivot (P) | (5,040 + 4,970 + 5,020) / 3 | 5,010 |
| R1 | 2 x 5,010 minus 4,970 | 5,050 |
| S1 | 2 x 5,010 minus 5,040 | 4,980 |
| R2 | 5,010 + 70 | 5,080 |
| S2 | 5,010 minus 70 | 4,940 |
Pivots are popular with intraday futures traders because they are fixed for the whole session and are the same for everyone using the same formula. They become more useful when a calculated pivot lands near a swing level you already drew, because then two independent methods point at the same area.
Moving averages, Fibonacci, VWAP and volume profile levels
- Moving averages. Commonly watched periods act as dynamic support or resistance in trending markets and lose their meaning in choppy ones.
- Fibonacci retracements. Ratio lines drawn between a swing low and swing high mark possible pullback areas. They work best as a way to find a zone near an existing swing level, not as a reason on their own.
- VWAP. The volume-weighted average price for the session, watched by many intraday participants as a fair-value reference.
- Volume profile. Prices where heavy volume traded often act as support or resistance, while thin-volume areas are where price tends to move quickly.
The risk with indicators is clutter. Five tools each drawing four lines produce twenty levels, and price will be near one of them most of the time. Choose one or two methods, write down which ones, and judge them on the same dated tests as your swing levels.
Related lesson: Pivot points
A Worked Support and Resistance Level Test
A full sequence makes the ideas concrete. The numbers below are illustrative round prices, chosen so the arithmetic can be checked. They are not a historical quote.
The setup: ES is trading below a resistance level at 5,000 on a 15-minute chart. Using the one-quarter-of-range rule with an illustrative 12 point average range, the zone is 3.00 points wide, from 4,998.50 to 5,001.50. A test counts as held if the bar closes back below the level. A break needs a close above the far edge of the zone, 5,001.50.
| Test | Bar high | High vs 5,000 (points) | High vs 5,000 (ticks) | Bar close | Close vs 5,000 (points) | Result |
|---|---|---|---|---|---|---|
| 1 | 4,998.75 | -1.25 | -5 | 4,997.25 | -2.75 | Reached the zone, not the level |
| 2 | 5,000.50 | +0.50 | +2 | 4,998.50 | -1.50 | Wick through, close below, held |
| 3 | 5,001.75 | +1.75 | +7 | 4,998.25 | -1.75 | Wick beyond the zone, close below, held |
| 4 | 5,003.00 | +3.00 | +12 | 4,998.75 | -1.25 | Largest wick, close below, held |
| 5 | 5,000.75 | +0.75 | +3 | 5,002.25 | +2.25 | Small wick, close beyond the zone, broke |
Reading the closes in the level test
The five-test log at the 5,000 ES resistance carries the whole lesson. Three of the first four tests traded above the level, by 0.50, 1.75 and 3.00 points. Per ES contract that is $25.00, $87.50 and $150.00 of excursion. Test 4 traded 12 ticks above the level, outside the zone entirely, and still closed 1.25 points below 5,000.
The level broke on test 5, which had one of the smallest wicks in the sequence. What changed was not how far price reached. It was where the bar closed: 5,002.25, beyond the far edge of the zone.
Test 4 is where most traders get caught. In real time, a bar trading 3.00 points through resistance looks exactly like the start of a breakout, and the urge to chase it is strong. A trader watching only the highs would have called the level broken on test 3 or test 4, and been wrong both times. A trader watching the closes saw the level hold four times and break once, on a clear signal. That is why the close basis matters more than how far a wick reaches.
Related lesson: What is volume
Trading the Bounce and the Break at a Level
There are two broad ways to trade support and resistance, and they are opposite bets.
- The bounce bets that the level holds. At resistance, that means selling or staying out of longs near the zone and expecting price to turn back. The signal is a rejection: a wick into the zone and a close back on the defended side.
- The break bets that the level gives way. At resistance, that means buying once price closes beyond the zone. The signal is acceptance: a close outside the zone, not just a wick through it.
The common mistake is switching between the two mid-trade. A trader shorts a bounce, sees a wick above the level, and flips long, only for the bar to close back below. Decide in advance which outcome you are trading and what close would invalidate it.
Three ways to enter the same resistance break
Take an illustrative ES resistance at 5,000 with a 3.00 point zone from 4,998.50 to 5,001.50. After several rejected tests, a 15-minute bar finally closes at 5,002.25, beyond the zone. A break trader still has a choice of entry. Each stop below sits under the zone's lower edge or under the most recent low.
| Entry rule | Entry | Stop | Risk (points) | Risk (ticks) | Risk per ES contract | Risk per MES contract |
|---|---|---|---|---|---|---|
| Buy the close beyond the zone | 5,002.25 | 4,998.00 | 4.25 | 17 | $212.50 | $21.25 |
| Buy a pullback to the zone's top edge | 5,001.50 | 4,998.00 | 3.50 | 14 | $175.00 | $17.50 |
| Buy the reclaim after a retest undercut | 5,001.00 | 4,997.25 | 3.75 | 15 | $187.50 | $18.75 |
Each rule pays for something. Buying the close guarantees a position if price never comes back, and costs the widest stop at $212.50 per ES contract. Buying the pullback trims the risk to $175.00, but only fills if price returns. Waiting for a reclaim gives the clearest proof that buyers defended the level, and only exists if price first dips through the zone and recovers.
The rule matters less than using the same one every time. Always buying the close is a system. Buying the close when it "feels strong" and waiting when it "feels weak" is a mood.
Related lesson: Breakout trading
When Resistance Becomes Support
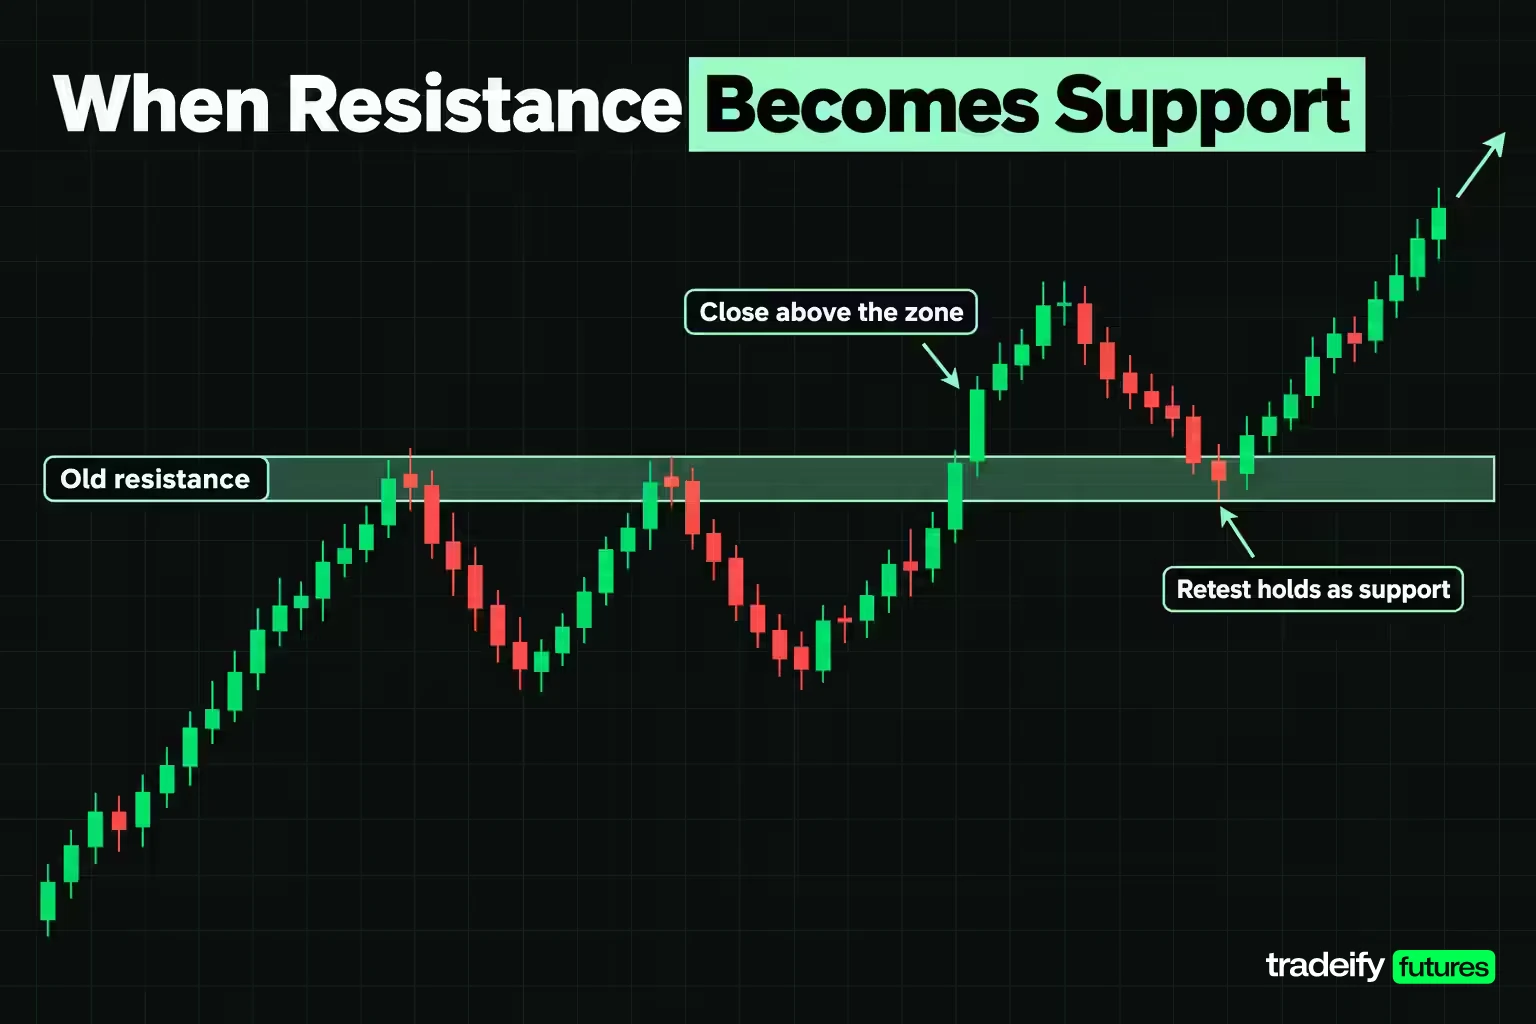
Role reversal is the idea that a broken resistance level often acts as support on the way back, and a broken support level often acts as resistance. The logic follows from the order clustering: traders who sold at the old resistance and were proven wrong may buy back near their entry, and traders who bought the break defend the same price.
In practice, role reversal is a hypothesis to test on the retest, not a fact to assume.
Here is how it plays out in an illustrative ES example. Resistance sat at 5,000, with a 3.00 point zone from 4,998.50 to 5,001.50, and it broke when a 15-minute bar closed at 5,002.25. Price then ran to 5,063.00, a move of 60.75 points, or $3,037.50 per ES contract. On the way back down, price traded to 4,997.75 before recovering.
That retest undercut the old resistance by 2.25 points (9 ticks), and fell 0.75 points below the lower edge of the zone. A long bought on the break with a stop at 4,998.00, just under the zone, was taken out by a single tick before the old resistance started acting as support. A trader who waited for price to dip, then reclaim the zone, and placed the stop under the 4,997.75 low, was still in the trade.
The lesson is uncomfortable but useful. A retest is where role reversal is confirmed, by price closing back above the zone and holding there. A wick below the zone on the retest is normal. A close below it, and a failure to recover, is what would say the break did not hold.
Related lesson: Pullback trading
Stop Loss and Take Profit Placement Around a Level
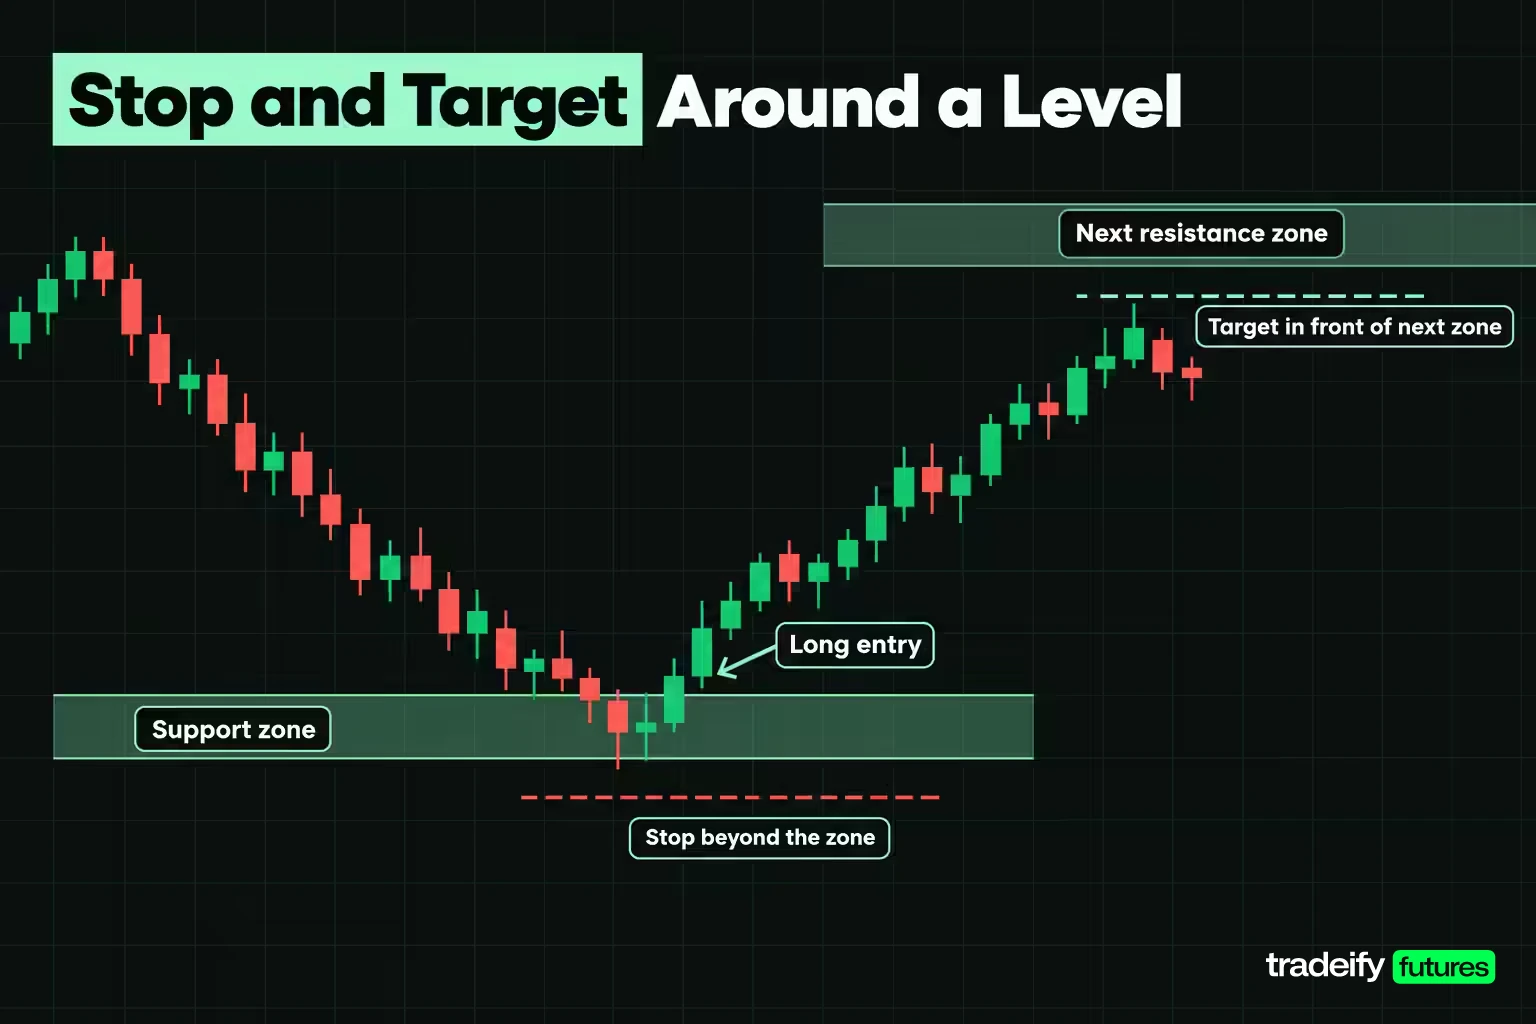
Support and resistance give a trade two natural reference points: where you are wrong and where the next obstacle is.
Stop placement. Put the stop beyond the far edge of the zone, plus a buffer for the overshoot the instrument normally makes, never exactly on the level. The order clustering research is the reason: an obvious level is where many stops already sit. Then size the position from that stop distance, so a wider zone means fewer contracts, not more dollars at risk. The temptation runs the other way: squeezing the stop inside the zone so the trade fits a bigger size. That turns a valid level into a stop that is likely to be hit by normal noise.
Take profit placement. Put the target just in front of the next support or resistance zone, not in the middle of it. Price often stalls as it reaches the next zone, so a target placed beyond it asks the market to break a second level for you.
An illustrative ES example: a long entered at 5,001.00 after price reclaimed a broken resistance zone at 5,000, with the stop at 4,997.25 under the retest low, risks 3.75 points. If the next resistance zone starts at 5,018.50, a target one tick in front of it at 5,018.25 gives a reward of 17.25 points, which is 69 ticks, $862.50 per ES contract or $86.25 per MES contract. Divided by the 3.75 point risk, that is a reward to risk of 4.6 to 1. Those numbers are illustrative and say nothing about how often such a target is reached.
Run the same check before every trade. If the next zone is closer than the stop is wide, the level may be valid but the trade is not worth taking.
Related lesson: Stop-loss orders and placement
How Often a Support Level Holds
"The more times a support level is tested, the stronger it gets" is repeated everywhere. The Chung and Bellotti research supports part of it, since more previous bounces raised the odds of another bounce, but it also found that the effect decays with age. Neither finding tells you the hold rate of your level.
Some simple probability shows how little a short streak proves. Suppose a level holds 60% of the time, and each test is independent:
- Three holds in three tests happens about 21.6% of the time.
- Five holds in five tests happens about 7.8% of the time.
- Exactly four holds in five tests happens about 25.9% of the time.
- At least one break in five tests happens about 92.2% of the time.
At a 50% hold rate, a coin flip, three holds in a row still happens 12.5% of the time and five in a row about 3.1%. Three clean bounces are a normal outcome for a level with no edge at all. That is why a level that has "worked three times" deserves a log, not more size.
Backtesting your own levels
The only way to know how your levels behave is to record them. A simple validation process:
- Fix the drawing rules in writing, including the zone width and the close basis.
- Mark levels on historical data bar by bar, without looking ahead, or on a replay tool that hides future bars.
- Log every test: date, high or low, close, and whether it held or broke.
- Collect a meaningful sample, then compare the hold rate on recent tests with older ones to see whether your levels decay.
- Price the result in ticks and dollars after commissions, because a level that holds often but only by a few ticks may not cover costs.
Related lesson: Backtesting a trading strategy
Advantages and Limitations of Support and Resistance
Support and resistance give you a defined place to be right and a defined place to be wrong, and that is most of their value. The costs are subjectivity, false breaks and mixed evidence on returns.
| Advantages | Limitations |
|---|---|
| Works on any liquid market and any timeframe | Drawing is subjective, so two traders can mark different levels |
| Gives a clear place to be wrong, which defines the stop | Levels do not say when price will arrive or how far it will go |
| Links to documented order clustering at round numbers | Obvious levels attract stop runs and false breaks |
| Easy to combine with trend, volume and timeframe context | Evidence that levels produce returns after costs is mixed |
| Helps plan targets in front of the next obstacle | Older tests lose information as the level ages |
What research says about price levels
The academic record on support and resistance points in more than one direction.
William Brock, Josef Lakonishok and Blake LeBaron tested moving average and trading range break rules, the mechanical version of trading a break of support or resistance, on the Dow Jones Index from 1897 to 1986. Published in the Journal of Finance in 1992, their results gave strong support for the technical strategies in that sample.
A later out-of-sample test by Jiali Fang, Ben Jacobsen and Yafeng Qin, published in the Review of Financial Economics in 2014, used the same rules on fresh data from 1987 to 2011. It found no evidence that those well-known strategies predicted stock markets, and concluded the earlier success was probably a result of bias rather than markets becoming more efficient.
Achilleas Zapranis and Prodromos Tsinaslanidis built a rule-based method for finding horizontal support and resistance levels, published in Applied Financial Economics in 2012. On two decades of daily closing prices for NASDAQ and NYSE stocks, support levels outperformed resistance levels at predicting trend interruptions, but neither beat a simple buy-and-hold strategy.
The honest summary: support and resistance describe real behaviour, backed by documented order clustering and by evidence that price reacts at levels. Turning that behaviour into returns after costs is harder, and the stock market studies lean against simple mechanical rules. A level tells you where to make a decision and where you are wrong. It does not tell you the trade will pay.
Related lesson: Technical analysis complete beginner guide
Common Mistakes When Trading Levels
Most support and resistance failures are process failures, and they repeat in predictable ways.
| Mistake | What it looks like | Better habit |
|---|---|---|
| Drawing the level after the outcome | The line runs through the exact turn because the turn was already visible | Mark levels before the session, save the chart, review the marks afterward |
| Treating a wick as a break | Price trades through the level, so the trader flips position before the close | Judge each test on the close relative to the zone's far edge |
| Counting old touches as fresh evidence | A level is called strong because of tests from years ago | Date every test and give recent tests more weight |
| Stop exactly on the level | The stop sits among the clustered orders and is hit on a small overshoot | Place the stop beyond the zone plus the instrument's usual overshoot |
| Too many levels | A line near every price, so any move "respects a level" | Keep the nearest levels and the major ones, delete the rest |
| Mixing timeframes | A weekly level used as an intraday entry trigger with no intraday signal | Use higher-timeframe levels as context and trigger on the traded chart |
| One zone width for every chart | The same number of points used on a five-minute and a daily chart | Size the zone from that chart's average range |
The first mistake deserves a second look because it is the hardest to notice. Hindsight makes every level look clean. The only defence is a record made before the outcome, which is also the only way to learn whether your drawing rules work.
Related lesson: How to keep a trading journal
A Pre-Session Level Checklist
A short routine before the session turns support and resistance from lines on a chart into a plan.
- Mark no more than four support and resistance zones on the chart you trade, plus any major higher-timeframe levels nearby.
- For each zone, write the date and close of the most recent test.
- Set each zone's width from the chart's average range and write it in points and dollars per contract.
- Write the close that would invalidate each read.
- Decide whether you are trading the bounce, the break, or neither at each zone, and the entry rule you will use.
- Note the stop distance, the next zone in the trade's direction, and whether the reward is worth the risk.
- After the session, log every test, including the ones you did not trade.
On our accounts every position must be closed by 4:45 PM ET each trading day, so any level you plan to trade is a same-session idea, and a level that only matters for a multi-day swing is context rather than a trade. If you trade through WealthCharts, its 30+ drawing tools include horizontal lines, rays, channels, rectangles and Fibonacci retracements for marking zones, and its Chart Replay lets you rewind a chart to a past date to practise drawing and testing levels before trading them.
Support and Resistance FAQ
What is the meaning of support and resistance?
Support is a price area where a decline stopped because buyers absorbed the selling. Resistance is a price area where an advance stopped because sellers absorbed the buying. Both describe where one side took control before, and both work better as zones than as exact prices.
Does support and resistance actually work?
Support and resistance describe real behaviour, since stop-loss and take-profit orders cluster at round numbers and price often reacts there. Whether trading levels produces returns after costs is less clear, and stock market studies of simple rules are mixed. Treat a level as a place to make a decision, not as a signal.
Do professional traders use support and resistance?
Many do, usually as context rather than as a trigger. The level narrows where a trade is worth considering. The entry comes from how price behaves at the level, such as a rejection or a close beyond the zone.
How do you confirm support and resistance?
Before the session, look for at least two turns at a similar price, separated in time, with each test dated. During the session, judge each test by the close. A wick through the zone is a test, while a close beyond its far edge is a break.
What is the difference between a support level and a zone?
A level is a single price, and a zone is a band of prices around it. Zones are more workable because markets routinely trade a few ticks through any exact price. Sizing the zone from the chart's average range keeps it in line with volatility.
Should a stop loss go on the support level?
No. Stop-loss orders tend to cluster at obvious levels, so a stop exactly on the level is easy to trigger on a small overshoot. Place it beyond the far edge of the zone plus a buffer, and size the position from that distance.
How many touches make a support or resistance level strong?
There is no fixed number. Research by Ken Chung and Anthony Bellotti on intraday levels found that more previous bounces raised the chance of another bounce, but the effect faded as the level aged. Recent, dated tests matter more than a long count.
Does resistance become support?
Often, but not automatically. When price closes above a resistance zone and later pulls back, the old resistance can act as support as buyers defend it. Confirm it by a close back above the zone on the retest, because the retest can dip through first.
This article is general education about a chart-reading method, not investment advice or a recommendation to trade any product. Futures are leveraged, and losses can build quickly and exceed what you expect when a level gives way without warning. Evaluation and funded accounts at prop firms are simulated, and simulated results do not represent live trading. Every price in the worked examples is illustrative.


