




TL;DR: Small, mid, and large cap stocks are grouped by market value, roughly under $2 billion, $2 billion to $10 billion, and over $10 billion. Smaller companies can grow faster and have earned a size premium over a century, but with bigger swings and long losing stretches. Large caps offer depth, liquidity and steadier earnings, and they have led over the last decade. Pick a mix by time horizon and risk tolerance, then check liquidity before trading any single name.
Small, mid, and large cap stocks are three ways of sorting public companies by one number: what the market says the whole company is worth. The label tells you roughly how big the business is. It also hints at how the stock tends to behave, how easy it is to trade, how much research covers it and which index it sits in.
Treat the label as a starting point, not a verdict. A $1.5 billion company can trade more smoothly than a neglected $15 billion one, and the "safe" large cap can still lose more than a third of its value in a bad year. This guide covers how the size bands are drawn, what a century of data says about risk and return by size, how valuations and sector mixes differ, and how investors and active traders put the labels to work.
What Market Capitalization Measures
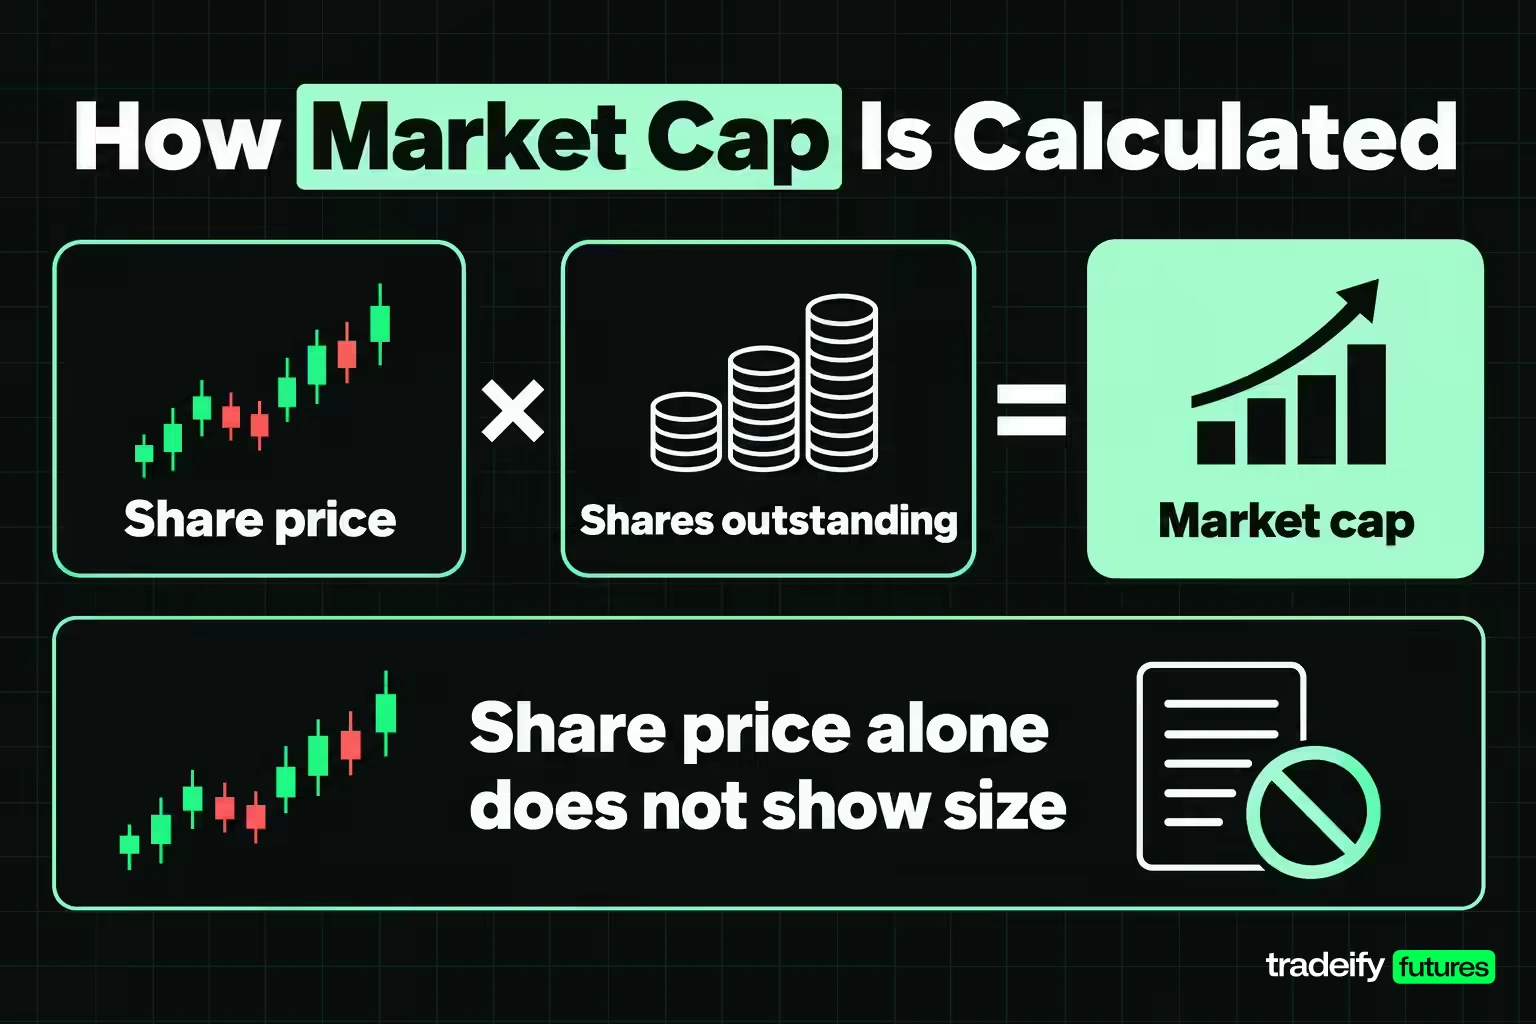
Market capitalization, or market cap, is the value the stock market puts on a company's equity. Investor.gov defines it as the current market price of one share multiplied by the number of total outstanding shares.
Market cap = share price × shares outstanding
Take an illustrative company with 80,000,000 shares outstanding trading at $25. Its market cap is 80,000,000 × $25 = $2 billion. If the price rises to $30, the market cap becomes $2.4 billion without the business changing at all overnight.
That is the first thing to get straight about the number. It moves every time the share price moves, so a company's size category is a live reading, not a permanent trait. A size label you saved six months ago may already be out of date.
Why share price alone misleads on company size
A high share price does not mean a big company. FINRA's example makes the point with two companies that both trade at $50 a share. One has 5 million shares outstanding, so it is worth $250 million, a small cap. The other has 5 billion shares, so it is worth $250 billion, a mega cap. Same price, a thousandfold difference in size.
FINRA also notes that outstanding shares include restricted shares held by officers and insiders, not just the shares that trade publicly. Index providers often go one step further and use float-adjusted market cap, which counts only the shares available to the public. That distinction matters for traders: a company with a large market cap but a small float can move sharply when demand shows up, because fewer shares are actually changing hands.
Market cap is also a perceived value. FINRA describes it as reflecting what investors think the company is worth, which may rest on growth expectations that never arrive. When expectations change, the share price and the market cap adjust together.
Related lesson: What market capitalization means
Small, Mid, and Large Cap Stock Ranges
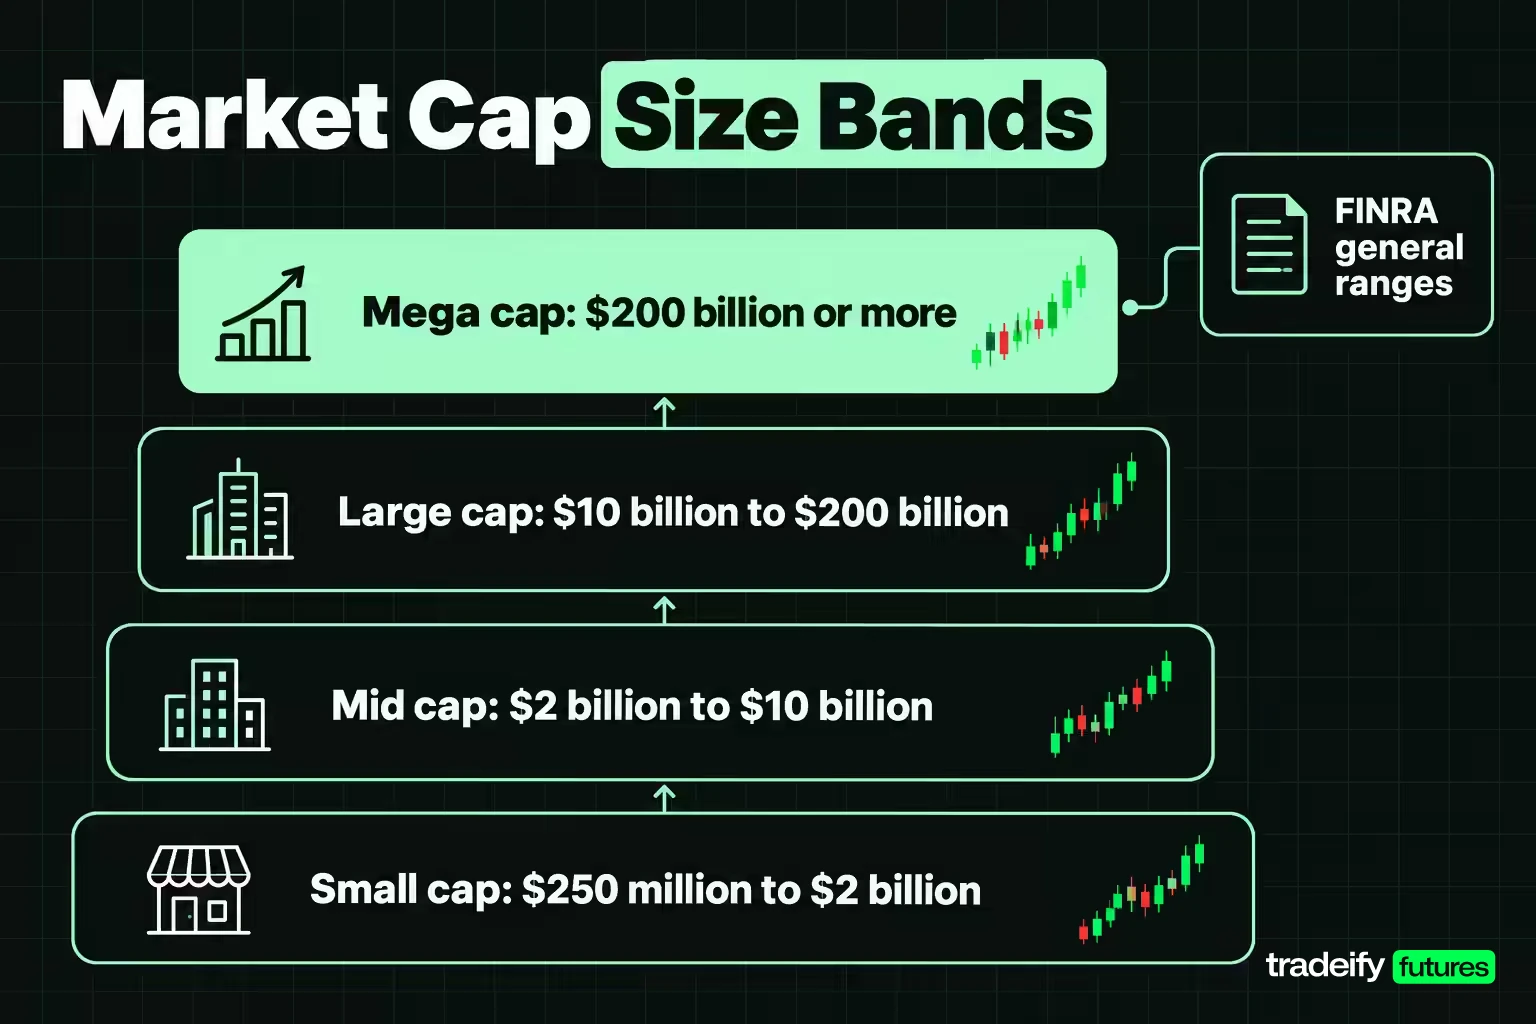
There is no single official cutoff between small, mid and large cap stocks. FINRA says the delineation "can vary" and gives these general bands:
| Category | FINRA general range | What it usually describes |
|---|---|---|
| Mega cap | $200 billion or more | The largest household-name companies |
| Large cap | $10 billion to $200 billion | Established firms with long operating records |
| Mid cap | $2 billion to $10 billion | Companies past the startup stage, still expanding |
| Small cap | $250 million to $2 billion | Younger or niche businesses with fewer resources |
| Micro cap | Less than $250 million | Very small companies, often thinly traded |
Investor.gov adds two terms at the bottom of the scale. Companies worth less than $250 or $300 million are often called microcap stocks, and the smallest public companies, under $50 million, are sometimes called nanocap stocks.
How index providers draw the lines
Index providers use their own rules, and those rules often matter more in practice because index funds and benchmarks are built on them.
S&P Dow Jones Indices sets dollar guidelines for its three core US size indices. Its November 2026 methodology lists:
| S&P index | Size tier | Company market cap guideline |
|---|---|---|
| S&P 500 | Large cap | US$ 22.7 billion or more |
| S&P MidCap 400 | Mid cap | US$ 8.0 billion to US$ 22.7 billion |
| S&P SmallCap 600 | Small cap | US$ 1.2 billion to US$ 8.0 billion |
Those ranges are designed to capture companies at roughly the 85th percentile and above of the total US market (S&P 500), the 85th to 93rd percentile (MidCap 400) and the 93rd to 99th percentile (SmallCap 600). S&P reviews the ranges at the start of each calendar quarter and updates them when market conditions move them by 10% or more.
FTSE Russell does not use dollar bands at all. It ranks eligible US companies by total market cap and slices the list by position. The Russell Top 200 is companies ranked 1 to 200, the Russell 1000 is 1 to 1,000, the Russell Midcap is 201 to 1,000, and the Russell 2000, a widely followed small-cap benchmark, is companies ranked 1,001 to 3,000. So the Russell 1000 holds mid caps as well as large caps.
Why the same stock can wear two labels
Go back to the illustrative $2.4 billion company. Under FINRA's bands it is a mid cap. Under S&P's guidelines it falls in the SmallCap 600 range. Under Russell's ranking it would most likely sit in the Russell 2000. None of these is wrong. They answer slightly different questions.
The practical rule is to check which definition a fund, screener or article is using before comparing anything across sources.
Small Cap Stock Characteristics
Small cap stocks are companies worth roughly $250 million to $2 billion under the common bands. Many are younger businesses, niche specialists or companies in a single product line or region. That narrower base is where both the appeal and the risk come from.
The appeal is runway. A company worth $1 billion can double its revenue more easily than one worth $1 trillion, and FINRA notes that smaller companies may have greater potential for fast growth in economic boom times. Small caps also tend to get less analyst coverage, so the market can be slower to price in good news. That gap is the reason some investors go looking for them.
The risks come from the same small base:
- Thinner finances. FINRA points out that larger companies typically have greater financial reserves and can absorb losses more easily. A small company with one bad year may need to borrow or issue shares.
- Dilution. Raising money by selling new shares spreads the company across more shares, which can push the price down even when the business is fine.
- Higher volatility. As of September 30, 2026, iShares reports a three-year standard deviation of 19.08% for its S&P SmallCap 600 fund, against 12.42% for its S&P 500 fund.
- Thinner trading. Lower daily volume usually means wider bid-ask spreads and more slippage, especially on market orders.
- Less information. Fewer analysts, less media attention and sometimes less disclosure make it harder to judge what a price assumes.
Microcap and penny stock warnings
Below the small-cap line, the risks change in kind, not just degree. The SEC's microcap guide warns that a lack of public information can make a stock riskier because quoted prices are less likely to reflect the company's real risks and opportunities, and that such stocks may trade only in small volumes. It also notes that companies quoted over the counter generally do not have to meet the minimum listing standards exchanges impose, and that the information gap opens the door to fraud that relies on spreading false information about a company.
Not every microcap is a problem. But the burden of proof shifts to you, and liquidity tends to vanish at the exact moment you most want to sell.
Mid Cap Stock Characteristics
Mid cap stocks, roughly $2 billion to $10 billion under the common bands, usually sit in the stretch between a proven small business and a mature large one. They often have established products, real revenue and access to credit markets, while still having room to take market share or enter new markets.
That combination is why mid caps get described as a middle ground. In the data they mostly behave that way. As of September 30, 2026, iShares reports a three-year standard deviation of 15.59% for its S&P MidCap 400 fund, between the 12.42% of its large-cap fund and the 19.08% of its small-cap fund.
Rising and falling mid cap stocks
A mid cap stock can be a growing company on its way up or a former large cap on its way down. Both can carry the same market cap today and tell completely different stories. One is adding customers and expanding margins. The other is shrinking into the range after losing ground.
So ask what put the company in the mid-cap band. A rising company may be gaining investor attention and, eventually, index demand as it migrates up. A falling one may face selling from funds that only hold larger names. The label is the same; the decision is not.
Mid caps are also prone to a quiet failure mode: being treated as a perfect compromise. Some trade with the depth of a large cap. Others behave like thin small caps, with wide spreads and sharp reactions to earnings. Check the actual volume and spread, not the category.
Large Cap Stock Characteristics
Large cap stocks are companies worth $10 billion or more under the common bands, with the biggest, at $200 billion and above, often called mega caps. They are the companies most people can name: established businesses with long operating records, broad institutional ownership and heavy analyst coverage.
The strengths are stability and depth:
- Financial reserves. FINRA notes that large caps tend to be less vulnerable to market swings than mid caps, partly because they can absorb losses and recover more quickly from a bad year.
- Liquidity. Heavy daily volume usually means tight spreads and orders that fill near the quoted price in normal conditions.
- Information. Many analysts, detailed filings and constant news coverage make it easier to see what the market expects.
- Dividends. Mature companies with steady cash flow are more likely to pay dividends than companies still reinvesting everything to grow.
The tradeoffs are slower growth from a large base and a different kind of risk. A $500 billion company needs another $500 billion of value to double. And because the biggest index funds weight by market cap, a handful of mega caps can make up a large share of a large-cap fund, which concentrates risk in a few names even when the fund holds hundreds of stocks.
Why large cap does not mean safe
Company size reduces some risks; it does not remove price risk. Large caps still gap on earnings, reprice when interest-rate expectations change and fall with the broad market. In Kenneth French's US size data, the largest 30% of companies as a group lost 36.7% in calendar 2008. A familiar name can still be a bad trade if the entry, stop and size are wrong.
Small vs Mid vs Large Cap Stocks Compared
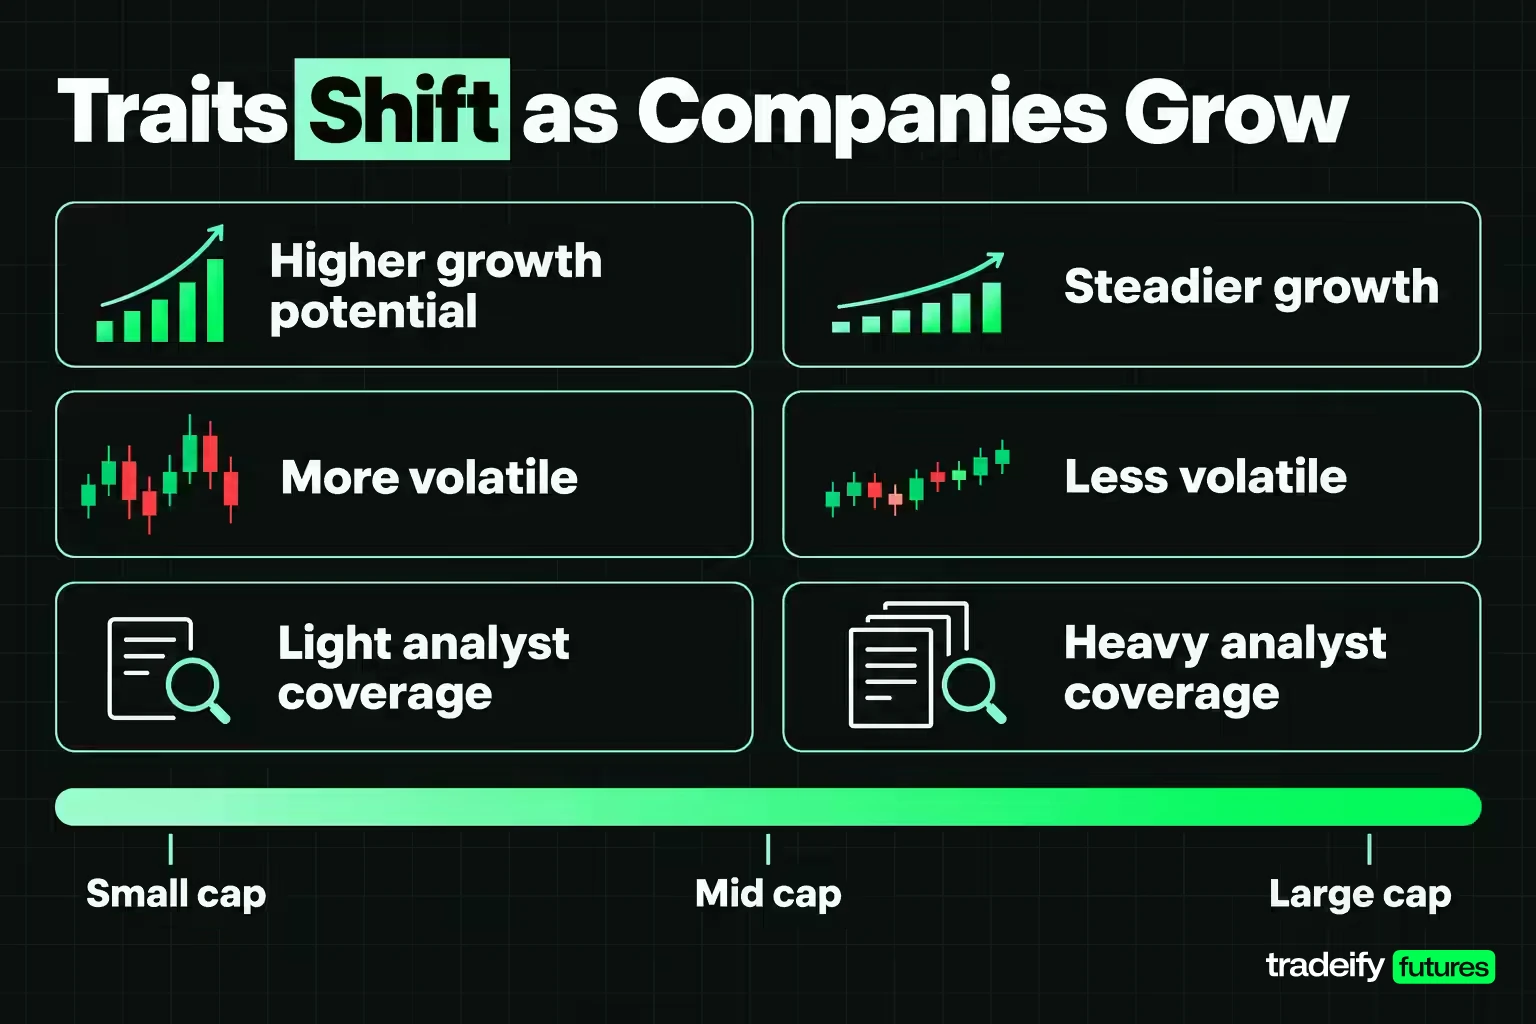
Comparing small vs mid vs large cap stocks side by side shows a gradient rather than three separate worlds. Most traits shift steadily as companies get bigger.
| Trait | Small cap | Mid cap | Large cap |
|---|---|---|---|
| Common range | $250 million to $2 billion | $2 billion to $10 billion | $10 billion and up |
| Typical business stage | Early growth, niche or turnaround | Established and still expanding | Mature, market leader |
| Growth potential | Highest, least predictable | Moderate to high | Lower, steadier |
| Volatility (3-year std dev of iShares core funds, as of September 30, 2026) | 19.08% | 15.59% | 12.42% |
| Liquidity and spreads | Thinner volume, wider spreads | Mixed, check each name | Deep volume, tight spreads |
| Analyst coverage | Light | Moderate | Heavy |
| Dividends | Less common | Mixed | More common |
| Typical benchmark | S&P SmallCap 600, Russell 2000 | S&P MidCap 400, Russell Midcap | S&P 500, Russell Top 200 |
Read the table as tendencies across groups. Individual companies break the pattern all the time: a profitable small cap with a strong balance sheet can be less risky than a heavily indebted large cap.
Market cap among other types of stocks
Market cap is one of several common ways to sort stocks. Others include growth versus value, dividend versus non-dividend, cyclical versus defensive, sector, and common versus preferred shares. The categories overlap: a small cap can be a value stock, and a large cap can be a growth stock. Size describes the company's weight in the market, not its style.
Risk and Return by Market Cap Size
The cleanest long-run evidence on risk and return by market cap comes from academic size portfolios. Kenneth French's data library at Dartmouth publishes monthly returns for US stocks sorted at the end of each June into size groups using NYSE market-cap breakpoints. For this guide, the value-weighted returns of three groups were compounded from July 1926 through September 2026 (the file is built on CRSP data through September 2026): the bottom 30% by size, the middle 40% and the top 30%.
Treat this as an illustrative study with that method, not a forecast. The groups are defined by rank, not by FINRA's dollar bands, and the returns are before fees, taxes and trading costs.
| Size group (French data) | Annualized return, July 1926 to September 2026 | Annualized volatility | Worst peak-to-trough drop |
|---|---|---|---|
| Smallest 30% | 11.68% | 28.4% | 90.5% |
| Middle 40% | 11.56% | 23.0% | 86.4% |
| Largest 30% | 10.27% | 17.8% | 83.0% |
Over a century of Kenneth French's data, smaller stocks earned more. They also swung far harder. The smallest group's volatility was 28.4% a year against 17.8% for the largest, and its worst drawdown, during the early-1930s crash, was 90.5%.
Risk and return by market cap since 2000
Running Kenneth French's value-weighted size groups (smallest 30%, middle 40% and largest 30% of US stocks by NYSE breakpoints) from January 2000 through September 2026 tells a similar story with smaller numbers:
| Size group, since 2000 | Annualized return | Annualized volatility | Worst drop |
|---|---|---|---|
| Smallest 30% | 9.73% | 22.1% | 57.8% |
| Middle 40% | 9.36% | 19.2% | 50.2% |
| Largest 30% | 8.46% | 15.2% | 49.8% |
Limits of the market cap return data
Two cautions keep the French size data honest. First, the extra return earned by smaller stocks came with extra pain. A higher average return does nothing for the investor who bails out after a 58% fall, and that is the moment most people are tempted to bail. Second, the size of the gap depends heavily on the start and end dates chosen.
Crises also hit every size group. In calendar 2008 the smallest 30% fell 38.1% and the largest fell 36.7%. In 2022 they fell 19.1% and 19.4%. Owning large caps did not make either year comfortable.
The Small Cap Premium in History
The small cap premium is the idea that smaller companies, as a group, have earned higher long-run returns than larger ones, partly as compensation for their extra risk. The French data in this guide supports that over the full century. It also shows why the premium is far less dependable than the long-run average suggests.
Here is how the smallest 30% and largest 30% compared decade by decade:
| Decade | Smallest 30%, annualized | Largest 30%, annualized |
|---|---|---|
| 1930s | 2.7% | -0.3% |
| 1940s | 18.7% | 8.8% |
| 1950s | 18.8% | 18.3% |
| 1960s | 15.4% | 7.6% |
| 1970s | 8.8% | 5.4% |
| 1980s | 13.5% | 17.1% |
| 1990s | 13.9% | 18.5% |
| 2000s | 6.6% | -0.9% |
| 2010s | 11.8% | 13.8% |
| 2020 to September 2026 | 11.4% | 15.6% |
The premium arrived in bursts. Small caps dominated the 1940s, the 1960s and the 2000s, and trailed for the 1980s, the 1990s, the 2010s and so far the 2020s.
How often small caps actually won
Across every rolling 10-year window in Kenneth French's size data since 1926, the smallest 30% of US stocks beat the largest in 722 of 1,084 windows, or 66.6%. That sounds strong until you flip it: roughly one decade-long holding period in three went the other way.
The recent record is the clearest warning. From January 1979 through September 2026, the smallest group in the French data returned 11.96% a year against 12.50% for the largest, so the century-long premium did not show up at all over those 47 years. Over the 10 years to September 2026, the gap was wide in favor of size: 10.99% a year for the smallest group and 15.69% for the largest. In 2023 and 2024 alone, the largest group returned 27.5% and 26.2% while the smallest returned 11.4% and 9.2%.
Index benchmarks show the same thing. As of September 30, 2026, iShares lists 10-year annualized benchmark returns of 15.32% for the S&P 500, 10.46% for the S&P MidCap 400 and 9.83% for the S&P SmallCap 600.
Why the premium is uneven
Several explanations are debated: smaller companies carry more business and financing risk, they suffer more in recessions and credit squeezes, and the most successful small companies graduate out of the small-cap group just as they become big winners. Quality also matters. The S&P SmallCap 600 requires positive earnings for new members, while many small-cap universes include unprofitable companies, which is one reason small-cap indices can perform differently from one another.
The lesson that actually changes a decision is modest. A long-run size premium may exist, but it can disappear for decades. Anyone overweighting small caps for the premium needs a time horizon, and a tolerance for underperformance, measured in decades rather than years.
Valuation Differences Across Cap Sizes
Valuation is where the size groups have pulled furthest apart. As of November 3, 2026, iShares reports these fund-level ratios for its three core US size funds:
| iShares core fund (benchmark) | P/E ratio | P/B ratio |
|---|---|---|
| S&P 500 fund | 28.80 | 5.56 |
| S&P MidCap 400 fund | 22.07 | 2.72 |
| S&P SmallCap 600 fund | 19.38 | 1.95 |
On these measures, investors are paying about 50% more per dollar of earnings for large caps than for small caps (28.80 divided by 19.38 is about 1.49). Large caps also trade at nearly three times book value relative to small caps.
Reading a valuation gap between cap sizes
Cheap is not the same as good value. A lower P/E for small caps than for large caps is not automatically a reason to buy them. Large caps can earn their premium through higher profit margins, steadier earnings and stronger balance sheets. Small caps can look cheap because earnings are more cyclical or more likely to disappoint.
Fund-level P/E figures also need care. A P/E ratio has no meaning for a company with losses, and fund sponsors and index providers handle loss-makers and averaging differently, so ratios from different sources are not like-for-like. Compare size groups using one source and one method, such as the iShares fund ratios for each tier.
The honest reading of a valuation gap between size groups is conditional. If the earnings of smaller companies hold up, a lower starting multiple gives them more room to rerate. If earnings weaken, as they often do for smaller firms in a slowdown, the discount can widen further. A valuation gap tells you about expectations, not timing.
Sector Exposure by Market Cap
Choosing a cap size also means choosing a sector mix, often without realizing it. The sector weights of the same three iShares core funds, as of November 3, 2026, look very different:
| Sector | S&P 500 fund | S&P MidCap 400 fund | S&P SmallCap 600 fund |
|---|---|---|---|
| Information Technology | 36.98% | 12.32% | 12.44% |
| Financials | 12.32% | 15.50% | 18.49% |
| Industrials | 8.34% | 23.86% | 18.10% |
| Health Care | 10.21% | 10.90% | 10.33% |
| Consumer Discretionary | 9.23% | 10.59% | 13.63% |
| Communication | 8.48% | 1.62% | 3.51% |
| Real Estate | 1.82% | 7.21% | 6.52% |
The large-cap fund is more than a third information technology. The mid-cap fund's biggest sector is industrials, and the small-cap fund leans toward financials, industrials and consumer discretionary, with a bigger real estate weight than large caps.
Why sector mix changes the size comparison
That mix explains a good part of why size groups behave differently. When technology leads, large-cap indices tend to lead with it. When interest rates, credit conditions and the domestic economy drive markets, the bank, industrial and real estate weight in smaller indices comes to the front. Some of what looks like a "small versus large" result is really a sector result.
So before you shift money between cap sizes, ask whether you are really making a size decision or a sector decision. Reducing large caps to add small caps also cuts technology exposure and adds financials and industrials.
How Market Cap Decides Index Membership
Market cap is the first filter for most stock index membership, and index membership matters because funds tracking those indices must buy and sell when the list changes.
S&P Dow Jones Indices layers several tests on top of its market cap guidelines. Per its November 2026 methodology, a new S&P 500, MidCap 400 or SmallCap 600 member also needs:
- a float-adjusted market cap of at least 50% of the index's minimum company size threshold
- trading of at least 250,000 shares in each of the six months before evaluation
- positive GAAP earnings in the most recent quarter and over the most recent four quarters combined
A committee makes the final call, and existing members can migrate between the three indices without meeting every addition test again. That is why a company can grow past the S&P 500 threshold and still wait to be added.
FTSE Russell is mechanical by comparison. It ranks companies by total market cap on a rank day and rebuilds its US indices twice a year. Rank day is the last business day of April for the June reconstitution and the last business day of October for the December one, with changes effective on the fourth Friday in June and the second Friday in December. To limit turnover, existing members near a breakpoint stay put unless they move outside a band, ±2.5% of cumulative market cap around the 1,000th stock, for example.
Index reconstitution effects on stock trading
Index additions and deletions can create concentrated buying or selling around the effective date as tracking funds adjust their holdings. That can lift volume and widen ranges in the affected names. It does not tell you the direction of the stock afterward.
The membership rules also explain why index funds hold different numbers of stocks. As of November 3, 2026, iShares lists 505 holdings in its S&P 500 fund, 409 in its MidCap 400 fund and 653 in its SmallCap 600 fund. The counts differ from the index names because some companies have more than one share class and index membership changes between rebalances.
Diversifying a Portfolio by Market Cap
Diversifying a portfolio by market cap means holding companies of different sizes so that no single group drives the whole result. FINRA gives it as an example of diversifying within one asset class, and the decade table shows why: leadership between small and large caps rotates, sometimes for 10 years or more.
The diversification benefit is real but partial. In Kenneth French's US size data, the monthly returns of the smallest and largest groups had a correlation of 0.83 over the full period and 0.77 since 2000. Size groups mostly rise and fall together. Mixing them smooths the ride a little; it does not protect you from a broad market decline.
Illustrative small, mid and large cap blend results
To show the tradeoff, Kenneth French's value-weighted US size groups (the largest 30%, middle 40% and smallest 30% of stocks by NYSE market-cap breakpoints) were combined into blends rebalanced monthly, July 1926 to September 2026, before fees, taxes and costs:
| Blend (largest / middle / smallest) | Return, 1926 to 2026 | Volatility, 1926 to 2026 | Return since 2000 | Volatility since 2000 | Worst drop since 2000 |
|---|---|---|---|---|---|
| 100% largest | 10.27% | 17.8% | 8.46% | 15.2% | 49.8% |
| 60% / 25% / 15% | 11.00% | 20.0% | 9.05% | 16.5% | 50.6% |
| 40% / 30% / 30% | 11.33% | 21.8% | 9.32% | 17.6% | 51.8% |
Adding smaller companies raised both return and volatility over these periods, while the worst drop barely changed because all three groups fell together in the same crises. Over the 10 years to September 2026, when the largest group returned 15.69% a year against 10.99% for the smallest, the same tilt would have cost return.
Setting and keeping a cap mix
A practical approach:
- Start from the market's own mix. A total-market index fund already holds large, mid and small caps in proportion to their size, so most of its weight sits in large caps.
- Decide whether to tilt. Adding extra small or mid cap weight is a bet on the size premium and on sector mix, so size it to how long you can wait.
- Write the target down. For example, 70% large, 20% mid, 10% small, as an illustration, not a recommendation.
- Rebalance on a schedule or a threshold. When one group drifts well past its target, trim it back. That forces selling what has run and buying what has lagged.
Market Cap Strategies by Size
Different cap sizes reward different approaches. The selection criteria and the way you manage a position should change with the size of the company.
Small cap strategies
- Favor quality screens. Positive earnings, manageable debt and cash flow filter out many of the companies most exposed to dilution and failure.
- Diversify inside the group. Single small-cap outcomes vary widely, so many investors use a fund or hold a larger number of names at smaller sizes.
- Use limit orders. Wide spreads make market orders expensive. A limit order caps what you pay.
- Plan the exit before entry. Liquidity can thin out after bad news, which is exactly when you want to sell.
Mid cap strategies
- Look for migration. Growing mid caps with rising revenue and earnings are candidates to move up a size tier, which can bring new investor demand.
- Check which way the company is moving. A shrinking former large cap needs a different thesis from a rising one.
- Treat each name individually on liquidity. Some mid caps trade like large caps; others do not.
Large cap strategies
- Mind concentration. In a cap-weighted large-cap fund, the biggest names can dominate. Know how much of your money rides on a few companies.
- Focus on valuation and expectations. With heavy coverage, the price usually reflects consensus quickly, so the edge comes from judging whether expectations are too high or too low.
- Respect event risk. Earnings and macro releases still gap large caps.
A market cap execution check for active traders
For short-term traders, cap size matters most through execution. An illustrative comparison of a $40,000 position shows why:
- Small cap at $8.00 bid, $8.04 ask. A $0.04 spread is 0.5% of price. Buying 5,000 shares at the ask and selling at the bid costs 5,000 × $0.04 = $200 before any price move.
- Large cap at $200.00 bid, $200.01 ask. A $0.01 spread is 0.005% of price. 200 shares × $0.01 = $2.
Liquidity follows the same pattern. If the small cap trades $3 million a day, a $40,000 order is about 1.3% of a full day's dollar volume. If the large cap trades $2 billion a day, the same order is about 0.002%.
Position sizing by market cap from the stop
Size the trade from the invalidation point, not from how comfortable the name feels. Familiar large caps tempt people into oversizing; small caps tempt people into skipping the math because the dollar amount looks small. With an illustrative $50,000 account and a 1% maximum loss of $500:
- Small cap entry $8.00, stop $7.40: risk $0.60 per share, so about 833 shares, a position of about $6,664.
- Large cap entry $200.00, stop $194.00: risk $6.00 per share, so about 83 shares, a position of about $16,600.
Stops are not guaranteed prices. Gaps and fast markets can fill beyond the stop, and thin small caps are where that happens most.
Related lesson: Position sizing for stock trades
Which Cap Size Fits Which Investor
Which cap size fits you depends on two things Investor.gov uses to frame asset allocation: time horizon and risk tolerance. Time horizon is how long you expect to invest toward a goal; a longer horizon can make it easier to ride out volatile periods. Risk tolerance is your ability and willingness to lose some or all of your money in exchange for higher potential returns.
| Profile | Typical horizon | Cap size emphasis to consider | Main risk to accept |
|---|---|---|---|
| Conservative | Short or needs income | Mostly large caps, often dividend payers | Lower growth, concentration in big names |
| Moderate | Medium to long | Total-market mix, modest mid cap tilt | Market-level drawdowns |
| Aggressive | Long, able to wait out losses | Larger mid and small cap share | Deep drawdowns and long periods of lagging |
These are illustrations of how the tradeoffs line up, not recommendations. Your own goals, taxes and other holdings matter more than any table.
Cap size index funds or individual stocks
For most people who want size exposure, a broad index fund in each category is the simpler route: one holding gives hundreds of companies. Common choices are a total-market fund, or separate large-, mid- and small-cap index funds tracking benchmarks like the S&P 500, S&P MidCap 400, S&P SmallCap 600 or Russell 2000. Compare costs, the index followed, and how closely the fund tracks it.
Picking individual stocks within a size group takes more research, and the research load rises as companies get smaller because there is less outside coverage. There is no list of "good stocks" that fits everyone. The right question is whether a specific company, at its current price, fits your plan and your risk limits.
Trading Market Cap Tiers With Index Futures
Each size tier has a benchmark index, and CME lists futures on the main ones. Active traders often use them to express a view on a whole size group in one position:
| Futures contract | Index | Contract size | Illustrative notional at a round index level | 1% index move |
|---|---|---|---|---|
| E-mini S&P 500 (ES) | S&P 500 | $50 x index | 6,000 x $50 = $300,000 | $3,000 |
| E-mini S&P MidCap 400 (EMD) | S&P MidCap 400 | $100 x index | 3,000 x $100 = $300,000 | $3,000 |
| E-mini Russell 2000 (RTY) | Russell 2000 | $50 x index | 2,400 x $50 = $120,000 | $1,200 |
The index levels are round illustrative numbers, not quotes. The point is the scale: one contract can carry six figures of exposure, so a modest index move becomes a large dollar move. Futures are leveraged, and losses can exceed what a trader expects.
Some traders also follow the relationship between the tiers, for example the Russell 2000 against the S&P 500, as a read on risk appetite and on how the domestic economy is expected to hold up.
We don't offer cash stocks, options or single stock futures, so you can't buy a small-cap or large-cap share in one of our accounts. The size tiers show up on our accounts through index futures: ES and MES on the S&P 500, EMD on the S&P MidCap 400, and RTY and M2K on the Russell 2000. All of them sit in our Equity Index product group, so a small-versus-large spread such as long RTY and short ES counts as a prohibited hedge, in one account or across accounts. Every position must be closed by 4:45 PM ET on regular trading days, and funded accounts are simulated.
Common Market Cap Mistakes
Most market cap mistakes come from asking a size label to do a job it was never built for.
- Using share price as size. A $500 stock can belong to a smaller company than a $20 stock. Shares outstanding decide size.
- Treating the label as a forecast. Cap size describes typical behavior across a group. It does not say whether this stock goes up or down next.
- Ignoring liquidity inside a category. Two companies with the same market cap can trade very differently because of float, ownership and normal volume.
- Treating boundaries as fixed. Providers draw different lines, S&P revisits its guidelines quarterly and Russell rebuilds twice a year. Companies cross the lines as prices change.
- Letting familiarity justify size. A household-name large cap still gaps on earnings. Position size comes from the stop, not comfort.
- Chasing the last decade's winner. Large caps led for the 10 years to September 2026; small caps led in other decades. Allocating purely on recent performance is how investors end up buying high.
Related lesson: Risk management for traders
Small, Mid, and Large Cap Stocks FAQ
What are small, mid, and large-cap companies?
They are companies grouped by market capitalization, the share price times shares outstanding. FINRA's general bands put small caps at $250 million to $2 billion, mid caps at $2 billion to $10 billion and large caps at $10 billion to $200 billion, with mega caps above that. Index providers such as S&P and FTSE Russell use their own cutoffs.
What are the different types of stocks?
Stocks are commonly grouped by size (small, mid, large cap), by style (growth or value), by income (dividend payers or not), by economic sensitivity (cyclical or defensive), by sector, and by share class (common or preferred). One stock can belong to several groups at once.
Which companies have the highest P/E ratios?
The highest P/E ratios usually belong to companies the market expects to grow quickly, or to companies whose earnings have temporarily dropped. At the group level, large caps currently carry the higher multiple: as of November 3, 2026, iShares reports a P/E of 28.80 for its S&P 500 fund against 19.38 for its S&P SmallCap 600 fund. A high P/E signals high expectations, not quality.
Is a small-cap stock always riskier than a large-cap stock?
Not always, though small caps as a group are more volatile and less liquid. A profitable small cap with little debt can carry less risk than a heavily indebted large cap. Judge the company, its finances and its trading conditions, not only its size.
Can a company move from small cap to mid cap?
Yes. A rising share price, new shares or an index reconstitution can move a company between categories. S&P reviews its size guidelines every quarter, and FTSE Russell rebuilds its indices in June and December.
Do small caps always outperform large caps over time?
No. Over July 1926 to September 2026 the smallest US stocks earned more in the French size data, but they trailed the largest for several whole decades, including the 10 years to September 2026. Any size premium has been uneven and can disappear for long stretches.
What are three good ETFs to buy and hold for the long term?
There is no single right trio, and this guide does not recommend specific funds. Long-term investors who want size coverage often look at a broad large-cap or total-market index fund, a mid-cap index fund and a small-cap index fund. Compare each fund's expense ratio, the index it tracks and how closely it follows that index.
What are 5 good stocks?
No five stocks suit every investor, so treat any such list with caution. A stock is only "good" relative to its price, your time horizon and your risk limits. Within each size group, start with financial strength, valuation and liquidity before a company makes your shortlist.
Putting Small, Mid, and Large Cap Labels to Work
Small, mid, and large cap labels are most useful as a first filter. They tell you roughly what to expect from a company's growth path, volatility, liquidity and index home. They do not tell you whether a particular stock is worth buying today.
Confirm the live market cap, check which definition your source uses, look at the actual volume and spread, and size any position from the point where your idea is proven wrong. If a stock's trading conditions do not fit your plan, leaving it on the watchlist is a valid decision.
Investing and trading in stocks and futures involves risk, including the loss of more than you expect when leverage is involved. Historical returns in this guide are illustrative, before costs, and do not predict future results. Funded trading accounts are simulated. This article is educational and is not investment advice.


