




TL;DR: Market capitalization is share price times shares outstanding, so 400,000,000 shares at $42.50 make a $17 billion company. It moves with every trade, so it is a running price, not an appraisal or a buyout price. Common bands run from micro-cap under $250 million to mega-cap at $200 billion or more. Use it to compare companies and read index weight, never to size a trade.
Market capitalization, usually shortened to market cap, is the first number most quote pages show next to a ticker. It looks like a verdict on how big and how solid a company is. It is really a product of two inputs, and most mistakes with it come from forgetting which two.
The mistake is rarely the arithmetic. It is using the number for a decision it was never built for, like treating a large company as a safe trade or a $500 share as a big business. This guide works the formula on one illustrative company, shows how the size bands are drawn, explains what moves the number, and covers how market cap decides which companies move the index futures traders watch.
Market Capitalization Defined in Plain Terms
Market capitalization is the value of a company determined by multiplying the current public market price of one share by the number of total outstanding shares. That is the definition the SEC's Investor.gov glossary uses, and every other version is a restatement of it.
FINRA calls market cap one measurement of a company's size. Its count of outstanding shares includes the publicly traded shares plus restricted shares held by company officers and insiders, so the headline figure counts shares that cannot change hands today.
Two words in the definition carry the weight:
- Current. The price is whatever the last trade printed. Fidelity's guide makes the point that market cap fluctuates with the share price, so it can change continuously through a session.
- Outstanding. The share count is the other half of the multiplication, and it is the half people skip. A $500 share price says nothing about size until you know how many shares exist.
So market cap is not cash in the bank, not the value of what the company owns, and not what it would cost to buy the business. Investopedia's entry states that it reflects what investors are willing to pay, not a company's intrinsic value or acquisition cost. FINRA describes it as the perceived value of a company, because the share price is set by investors.
Related lesson: What is price
How to Calculate Market Capitalization

The market capitalization formula is one line:
Market cap = share price x shares outstanding
FINRA's own example: a company with 5 million shares outstanding and a $20 stock price has a market capitalization of $100 million. The calculation never gets harder than that. What gets harder is choosing which share count and which price you mean.
One illustrative company valued four ways
The company in this table is hypothetical, with round numbers so every step can be checked on a calculator. It has 400,000,000 shares outstanding at a share price of $42.50. Insiders hold 100,000,000 of those shares, there are 20,000,000 employee options outstanding, and the balance sheet shows $1.5 billion of debt against $300 million of cash.
| Measure | Share count or input | Calculation | Result |
|---|---|---|---|
| Market cap | 400,000,000 shares | 400,000,000 x $42.50 | $17 billion |
| Free-float market cap | 300,000,000 shares | 300,000,000 x $42.50 | $12.75 billion |
| Fully diluted market cap | 420,000,000 shares | 420,000,000 x $42.50 | $17.85 billion |
| Net debt | $1.5 billion debt, $300 million cash | Debt minus cash | $1.2 billion |
| Enterprise value | Market cap plus net debt | $17 billion plus $1.2 billion | $18.2 billion |
Reading the four market capitalization figures
In the illustrative company with 400,000,000 shares at $42.50, the headline market cap is $17 billion. The free-float figure removes the 100,000,000 insider shares and values only the 75% of shares that trade freely, for $12.75 billion. The fully diluted figure adds the 20,000,000 options, a 5% overhang, which lifts the value to $17.85 billion, an extra $850 million.
Enterprise value is a different question. It adds the $1.2 billion of net debt to the equity value, giving $18.2 billion, about 7.06% above the market cap. That figure gets closer to what an acquirer would actually take on, which is why Investopedia points to enterprise value, not market cap, as the better gauge of the cost of buying a business outright.
When a screener and a news article quote two different market caps for the same company on the same day, one of these share-count choices is usually the reason. Before you decide one source is wrong, check which count each one used.
Why share price alone says nothing about market cap
A high share price is not a large company. FINRA's illustration uses two companies whose stock trades at $50. One has 5 million shares outstanding for a market cap of $250 million. The other has 5 billion shares outstanding for a market cap of $250 billion.
| Share price | Shares outstanding | Market capitalization | What the price told you about size |
|---|---|---|---|
| $50 | 5 million | $250 million | Nothing |
| $50 | 5 billion | $250 billion | Nothing |
| $5 | 400 million | $2 billion | Low price, mid-cap company |
| $500 | 4 million | $2 billion | High price, the same size |
The last two rows are the trap. A $5 stock and a $500 stock can be exactly the same size. The share count is the missing input in almost every conversation about whether a stock is "big" or "cheap".
Where to find shares outstanding for a market cap
For a US-listed company, the share count behind market capitalization comes from its filings. The SEC's Form 10-Q instructions require the cover page to state the number of shares outstanding of each class of common stock as of the latest practicable date. Multiply that count by the current share price and you have the market cap for any company, including a newly listed one whose quoted figure you want to check. Remember that a quote page may use a more recent count or a float-adjusted count, so small differences between sources are normal.
Related lesson: What is a stock
Market Cap Categories From Mega-Cap to Micro-Cap
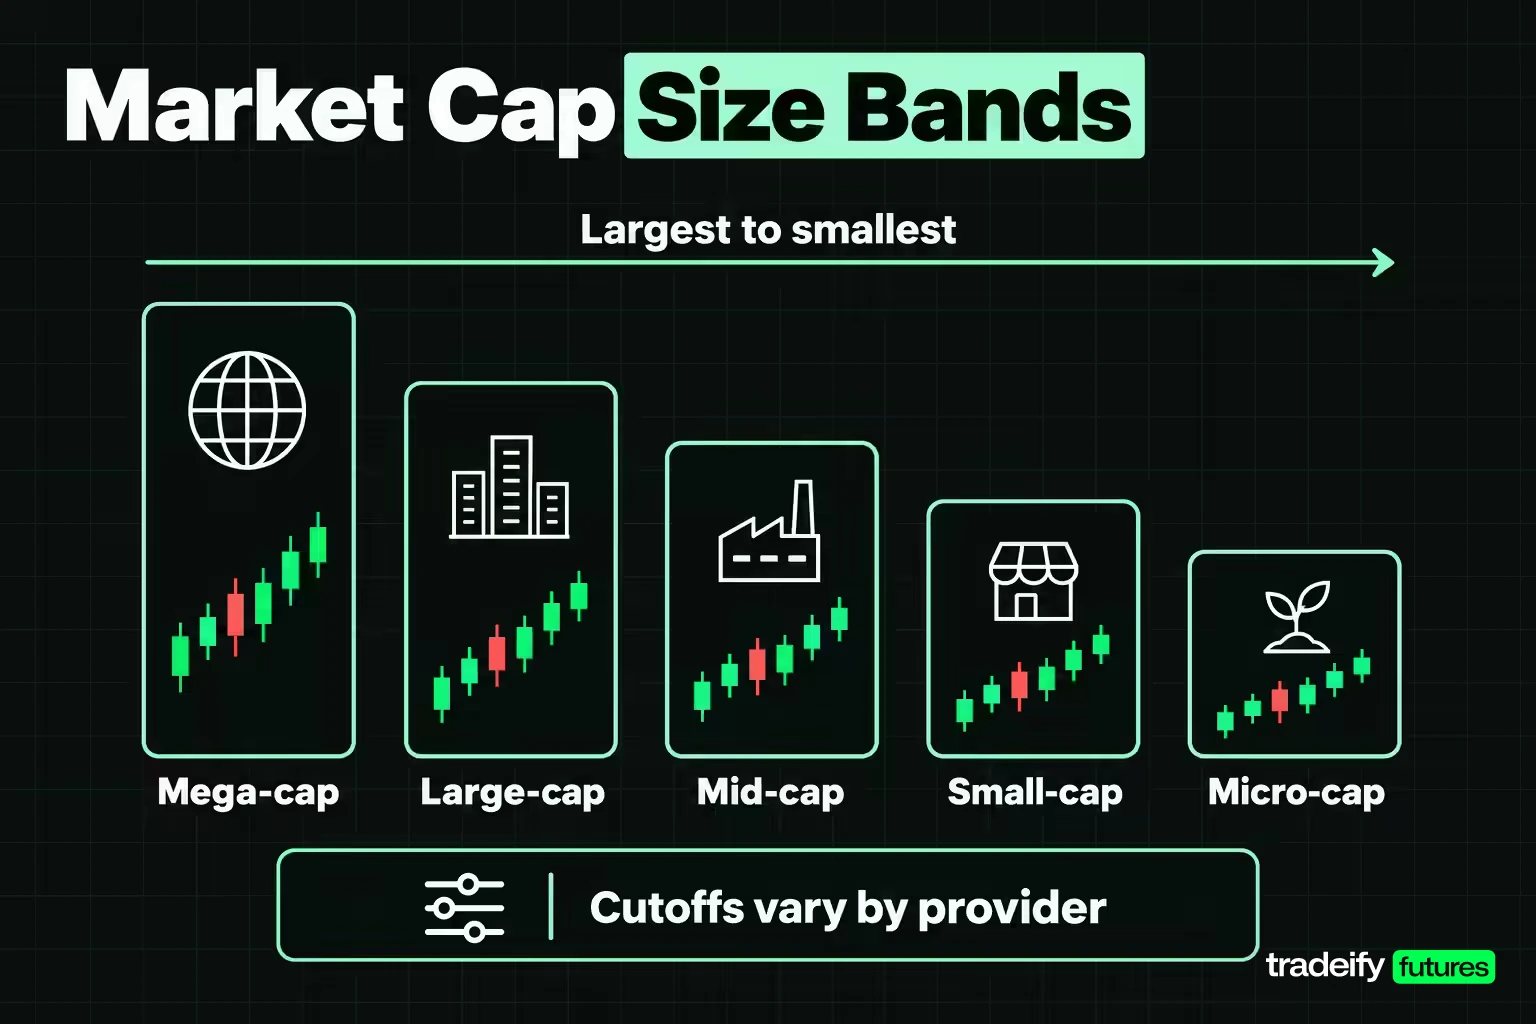
Market capitalization categories sort companies into size groups. FINRA notes that the dividing lines can vary, then gives the breakdown you will see most often, which Fidelity's guide repeats almost exactly.
| Market cap category | Typical market cap range | Typical profile |
|---|---|---|
| Mega-cap | $200 billion or more | The largest listed companies |
| Large-cap | $10 billion to $200 billion | Established, widely held businesses |
| Mid-cap | $2 billion to $10 billion | Growing companies between the two ends |
| Small-cap | $250 million to $2 billion | Younger or niche businesses |
| Micro-cap | Less than $250 million | The smallest and least established listings |
Market cap bands are conventions, not rules
The labels have no official status. Wikipedia's survey of the terms states that different indexes use different numbers and that there is no official definition of, or full consensus about, the exact cutoff values. It adds that cutoffs may be defined as percentiles rather than in dollars, and that dollar thresholds need adjusting over decades for inflation and market growth.
That is why one data provider can call a company large-cap while another calls it mid-cap. Neither is wrong. They are using different tables.
A company can change category on price alone
The bands are dollar thresholds, so a share price move can carry a company across one with no change in the business. Take a hypothetical company with 40,000,000 shares outstanding:
- At $50 a share, its market cap is $2 billion, the bottom of the mid-cap band.
- At $250 a share, the same 40,000,000 shares give $10 billion, the top of the mid-cap band and the door to large-cap.
No new shares were issued and no earnings report was filed. The label changed because the price did. Use the category to find comparable companies, not to draw a conclusion about quality.
Related lesson: Small, mid and large cap stocks
Why Market Capitalization Matters
Market capitalization matters because it turns a share price into a size you can compare. A $42.50 stock and a $420 stock tell you nothing side by side. Their market caps do.
Market capitalization does four useful jobs:
- Comparing companies. It is the baseline for peer comparisons. Investopedia gives the example of a company with twice the revenue of its rivals but four times their market cap, which suggests investors are paying a lot more for each dollar of sales.
- Grouping by size. Indexes and funds use market cap to group companies. FINRA notes that the S&P 500 is made up of mega-cap and large-cap stocks, while the Russell 2000 is a small-cap index.
- Index weighting. In a market-cap-weighted index, FINRA explains, companies with a higher market cap account for relatively more of the index. That single fact decides which stocks move an index on a given day.
- Scale. Market cap lets you place a company against the whole market. As of November 2026, the latest World Bank data put the market capitalization of US listed domestic companies at about $68.94 trillion for 2025, against US GDP of about $30.77 trillion for the same year. An illustrative $17 billion company is about 0.025% of that total.
That last comparison is a useful reality check. Even a company most people would call large is a rounding error at the scale of the whole US market.
What a High or Low Market Cap Tells You
A high market capitalization tells you the market currently values the company's equity at a large figure. Investopedia links a high market cap to a larger market presence, the ability to raise financing more cheaply, a more consistent revenue stream and brand recognition. FINRA adds that larger companies typically have greater financial reserves, so they can often absorb losses more easily.
A low market cap tells you the opposite set of things, and some of them are attractive. A smaller company may be early in its growth, with more room to expand. FINRA points out that a relatively new public company might have room to grow, since raising capital to expand is why many companies list in the first place.
What neither end tells you:
- Whether the price is fair. A high market cap can mean the market expects a lot of future growth that may not arrive.
- Whether the company is profitable. Market cap is a price, not an earnings figure.
- Whether it is safe. FINRA is explicit that these generalizations are no guarantee that any particular large-cap company will weather a downturn well, or that any small-cap will or won't thrive.
So "is a high market cap good" has no general answer. It depends on what you want from the company and what you are comparing it against.
Risk and Return by Market Cap Size
The usual pattern is that risk and potential growth both rise as market capitalization falls. These are tendencies across groups of companies, not rules for any single stock.
| Market cap segment | Typical risk profile | Typical return profile | Why |
|---|---|---|---|
| Large-cap and mega-cap | Lower share price volatility as a group | Slower growth, often dividends | Larger reserves, established revenue |
| Mid-cap | Middle ground | Mix of growth and stability | Expanding businesses with some track record |
| Small-cap | Higher volatility | Higher growth potential in strong economies | Less established, less access to cash |
| Micro-cap | The most volatile and speculative | Wide range of outcomes | Small, thinly followed, less established |
FINRA's version of the pattern: large-cap companies tend to be less vulnerable to market swings than mid-caps, and mid-caps less than small-caps, while smaller companies might have greater potential for fast growth in boom times. Fidelity adds that small-caps can be more vulnerable to downturns or even failure, partly because they may have little access to cash. Investopedia calls micro-caps the most volatile and speculative of the categories.
The reasoning matters more than the table, because it tells you when the pattern breaks. A large company usually has more ways to survive a bad year: cash, credit lines, many products. A small company can be one failed product away from trouble. That cuts both ways, because one successful product can also change a small company's value far more than a large one's.
The limit of this pattern is the single stock. A large-cap company can still fall hard on bad news, and a small-cap can be steadier than the index. The size band describes a group average, not your next trade.
Related lesson: What is volatility
What Changes a Company's Market Cap
A company's market cap changes when either input changes: the share price or the share count. Price moves happen every trading second. Share count changes happen through corporate actions. Each is worked here on the same illustrative company, 400,000,000 shares at $42.50 for a $17 billion market cap.
| Event | New share count | New share price | New market cap |
|---|---|---|---|
| Share price falls 10% | 400,000,000 | $38.25 | $15.3 billion |
| Company issues 40,000,000 new shares | 440,000,000 | $42.50 | $18.7 billion |
| Company buys back 20,000,000 shares | 380,000,000 | $42.50 | $16.15 billion |
| 2-for-1 stock split | 800,000,000 | $21.25 | $17 billion |
Why each event moves market capitalization
Each corporate event changes market capitalization through a different input, starting from 400,000,000 shares at $42.50:
- Price moves. Anything that moves the share price moves the market cap in proportion. A 10% fall to $38.25 takes $1.7 billion off the market cap, with nothing in the business necessarily changed. Fidelity's guide puts it simply: anything that impacts a company's stock price also impacts its market cap.
- Issuing shares. Selling 40,000,000 new shares at $42.50 raises $1.7 billion of cash and lifts the market cap to $18.7 billion. Existing holders own a smaller slice of a bigger company.
- Buybacks. Spending $850 million to repurchase 20,000,000 shares leaves 380,000,000 shares. At an unchanged price the market cap falls to $16.15 billion, because that cash has left the company.
- Option and warrant exercise. Investopedia notes that exercising a large number of warrants increases the shares on the market and dilutes existing shareholders. This is the fully diluted share count becoming the actual share count.
- Splits. A split changes the share count and the price in opposite directions. Investopedia confirms that splits do not change market capitalization, which is why the 2-for-1 row ends at $17 billion again.
In real markets the price often reacts to issuance and buybacks too, so these rows hold the price still only to isolate the share-count effect.
Market Cap vs Free-Float Market Cap
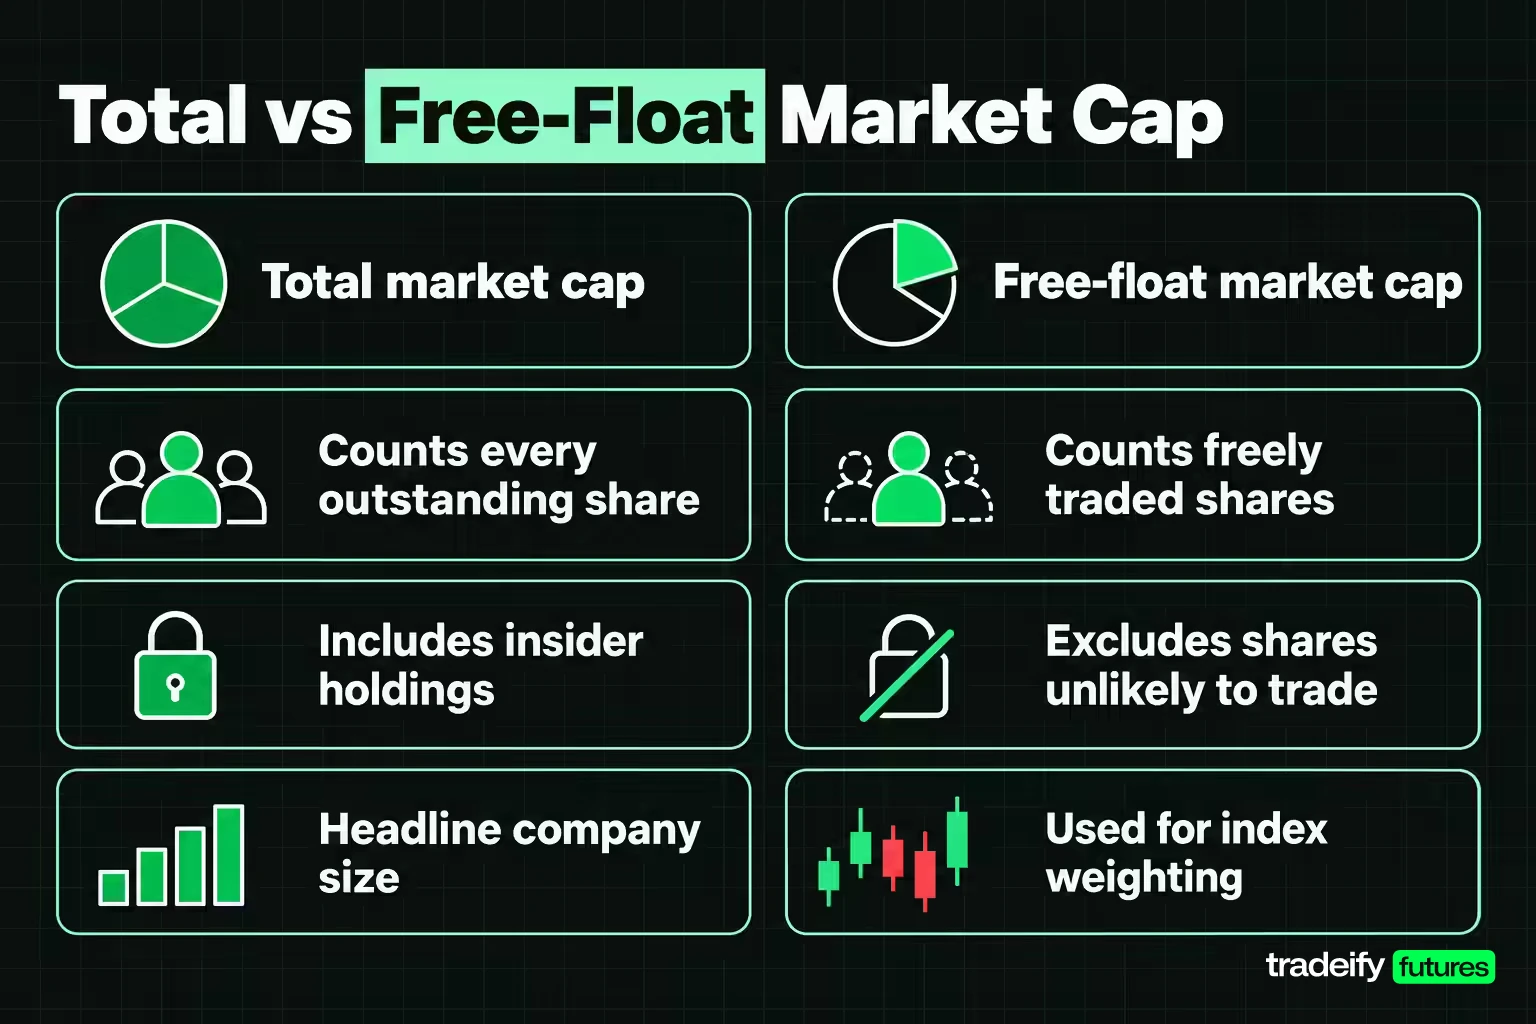
Total market cap counts every outstanding share. Free-float market cap counts only the shares considered freely available to trade. Fidelity describes free-float market cap as a common measure used in index weightings, calculated by subtracting shares unlikely to be traded, typically those held by officers and directors, by another publicly traded company and by certain other entities.
Index providers use the float because an index fund can only buy shares that are actually for sale. Weighting by total shares would give heavy weight to stock that never trades.
Here is what that does to two hypothetical companies with the same $17 billion headline market cap:
| Company | Headline market cap | Freely traded shares | Free-float market cap |
|---|---|---|---|
| Company A | $17 billion (400,000,000 at $42.50) | 300,000,000, or 75% | $12.75 billion |
| Company B | $17 billion (170,000,000 at $100) | 160,000,000, or about 94.1% | $16 billion |
Same headline size, different index weight. Company B's free-float market cap is about 25.5% larger, so in a float-weighted index it carries about 25.5% more weight than Company A. If the two were the only stocks in a toy index, Company A would be about 44.3% of it and Company B about 55.7%.
A small float also matters for anyone placing an order. When insiders hold most of the shares, the price is set by a thinner slice of stock, which can mean wider spreads and sharper moves.
Related lesson: What is liquidity
What Market Capitalization Leaves Out
Market capitalization values the equity at today's price. Everything else about the business sits outside the number, and four omissions cause most of the bad comparisons.
Debt and cash
Two companies with the same market cap can be very different in total value. Take two hypothetical companies, each with a $4 billion market cap:
| Company | Market cap | Net debt or net cash | Enterprise value |
|---|---|---|---|
| Company X | $4 billion | $500 million net cash | $3.5 billion |
| Company Y | $4 billion | $1.5 billion net debt | $5.5 billion |
Company Y is the larger business by $2 billion of enterprise value, even though both show the same market cap. Someone buying Company Y takes on its debt; someone buying Company X gets its cash.
Book value, earnings and expectations
Market cap says nothing about what the company owns on its balance sheet or what it earns. A company with a large market cap and small revenue is priced on expectations. FINRA warns that some of that perceived value may come from expected growth or new products, and if those expectations do not pan out, the share price and the market cap are likely to adjust.
Ownership concentration
Market capitalization also hides who holds the shares. A company with a large market cap but a small free float has its trading price set by a thin slice of the shares, because insiders or other companies hold the rest. That is a liquidity question, not a size question, and the headline market cap figure does not show it.
The practical fix for all of these: treat market cap as the first number you look at, never the only one. Pair it with enterprise value, earnings and the float before you draw conclusions.
Common Market Cap Misreads
The same handful of market cap misreads come up again and again. Each one treats a derived number as if it measured something it does not.
| Misread | What people assume | What market cap actually says | The correction |
|---|---|---|---|
| Price equals size | A $500 share is a bigger company than a $50 share | Price is one of two inputs | Multiply price by the share count |
| Market cap equals worth | The figure is an appraisal | It is the last trade price applied to every share | Check enterprise value and the balance sheet |
| The band is a fact | Mid-cap is a permanent property | The band is a dollar line price can cross | Check which table the label came from |
| Large means safe | Large caps cannot lose much | Size is a group tendency | Judge the single stock on its own risk |
| Company size equals trade size | A large company is a safer trade | Market cap describes the company, not your order | Size the trade from your stop and risk budget |
The thread running through every row: expand the label back into price times share count before it influences a decision.
How Investors Use Market Cap in a Portfolio
Investors use market capitalization mostly to decide how much of a portfolio goes to companies of each size. Fidelity's guide suggests that someone with, say, 70% of a portfolio in stocks might spread that 70% across companies of various market caps to match their risk tolerance, because there can be times when one size group performs well and another does not. FINRA describes the same idea as diversifying within an asset class.
In practice, market cap shapes a portfolio in three ways:
- Size allocation. Deciding how much to hold in large, mid and small companies, often through funds that track one segment rather than picking hundreds of individual stocks.
- Index funds. A fund tracking a cap-weighted index automatically holds more of the largest companies. Owning one means your exposure is concentrated in whatever is biggest at the time.
- Screening. Market cap is a common screener filter for narrowing a list of companies to a size you want to research.
The question "what is the smartest thing to invest in right now" has no market cap answer. Market cap can tell you what kind of company you are looking at. It cannot tell you whether that company suits your goals, time horizon or tolerance for losses, which is a decision for you and, if you want one, a licensed adviser.
Ownership of all those market caps is also concentrated. The Federal Reserve's Distributional Financial Accounts show the top 10% of US households by wealth held about 88.1% of household corporate equities and mutual fund shares as of the second quarter of 2026, with the top 1% alone holding about 50.9%. That figure is where the popular "who owns 88% of the stock market" question comes from.
How Market Capitalization Moves Index Futures
Market capitalization matters to futures traders even though they never buy a share. Stock index futures track indexes, and the S&P 500 is weighted by market cap, so the largest companies do the most to move the index and every contract based on it.
How one large company moves an index
Here is how market capitalization feeds into an index move, with illustrative numbers. Suppose a single company makes up 7% of a cap-weighted index, a weight chosen for the example rather than taken from any current index. If that company's stock falls 5% while every other stock is flat, the index falls by 7% of 5%, or 0.35%.
At an illustrative index level of 6,000, a 0.35% fall is 21 index points. The Micro E-mini S&P 500 futures contract (MES) is worth $5 times the index, so those 21 points cost $105 per contract, all from one company's news. One MES contract at that level carries $30,000 of notional exposure, and a 1% index move is 60 points, or $300 per contract.
This is why earnings from the very largest companies can move index futures in a session when hundreds of smaller companies report quietly.
Company size is not position size
The trap for newer traders is reading a company's market cap as a statement about trade risk. A $1 trillion company does not make one MES contract any safer. Your risk on a futures trade comes from the contract's value per point, your stop distance and the number of contracts, and none of those involve company size.
Market cap tells you what might move the index. Your stop and your contract count tell you what that move costs you. Keep the two questions separate and the number stays useful.
On our accounts you trade futures, not shares. The equity index products we list include ES, NQ, YM and RTY and their micros MES, MNQ, MYM and M2K, and we do not offer cash stocks or single stock futures. Position size is set by contract limits (a 50K account allows up to 4 minis or 40 micros), every position must be closed by 4:45 PM ET, and our funded accounts are simulated.
Market Capitalization in Crypto
Crypto borrows the term with a different share count. Investopedia describes the usual method as the current price of a token multiplied by the number of coins in circulation, and notes that analysts also look at fully diluted market cap, which assumes every authorized or maximum possible token has been issued.
The gap between the two can be large. Take a hypothetical token priced at $2 with 500,000,000 coins circulating and a maximum supply of 2,000,000,000:
| Crypto measure | Supply counted | Value at $2 |
|---|---|---|
| Circulating market cap | 500,000,000 tokens | $1 billion |
| Fully diluted valuation | 2,000,000,000 tokens | $4 billion |
Three quarters of that token's potential supply is not trading yet. When a crypto market cap is quoted, check which supply figure it used before comparing it with anything else.
Market Capitalization FAQ
What is market capitalization in easy words?
It is the price of one share multiplied by the number of shares. A company with 400,000,000 shares at $42.50 has a market cap of $17 billion. It changes whenever the share price changes.
Is high market capitalization good?
Not automatically. A high market cap usually points to an established company with more resources and steadier revenue. It can also mean slower growth or a price that already assumes a lot of success. Treat it as a description of size, not a rating.
Is $2 billion a good market cap?
A $2 billion market cap is neither good nor bad; it is a size, right at the line between small-cap and mid-cap under the common FINRA bands. That makes it a size label, not a quality grade. Whether it is "good" depends on the company's earnings, debt and growth, not the number itself.
What is the 7% rule in stocks?
The 7% rule is a loss-cutting guideline from Investor's Business Daily, the publication founded by William O'Neil. IBD's rule is to cut losses at 7% to 8% below your purchase price, so a $10,000 position would be sold after a $700 to $800 loss. A gap through your level can still produce a bigger loss, and the rule has nothing to do with market cap.
Who owns 88% of the stock market?
The wealthiest 10% of US households. Federal Reserve data show they held about 88.1% of household corporate equities and mutual fund shares as of the second quarter of 2026. The figure covers household holdings, not every owner of US stock.
How do I find a specific company's market capitalization?
Multiply its current share price by the shares outstanding from its latest filing, or read the figure from a quote page. That works for any listed company, including Figure Technology Solutions (ticker FIGR) or any other name you look up. The number changes with the share price, so any figure you read is only current for that moment.
Does market cap change every day?
Yes. The price changes with every trade, so the market cap moves through the session. The share count changes less often, through issuance, buybacks and option exercise.
A Five-Point Market Cap Check
Before you use any market capitalization figure, run these five checks:
- Which share count? Outstanding, free float or fully diluted.
- How big is the float? A small float means a thinner market than the headline suggests.
- What is the enterprise value? Add debt and subtract cash to see the whole business.
- Which band table? Find out whose cutoffs the size label uses.
- What decision is it for? Comparing companies and reading index weight, yes. Sizing a trade, no.
Say the number out loud as a product, price times share count, and most of the confusion around market cap goes away.
This guide is educational and is not financial advice or a recommendation to buy or sell any security, fund or contract. All companies, share counts, prices, index levels and weights in the examples are illustrative, not quotes. Stocks can fall sharply regardless of company size, and futures and other leveraged products carry substantial risk of loss, including losses larger than you expect. Simulated, evaluation and funded accounts are simulated and do not reproduce live execution, and past or simulated results do not predict future results.


