



TL;DR: Risk management for traders means pricing the loss before entry, then sizing so a normal losing streak can't end the account. On ten years of ES data, a 1.5x ATR stop cost $120.00 to $858.75 per MES contract. At the top of that range, a 1% cap on $50,000 funds zero contracts. At a 60% loss rate, a 10-loss run within 750 trades has an 84.16% chance, so size for the streak.
Every trader manages risk, whether they mean to or not. The only question is whether the size of the next loss was decided before the order went in, or found out after it filled.
Risk management for traders is the set of decisions that caps what a wrong idea costs: where the idea is invalid, how many contracts that invalidation can afford, how much can be lost in a day or a week, and when to stop trading altogether. This guide works through each control with futures math, a ten-year volatility study on the E-mini S&P 500 and the losing-streak probabilities most rule lists leave out.
Risk Management for Traders Defined
Risk management in trading is deciding, before you enter, how much money you are willing to lose if the trade is wrong, and arranging everything else (size, stop, daily limit) so that number holds.
Two things set the cost of a loss, and you only control one of them. The market decides how far price travels. You decide how much money rides on each point of that travel.
A 20-point stop on the E-mini S&P 500 (ES) is not a risk figure yet. ES pays $50 per index point, so that stop is $1,000 on one contract. The Micro E-mini S&P 500 (MES) pays $5 per point, so the same stop on one MES is $100. Same chart, same stop, a tenfold difference in what the trade can cost.
That is why every useful risk control is a conversion from points to dollars:
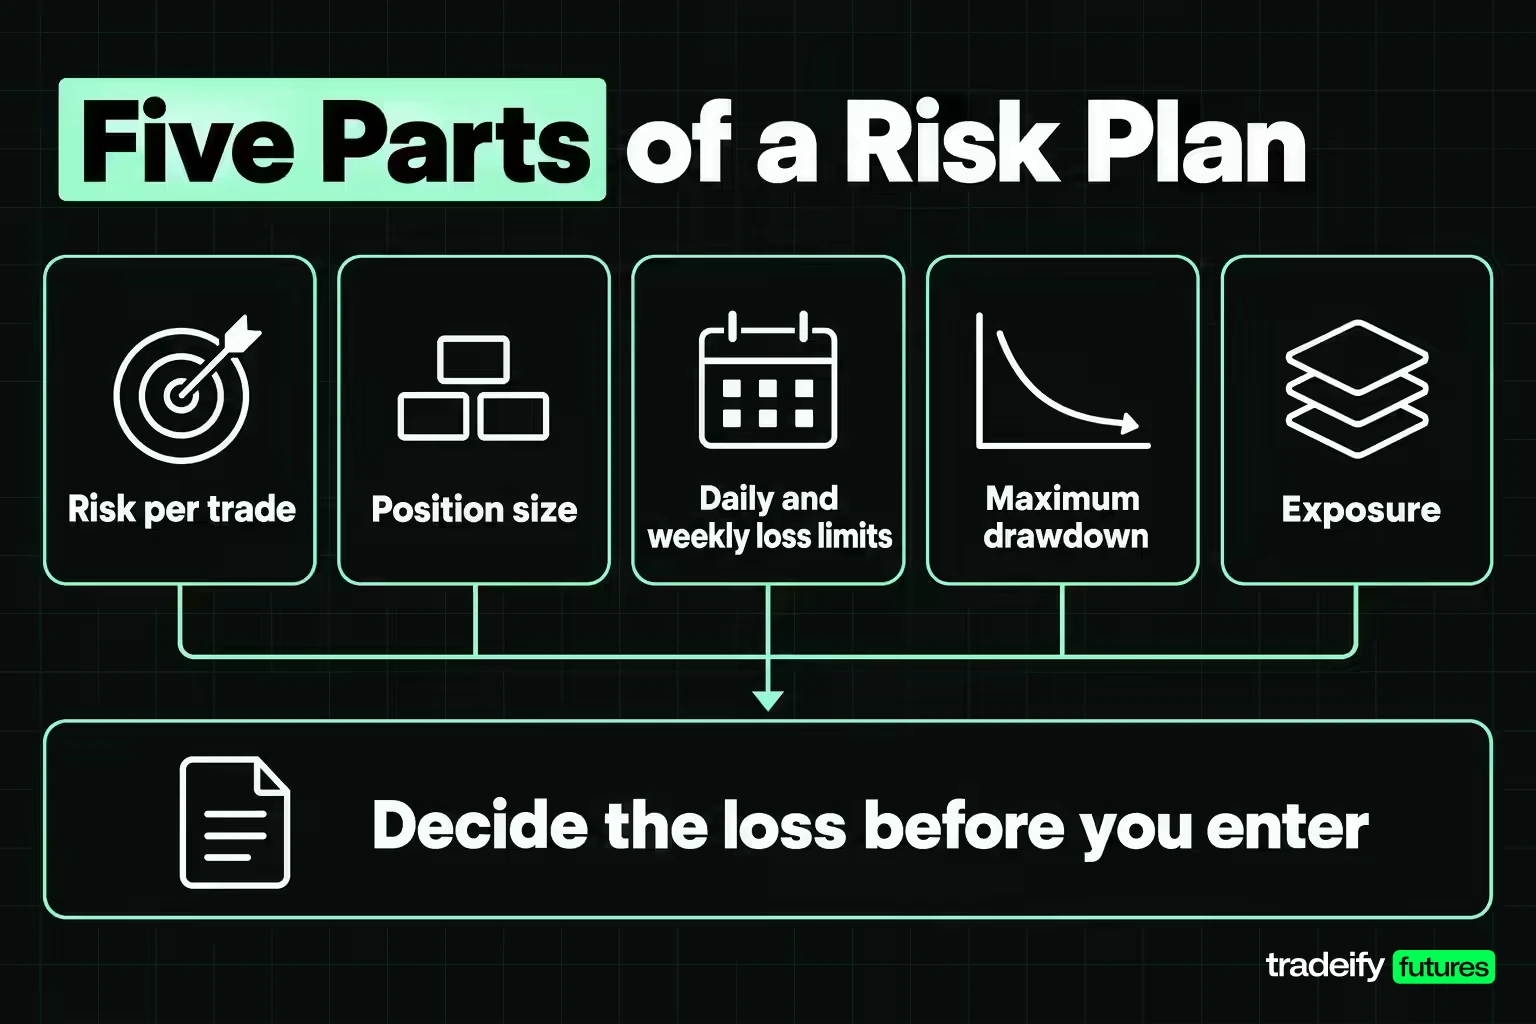
- Risk per trade. The dollar loss you accept if the stop is hit, set before entry.
- Position size. The contract count that keeps the stop inside that dollar figure.
- Daily and weekly loss limits. The point at which you stop trading for the session or the week, measured on equity including open positions.
- Maximum drawdown. The total decline from peak you will tolerate before you stop and rebuild the plan.
- Exposure. The combined risk of every open position, counted as if all stops hit at once.
Good risk management does not make trades win. It makes the losers affordable, so you are still around when the plan's edge, if it has one, gets time to show up.
Types of Trading Risk to Plan For
There is no single official list of trading risks. Textbooks and broker guides group them differently, which is why one source says seven types and another says five. For an active trader, these seven categories cover what actually hits the account.
| Risk type | What it looks like in a trade | Control that answers it |
|---|---|---|
| Market risk | Price moves against the position | Stop based on invalidation, sized in dollars |
| Gap and event risk | Price jumps past your stop on news or at a reopen | Smaller size around scheduled data, flat over closures |
| Liquidity risk | Thin book, wide spread, fills far from the quote | Trade front-month, liquid hours, avoid market orders in thin books |
| Leverage risk | A small move produces a large dollar loss | Size from notional and stop distance, not from margin |
| Operational risk | Platform outage, wrong contract, fat-finger order | Server-side stops, order checks, a backup way to flatten |
| Counterparty risk | The firm holding your funds fails | Know how your funds are held and protected |
| Systemic risk | Market-wide stress, correlated selling, exchange halts | Lower size when volatility jumps, cap total exposure |
Market risk is the one everybody plans for. The others cause the surprises. Gap risk is the reason a stop is not a guaranteed exit. Liquidity risk is the reason a backtest that assumed perfect fills looks better than the live account. Counterparty risk is easy to ignore until the day it isn't. CFTC rules state that funds deposited with a futures commission merchant are not protected by SIPC and are not insured if the firm goes bankrupt.
The practical move is to name the risks that apply to the market you actually trade and write one control next to each. A risk with no written control is a risk you have decided to accept by default.
Position Sizing Turns a Stop Into Dollar Risk
Position sizing is where risk management stops being a principle and becomes a number. The formula has three inputs and one rule.
Contracts = dollar risk per trade ÷ (stop distance in points × dollars per point), rounded down.
Take an illustrative $50,000 account that risks 1% per trade, which is $500. The setup's invalidation sits 12 points below entry on MES. At $5 per point, one MES risks $60. $500 ÷ $60 = 8.33, so the size is 8 contracts, and the real risk is 8 × $60 = $480.
Two details in that example matter more than the formula.
First, round down, never up. Rounding to 9 contracts would risk $540, which breaks the cap on the first trade. Second, check what the rounded size actually risks. In whole contracts, the real risk is almost always below the cap, and on a small account it can sit well below it or be impossible to express at all.
Related lesson: Position sizing
Where the 1% and 2% Risk Rules Come From
The 2% rule says never to put more than 2% of account equity at risk on one trade. CME Group's education course uses it with a $50,000 account, which could risk up to $1,000 per trade, and calls the 2% threshold itself "completely arbitrary". The 1% version is the same idea with a tighter cap.
Neither number is a law, and neither comes from a study. They are conventions that keep a single loss small relative to the account. In forex the rule works the same way: you size the lot so the pip distance to your stop, times the pip value, stays under 2% of equity.
The better question is not which percentage is correct but what that percentage survives. A 2% cap and a 10% drawdown limit leave room for five losses. Whether five losses is a lot depends on your win rate. At a 50% loss rate over 750 trades, a run of five or more losses in a row is close to certain.
Stop-Loss Orders and Where Risk Leaks Through
A stop-loss order is the tool that turns your invalidation level into an exit. It is also the place where planned risk and actual risk most often part ways, because each stop type trades one failure for another.
| Stop type | What happens when price reaches it | What can go wrong |
|---|---|---|
| Stop (stop market) | Becomes a market order and fills at the next available price | Slippage past the stop in fast or gapping markets |
| Stop-limit | Becomes a limit order at your limit price | May not fill at all if price runs through the limit |
| Trailing stop | Stop level follows price by a set distance and never moves back | Too tight and normal noise exits a good trade |
| Guaranteed stop | Fills exactly at the stop for a premium if triggered | Offered by some CFD and spread-bet providers, not on exchange-traded futures |
The SEC's definition is the one to remember: when the stop price is reached, a stop order becomes a market order. A market order guarantees execution, not price. So the loss you planned is the loss at the stop price, and the loss you take is the loss at the fill.
Stop-limit orders fix the price problem by creating a fill problem. If the market gaps through both the stop and the limit, you are still in the trade, and the loss keeps growing until you act. For a protective exit, most traders accept slippage over the chance of no fill.
Guaranteed stops come up in many broker guides because CFD and spread-bet providers sell them. CMC Markets, for example, describes its guaranteed stop-loss order as closing the trade at the specified price regardless of gapping, for a premium charge. CME Globex's futures order types list stop-limit and stop with protection, but no guaranteed stop, so a futures trader plans for slippage instead of paying it away.
Placing the Stop Where the Idea Is Wrong
Place the stop where the trade idea is invalid, then size to that distance. The common mistake runs the other way: picking a dollar loss first and placing the stop wherever that dollar figure lands. A stop placed for budget reasons usually sits inside normal noise, which turns a sound idea into a string of small stop-outs.
If the honest invalidation is too far away for your risk cap, the answer is fewer contracts, a smaller contract or no trade. Moving the stop closer to make the size work only changes how often you get stopped.
Related lesson: Stop-loss orders and placement
Risk-Reward Ratio and Break-Even Win Rate
The risk-reward ratio compares what a trade stands to make at its target with what it stands to lose at its stop. On its own it says very little. Paired with a win rate, it tells you whether the strategy pays.
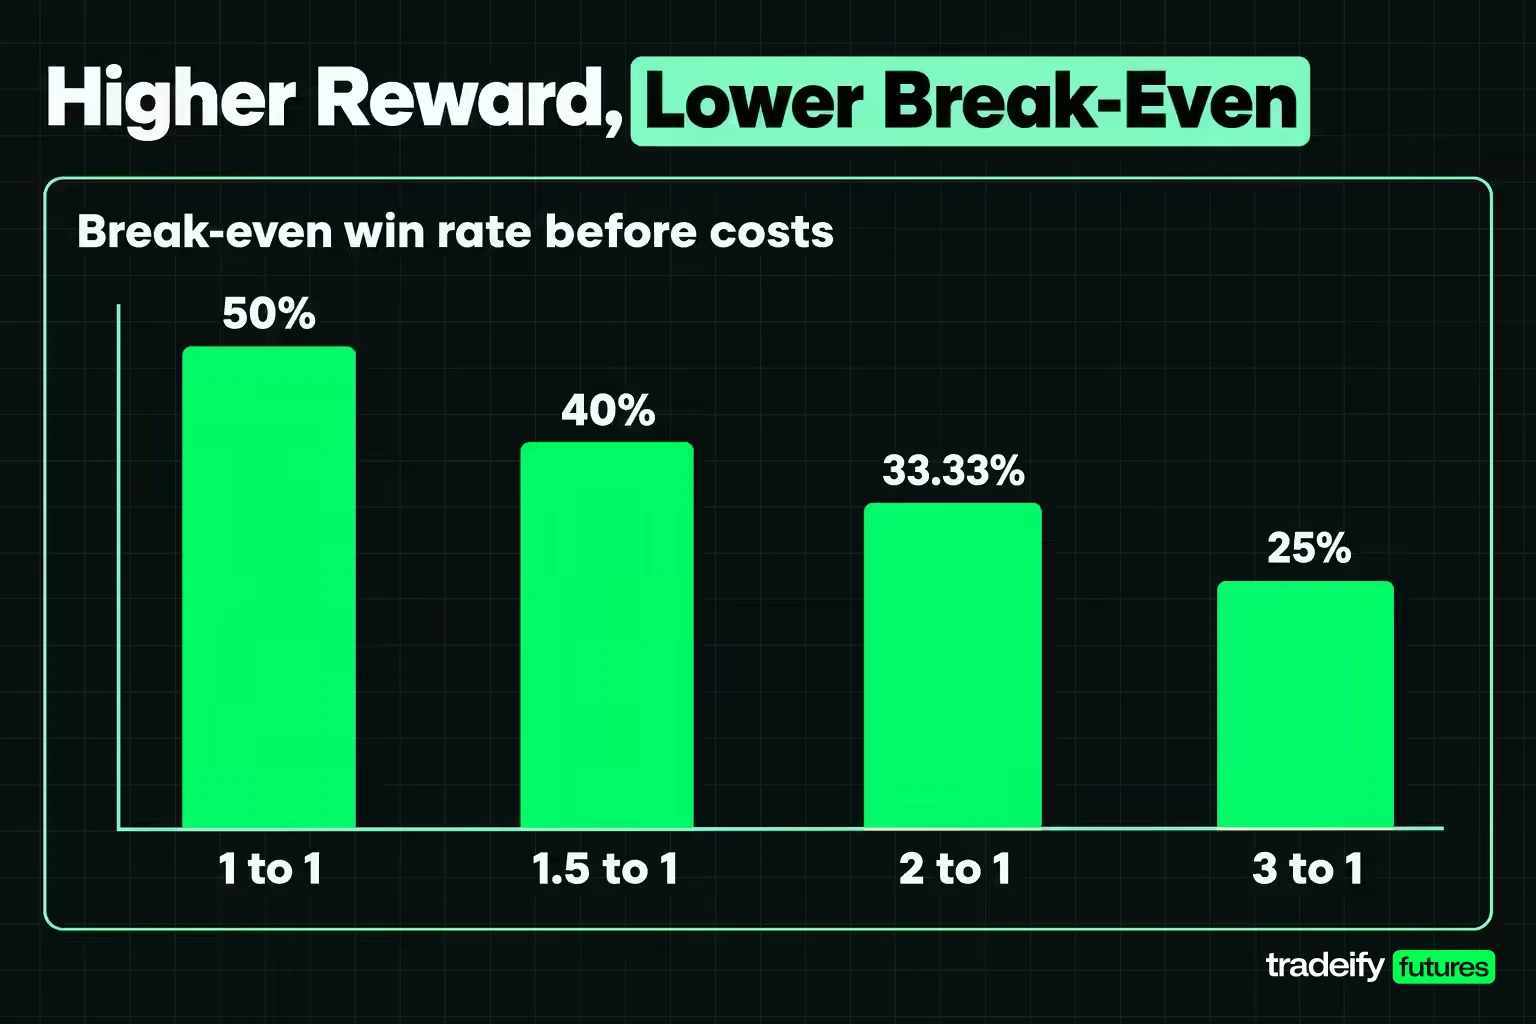
The break-even win rate for a ratio of R to 1 is 1 ÷ (1 + R). Below that, the strategy loses money before costs. Above it, the strategy has a positive expectancy before costs.
| Reward to risk | Break-even win rate before costs |
|---|---|
| 1 to 1 | 50% |
| 1.5 to 1 | 40% |
| 2 to 1 | 33.33% |
| 3 to 1 | 25% |
A 3 to 1 target looks attractive in a spreadsheet because the break-even bar is low. The catch is that farther targets get hit less often. A target the market rarely reaches produces a ratio that is real on paper and a win rate that never arrives.
Expectancy puts both numbers together. A strategy that wins 40% of the time at 2 to 1 makes (0.40 × 2) − (0.60 × 1) = 0.20R per trade before costs. At $480 risked per trade, that is about $96 per trade on average, and it arrives as a lumpy series that includes long losing runs.
Notice the 60% loss rate in that example. It is a perfectly viable strategy, and it still produces long losing runs: over 750 independent trades at a 60% loss rate, the median longest losing streak is 11. High reward-to-risk and long losing streaks come together.
Related lesson: Risk-reward ratio
Take-Profit Orders and Exit Strategy
An exit strategy decides in advance how a trade ends, for losers and winners alike. The losing exit is the stop. The winning exit is the part most traders leave to feel, and it is where good trades turn into breakeven trades.
A take-profit order is a limit order resting at your target. Because it is a limit order, it fills only at your price or better, so it gives you a known exit price but no guarantee that price will be reached.
Common ways to plan the winning exit:
- Fixed target. One limit order at a level chosen before entry, such as the prior swing high or a set multiple of the stop distance.
- Scale out. Take part of the position at a first target and leave the rest with the stop moved closer.
- Trailing exit. Let a trailing stop follow price, which captures more of an extended move and gives some back at the end.
- Time stop. Exit if the trade has not worked within a set number of bars or by a set time of day, because the reason for the trade has expired.
A bracket order links the two exits: once the entry fills, a stop and a target are placed together, and when one fills the other is cancelled. That one-cancels-other link is the main protection against the classic error of a target filling while a forgotten stop later opens a fresh position.
Exit Rules for Losing and Winning Trades
The temptation on a winner is to grab the profit early because a loss earlier in the day still stings. The temptation on a loser is to move the stop because the idea "just needs room". Both feel like risk management in the moment. Both change the expectancy the plan was built on.
Write the exit rule once, while flat, and judge the trade on whether you followed it, not on how it ended. A clean stop-out on a valid setup is a correct trade. A winner that broke the exit rule is a lucky one, and luck does not repeat on schedule.
Related lesson: Take-profit orders and targets
Volatility Changes What the Same Risk Rule Costs
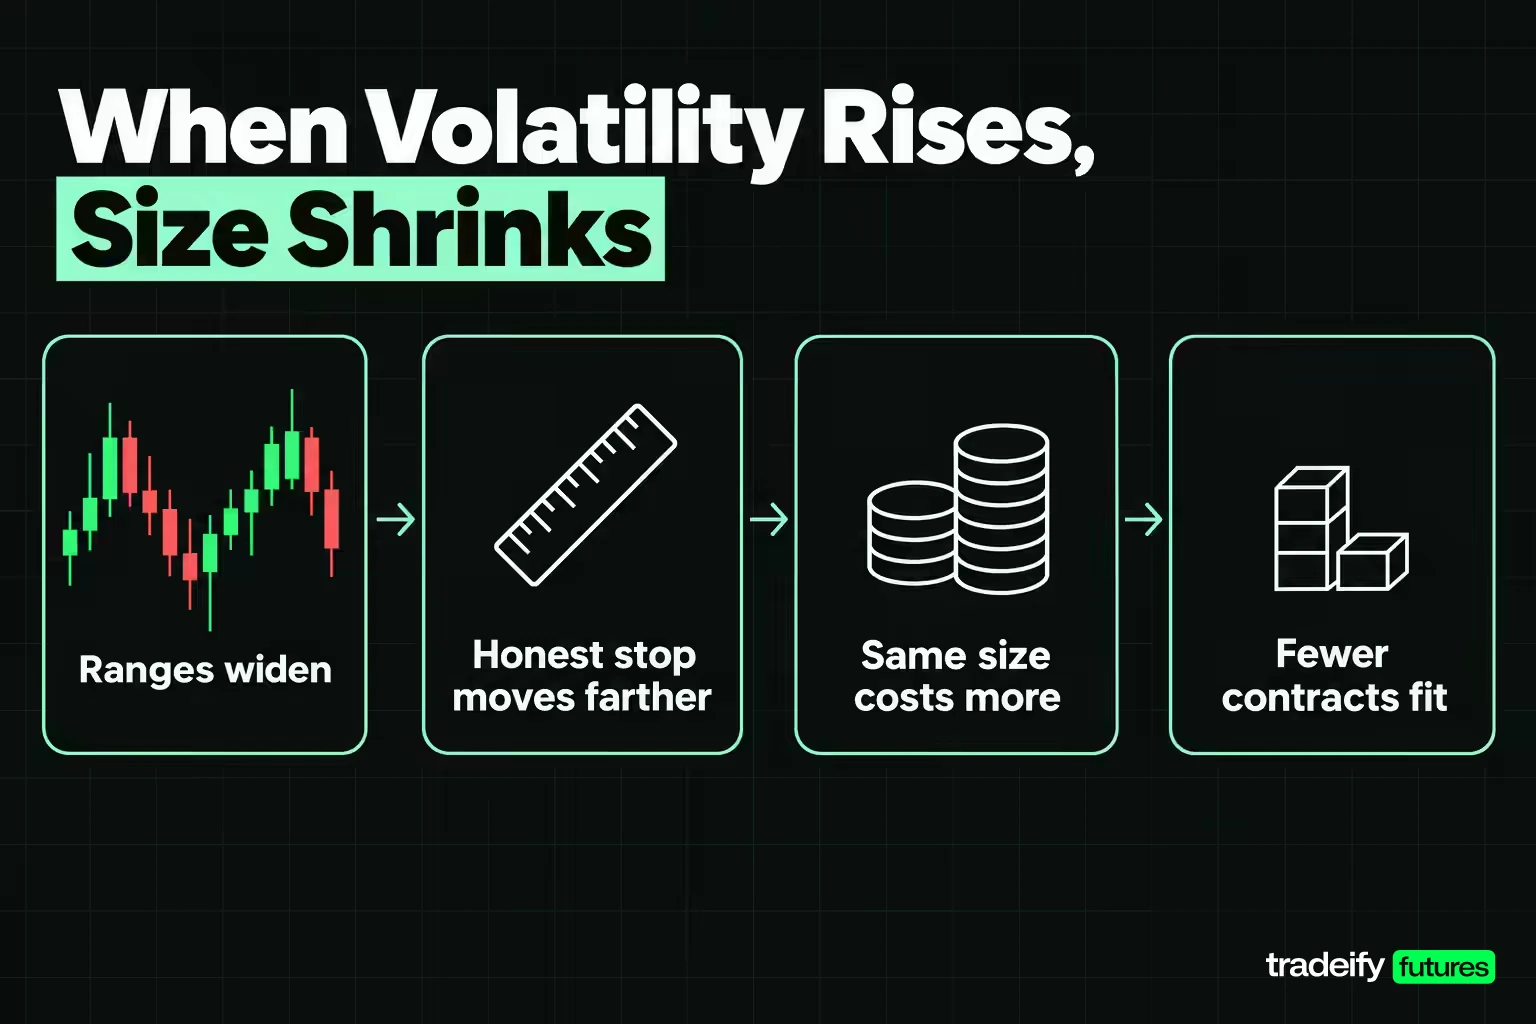
Volatility is the reason a fixed risk rule does not produce a fixed risk. When ranges widen, an honest stop moves farther away, and the same contract count costs more.
Here is how big that effect is on one market. The illustrative study behind this section uses ES daily bars from Yahoo Finance for the continuous front-month contract (ES=F) from November 1, 2016 to October 29, 2026: 2,516 timestamped sessions, 2 of which had a missing quote, leaving 2,514 usable sessions. For each session it computes the 20-session average true range (ATR), then takes the 5th, 25th, 50th, 75th and 95th percentiles of those 2,494 ATR readings by nearest rank. The stop is 1.5 times ATR, rounded to the 0.25-point tick, on an illustrative $50,000 account with a 1% ($500) risk cap.
| ATR percentile | 20-session ATR (points) | 1.5x ATR stop (points) | Risk per MES | Risk per ES | MES contracts at $500 cap | Actual risk |
|---|---|---|---|---|---|---|
| 5th (calm) | 15.96 | 24.00 | $120.00 | $1,200.00 | 4 | $480.00 (0.96%) |
| 25th | 36.84 | 55.25 | $276.25 | $2,762.50 | 1 | $276.25 (0.55%) |
| 50th (median) | 56.11 | 84.25 | $421.25 | $4,212.50 | 1 | $421.25 (0.84%) |
| 75th | 77.37 | 116.00 | $580.00 | $5,800.00 | 0 | One MES would be 1.16% |
| 95th (stressed) | 114.46 | 171.75 | $858.75 | $8,587.50 | 0 | One MES would be 1.72% |
Read the dollar columns first. The same 1.5x ATR rule costs $120.00 per MES in a calm market and $858.75 in a stressed one, roughly a sevenfold swing for an identical rule.
When a Percentage Risk Cap Funds Zero Contracts
A percentage cap can round down to nothing. In the ES volatility study, on an illustrative $50,000 account with a 1% ($500) cap and a 1.5x ATR stop, the median-volatility stop funds one MES and actually risks 0.84%. At the 75th percentile, it funds nothing, because one MES alone would risk 1.16%. At the 95th, one MES is 1.72% of the account.
A small account cannot pick any risk it likes. It can only choose among the risks its smallest contract allows. When volatility rises past that point, the choices are to take a wider risk than the plan allows, to tighten the stop inside normal noise, or to stand aside. Standing aside is a legitimate risk decision, not a missed opportunity.
The highest 20-session ATR in the ES sample was 227.69 points, in April 2025, about double the 95th percentile. In late October 2026 the reading was 85.86 points, just above the median. Volatility clusters, so the size that fit last month may not fit this week.
Related lesson: Average true range
Leverage and Margin Risk in Futures
Leverage is what lets a small move produce a large dollar result. In futures, it comes from the gap between a contract's notional value and the margin needed to hold it.
Notional value is the index level times the contract multiplier. At an illustrative S&P 500 level of 7,000 (a round number, not a quote), one ES controls $350,000 of exposure and one MES controls $35,000.
Margin is not the cost of that exposure. The CFTC glossary puts it plainly: margin is not partial payment on a purchase, and it is also called a performance bond. It is a good-faith deposit. CME Clearing recalculates performance bond requirements at least once a day and changes them with volatility, and brokers can require more than the exchange minimum. Any margin figure you read is a snapshot that can change, so plan with the broker's current number and expect it to move when markets get rough.
Measuring Leverage From Notional, Not Margin
The useful leverage number is notional exposure divided by account equity. One ES on a $50,000 account at the illustrative 7,000 level is $350,000 ÷ $50,000 = 7 times leverage. Four MES is $140,000, or 2.8 times.
Margin tells you whether you can open the position. It says nothing about what the position can lose. A trader who sizes by "how many contracts my margin allows" is sizing by the broker's minimum, not by the stop, and that is how a few points against a full-margin position become a large share of the account.
Size from the stop and the dollar risk first (dollar risk divided by stop distance times dollars per point), then check the resulting notional leverage as a second filter. If the leverage figure makes you uncomfortable, it is telling you something the stop distance alone did not.
Drawdown Risk and Losing Streaks
A risk-per-trade cap limits the size of each loss. It does not limit how many losses arrive in a row. So a drawdown limit is only as safe as the losing-streak assumption behind it.
Streaks are longer than intuition expects. The probabilities below are exact calculations, not simulations, for independent trades: 750 trades, which is three trades a session over 250 sessions, roughly a trading year.
| Loss rate per trade | Median longest losing streak | Chance of 10+ losses in a row | Chance of 12+ | Chance of 15+ |
|---|---|---|---|---|
| 50% | 9 | 30.52% | 8.65% | 1.12% |
| 60% | 11 | 84.16% | 47.89% | 12.99% |
At one trade a session for 250 sessions, the median longest streak is 7 at a 50% loss rate and 9 at a 60% loss rate. Trading more often does not change the odds of any single trade, but it gives the long streak more chances to happen.
Testing a Drawdown Limit Against the Streak
Now put a limit on it. Take the illustrative $50,000 account with a 10% drawdown limit, $5,000, and count how many full losses in a row reach that line at each risk level.
| Risk per trade | Dollar loss per trade | Losses in a row to reach $5,000 | Chance of that streak at 50% loss rate | Chance at 60% loss rate |
|---|---|---|---|---|
| 0.5% | $250 | 20 | 0.03% | 1.07% |
| 1% | $500 | 10 | 30.52% | 84.16% |
| 2% | $1,000 | 5 | above 99.99% | above 99.99% |
| 3% | $1,500 | 4 | above 99.99% | above 99.99% |
Sit with the 1% risk level for a second. A strategy that wins 40% of the time at 2 to 1 has a positive expectancy, and at a fixed $500 risk it still has an 84.16% chance of a ten-loss run within a year of 750 trades, which is enough on its own to reach the line. The strategy is fine. The size is what breaks.
These figures understate the real risk, because drawdowns also build from mixed sequences such as six losses, one win and five more losses. A pure streak is the lower bound.
Recovery Math After a Drawdown
Recovery is not symmetric. After a loss, the account is smaller, so getting back to even takes a larger percentage gain than the loss.
| Drawdown | Gain needed to get back to even |
|---|---|
| 5% | 5.26% |
| 10% | 11.11% |
| 20% | 25% |
| 30% | 42.86% |
| 50% | 100% |
Fixed-fractional sizing softens the slide. Risking 1% of current equity rather than a fixed $500, ten straight losses cost 9.56% of the account instead of 10%, because each loss is a little smaller than the last. In whole futures contracts that effect only works once equity falls far enough to drop a contract, so recompute size from current equity after every loss rather than from the starting balance.
For scale, real markets do produce these runs. In this guide's ES study of Yahoo Finance daily data from November 2016 to October 2026, 45.2% of sessions closed lower than the prior session, and the longest run of consecutive down closes was 8 sessions, from December 12 to December 24, 2018, with the close falling from 2,652.50 to 2,341.75, a drop of 11.72%.
Related lesson: Risk of ruin
Correlated Positions, Hedging and Diversification Risk
Correlation is how a careful per-trade cap turns into an oversized bet. Three positions that each risk 1% and all lean the same way are not three small risks. If they move together, they are one 3% risk counted three times.
Equity index futures are the obvious case. ES, NQ, YM and RTY often move in the same direction on the same news. Long ES and long NQ at the same time is mostly one trade on US stocks with two stop orders. The check that catches it is adding the open stops of every same-direction position and comparing the total with your daily limit, not counting tickets.
Hedging means taking an offsetting position to reduce exposure, such as selling index futures against a long stock portfolio. For a long-term portfolio that can be a sound tool. For a short-term trader it often becomes a way to avoid taking a loss: the hedge freezes the loss in place instead of closing it, and you now pay costs on two positions. Many prop firms also prohibit opposing positions in related products, so check the rules before treating a hedge as a risk control.
Diversification spreads risk across uncorrelated strategies or markets. It helps only when the correlations hold, and correlations between risk assets tend to rise during market stress, which is exactly when you need them low.
Related lesson: Correlation risk
A Trading Plan That Puts Risk Rules in Writing
A trading plan is where risk rules stop being intentions. If a rule is not written down before the session, it will get renegotiated during it, usually right after a loss.
A plan that covers risk should state:
- The markets and contracts you trade, with their dollars per point.
- The setups you take and what invalidates each one.
- Risk per trade in dollars, and the rounding rule for size.
- Daily and weekly loss limits measured on equity, and what you do when one is hit.
- The maximum drawdown that triggers a pause and a review.
- When you do not trade: scheduled news, the last minutes before a forced close, after a set number of losses.
Pre-Trade Risk Checklist
Run these six questions in order before every entry. Each one has an answer you can write down in under a minute.
- Where is the price that proves the idea wrong?
- How far is that from entry in points, and what is it worth per contract in dollars?
- What is my dollar risk cap for this trade, and what contract count does it fund after rounding down?
- What does that rounded count actually risk, as a percentage of current equity?
- What is my total open risk in this direction if every stop hits at once?
- If this trade loses, where does that leave me against today's loss limit?
Question five is the one that separates a real limit from a decorative one, because it catches correlated positions. Question six is the one that stops a trader from taking a full-size trade with only half a trade's room left in the day.
Related lesson: How to create a trading plan
Emotional Trading Habits That Break Risk Rules
Most risk rules fail through behavior, not math. The numbers in a plan are easy to agree with while flat. They get hard to follow the moment a loss makes the next trade feel like a chance to get even.
The patterns are familiar:
- Revenge trading. Taking a lower-quality setup, often larger, right after a loss to win the money back.
- Moving the stop. Widening a stop that is about to be hit because the idea "still works".
- Size creep. Adding a contract after a few winners because the strategy "is working right now".
- Cutting winners short. Grabbing a small profit to feel safe after an earlier loss, which breaks the risk-reward math the plan depends on.
- Freezing. Skipping valid setups after a losing streak, which removes the winners that pay for the streak.
Every one of these makes sense when it happens, and none of them gets fixed by trying harder in the moment. They are fixed by deciding the rule while calm and making it hard to break while upset.
Practical ways to do that: a hard daily loss limit that ends the session, a cool-off period after a set number of consecutive losses, and size that only changes at a weekly review, never mid-session. Many trading platforms offer personal loss limits or lockouts that flatten positions and block new orders once a threshold is hit. Using one is not a sign of weak discipline. It is a decision made by the calmer version of you.
A clean loss on a valid setup does not call for a response. It calls for the same size on the next valid setup.
Related lesson: Trading psychology
Monitoring Risk With a Journal and Backtests
You cannot manage a risk you never measure. A trading journal turns "I think I'm disciplined" into numbers that either agree or don't.
Log these for every trade:
- Planned stop and target in points and in dollars at the size traded.
- Actual entry, exit and slippage against the planned prices.
- Whether the exit followed the written rule.
- Running equity after the trade and distance to the daily and overall limits.
Review weekly. The numbers that matter for risk are the average loss compared with the planned loss (if actual losses run larger, stops are slipping or being moved), the longest losing streak against what your win rate predicts, and the largest peak-to-trough drawdown so far.
Backtesting and market replay test risk rules before money is involved. Run the strategy's historical trades through your size and limit rules and count how often the daily limit or the drawdown line would have been hit. A rule that looks fine on average and breaches the line twice a year in the backtest is a rule that needs a smaller size, not more confidence.
A quick test from your own records: take the median dollar loss of your last 20 losing trades, multiply it by 10, and compare that with your drawdown limit. If ten losses reach the line, the size or the limit has to change before the next session.
Related lesson: How to keep a trading journal
Prop Firm Evaluation Risk Rules for Drawdown and Daily Loss
In a prop firm evaluation, part of your risk plan is written for you. The account size, the maximum drawdown and often a daily loss limit are fixed by the rules, so position sizing starts from the drawdown in dollars, not from the account balance.
That changes the math. A $50,000 account with a much smaller drawdown allowance should be sized against the allowance. A trailing drawdown, which rises with the account's high point, also removes the cushion that early profits would give under a fixed limit. Treat the trailing line as the real account and run the streak test against it.
Daily loss limits in evaluations work as circuit breakers, not stops. Slippage can carry a loss past the limit before it triggers, so the per-trade stop has to do the protecting.
On our accounts, the maximum trailing drawdown updates at the end of each day but is enforced in real time on net liquidation value, so an open losing position can fail the account before it is closed. Growth evaluations add a daily loss limit, $1,250 on a 50K account, that pauses trading until the next trading day; our Help Center is clear that it should never be used as a stop. A 50K account can hold up to 4 minis or 40 micros, every position must be closed by 4:45 PM ET, and funded accounts are simulated.
Risk Management for Traders FAQ
Is it true that 97% of day traders lose money?
It is true for one well-known study, not as a universal rule. The 97% figure comes from Chague, De-Losso and Giovannetti's study of everyone who began day trading Brazilian equity index futures between 2013 and 2015. Of the 1,551 who kept going for more than 300 days, 97% lost money, and only 1.1% earned more than the Brazilian minimum wage. It is one market and one period, not a universal law, but it is the best-known measured version of the claim.
What is the 2% rule in forex?
The 2% rule says not to risk more than 2% of account equity on a single trade. On a $50,000 account that is $1,000, and you size the position so the pip distance to your stop times the pip value stays under that figure. It is a convention, not a regulation, and many traders use 1% or less.
What are the 7 types of risks?
There is no official list, but a useful set of seven for traders is market risk, gap and event risk, liquidity risk, leverage risk, operational risk, counterparty risk and systemic risk. Each one needs its own written control in the trading plan.
How many losses in a row should a trader plan for?
Plan for at least ten. By exact probability math for independent trades, the median longest losing streak over 750 trades is 11 at a 60% loss rate and 9 at a 50% loss rate. Size so that a streak of that length stays well inside your drawdown limit.
Does a daily loss limit reduce risk?
Only if it counts open positions and actually ends the session. A limit measured on closed trades alone can be dodged by holding a losing position. Set it in dollars, include unrealized losses and use a platform lockout if one is available.
Risk note: futures trading uses leverage and can produce losses larger than expected, including losses beyond a planned stop when markets gap or move fast. The ES volatility figures and streak probabilities in this guide are illustrative calculations from historical data and stated assumptions, not forecasts or performance records. Evaluation and funded accounts are simulated. This guide is educational and is not investment advice.


