




TL;DR: Smart beta and factor investing swap pure market-cap weighting for published rules that tilt a portfolio toward value, momentum or quality. Factors can lag for years: value lost 55.8% from 2007 to 2020 while stocks beat T-bills by about 240%. Read the index methodology, compare it with a plain cap-weighted fund, and size the tilt so you can hold it through a long slump.
You have a plain S&P 500 fund on one screen and a "multifactor" ETF on the other. The factor fund costs more, and its backtest chart looks better. The tempting move is to buy the better line.
Smart beta and factor investing sit between buying the whole market and picking stocks yourself. A fund follows an index, so it feels passive. Somebody chose the rules behind that index, so it is also an active bet, and that bet can go years without paying.
Two funds can both say "value" on the label, own different stocks, carry different sector weights and behave nothing alike when market leadership flips. This guide covers what the terms mean, how these indexes are built, the factors themselves, what six decades of factor data show about the good and bad stretches, how to read a factor ETF next to a plain S&P 500 fund, and a process for deciding whether a tilt belongs in a portfolio at all.
What Smart Beta and Factor Investing Mean
Smart beta and factor investing describe the same family of strategies from two angles. Factor investing names the exposure: owning more of the stocks that share a measurable trait linked to differences in risk and return. Smart beta names the delivery vehicle: an index, usually tracked by an ETF, that follows published rules to get that exposure instead of weighting companies only by market value.
Beta, cap weighting and what smart beta changes
Beta in investing describes exposure to the overall market. A broad index fund gives you that exposure as cheaply as possible, and the standard way to build it is market-cap weighting. The S&P 500, for example, is weighted by float-adjusted market capitalization, so the largest companies get the largest weights and a stock's weight grows as its price rises.
Smart beta keeps the index format but changes the selection or weighting rule. A strategy might give every company the same weight, favor stocks that look cheap against their fundamentals, tilt toward profitable companies with low debt, or hold the stocks that have moved least. MSCI describes its factor indexes as rules-based indexes built to capture systematic factors that have historically earned a premium over long periods, naming value, low size, low volatility, high yield, quality, momentum and growth.
Related lesson: Beta and market risk
Why the smart beta label says little
"Smart" is a marketing word, not a finding. Nothing about the label proves the rules beat a cap-weighted index after costs. It tells you only that the fund departs from market-cap weighting on purpose.
Smart beta is also not active management in the usual sense. There is no manager deciding each week what to buy. The judgment sits up front, in the choice of factor, the formula, the starting universe and the rebalance calendar. After that, the rules run mechanically, which is both the appeal and the risk.
How Smart Beta Indexes Are Built
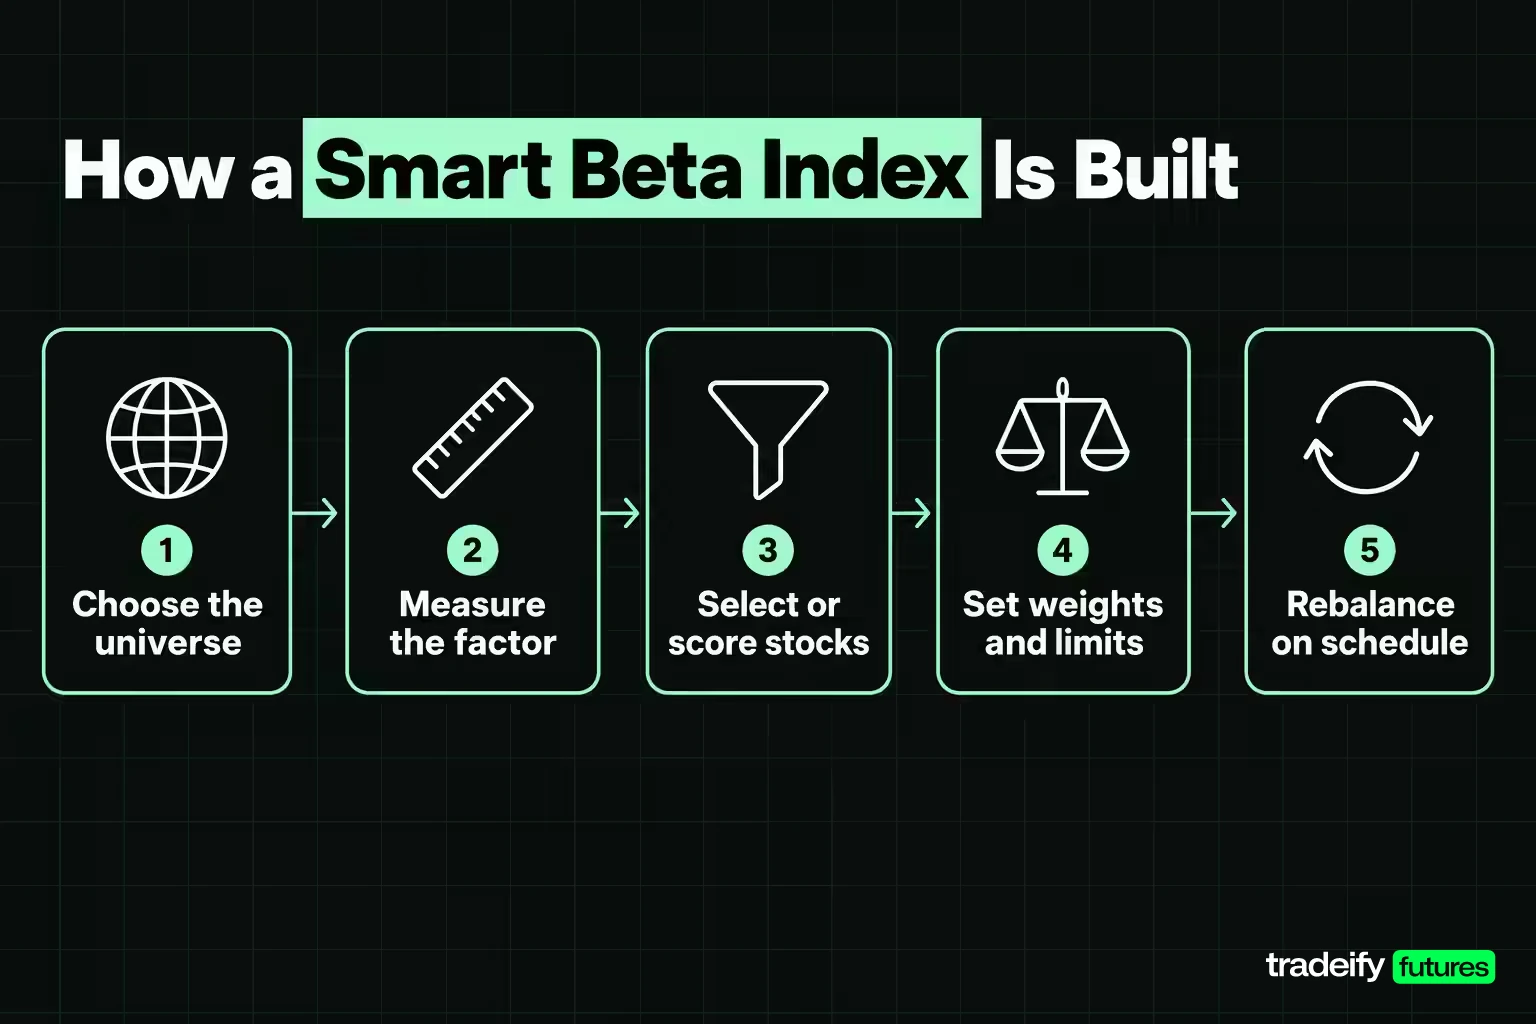
A smart beta index is a recipe applied to a starting list of stocks. Reading the recipe matters more than reading the fund name, because each step changes what you end up owning.
Most smart beta methodologies follow the same sequence:
- Choose the universe, such as U.S. large caps or developed-market stocks.
- Measure the factor with specific inputs, for example price-to-book and earnings yield for value, or return on equity and debt for quality.
- Select or score stocks, either keeping only the top-ranked names or holding the whole universe with adjusted weights.
- Set weights and limits, including caps on single stocks, sectors and turnover.
- Rebalance on a fixed schedule, such as quarterly or twice a year, and reset weights to the target.
Weighting methods in smart beta
Weighting is where most smart beta strategies part company with a standard index. The main options are:
- Equal weight. Every stock gets the same weight at each rebalance. S&P's equal weight indices hold the same constituents as the parent index, with each company equally weighted as of the rebalance reference date.
- Fundamental weight. Stocks are weighted by business size measures instead of market value. Arnott, Hsu and Moore's 2005 Financial Analysts Journal paper built indexes weighted by revenue, book value, sales, dividends, cash flow and employment, arguing that cap weighting automatically overweights any stock that is overpriced.
- Factor-score weight. Stocks with stronger factor scores get larger weights, which strengthens the tilt and moves the portfolio further from the market.
- Risk-based weight. Weights come from volatility or an optimizer, as in minimum-volatility indexes, aiming for a smoother portfolio rather than a particular style.
A four-stock smart beta weighting example
The numbers below are illustrative. Take four companies with market caps of $600 billion, $250 billion, $100 billion and $50 billion, a total of $1,000 billion. Their annual sales are $100 billion, $150 billion, $150 billion and $100 billion, a total of $500 billion.
| Company | Cap weight | Equal weight | Sales weight |
|---|---|---|---|
| A ($600 billion cap) | 60% | 25% | 20% |
| B ($250 billion cap) | 25% | 25% | 30% |
| C ($100 billion cap) | 10% | 25% | 30% |
| D ($50 billion cap) | 5% | 25% | 20% |
Now run two moves through each index, holding the other stocks flat.
| Scenario | Cap-weighted return | Equal-weighted return | Sales-weighted return |
|---|---|---|---|
| A falls 20% | -12.0% | -5.0% | -4.0% |
| D rises 40% | +2.0% | +10.0% | +8.0% |
Same four companies, very different results. The cap-weighted index lives and dies with its largest holding. The equal and fundamental versions give smaller companies a real voice, which helps when they lead and hurts when the giants carry the market. That is a size tilt, whether or not the fund mentions size.
Customization in smart beta rules
Index providers and asset managers can adjust almost every step. Common changes include sector-neutral versions that keep sector weights close to the parent index, caps on how far any weight can move from the benchmark, liquidity screens, and turnover buffers that stop a stock bouncing in and out at every rebalance. Each tweak trades purity of the factor for familiarity and lower cost. A sector-neutral quality index will look more like the market than an unconstrained one, and it will also deliver less of the quality tilt.
The Main Factors in Factor Investing
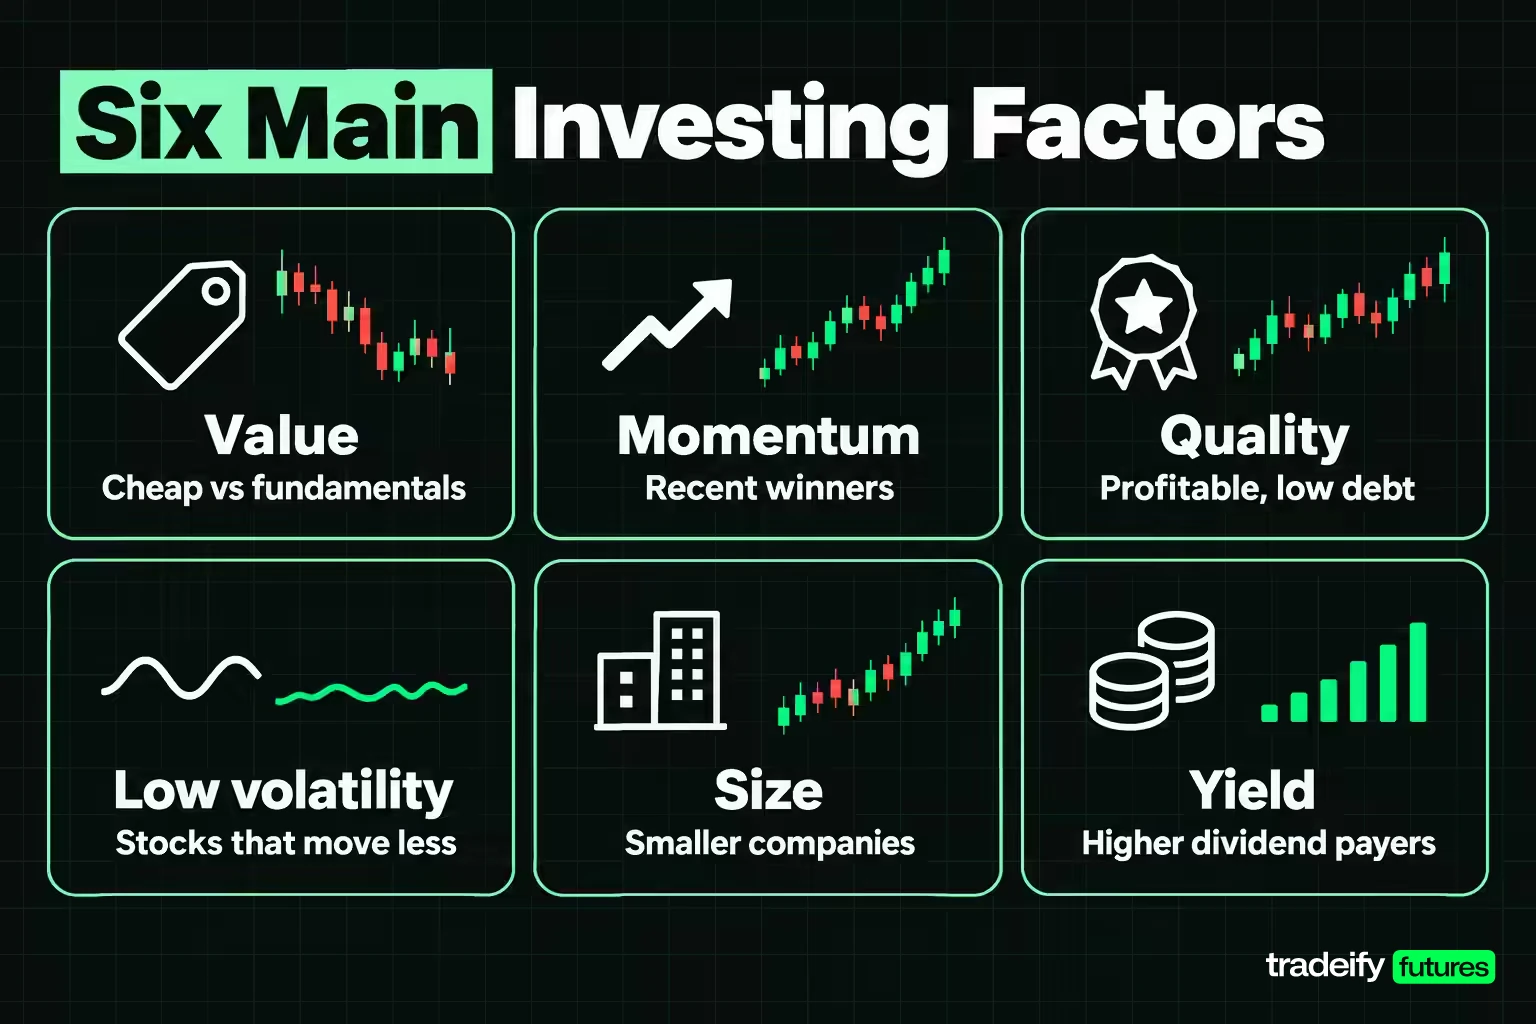
Factor investing rests on a handful of traits that academic and industry research keep returning to. Each one has a plain-English idea behind it, a measurement choice that changes the holdings, and a typical way it disappoints.
| Factor | What it targets | Common measures | Typical failure mode |
|---|---|---|---|
| Value | Stocks priced cheaply against fundamentals | Book-to-market, earnings yield, cash flow yield | Long stretches behind the market, cheap stocks that stay cheap |
| Momentum | Recent winners | Return over roughly the past 12 months, skipping the latest month | Sharp crashes when market leadership reverses |
| Quality | Profitable, stable, low-debt companies | Return on equity, debt-to-equity, earnings variability | Expensive holdings, lag in junk-led rallies |
| Low volatility | Stocks that move less | Past volatility, beta, optimizer output | Sector concentration, misses sharp rallies |
| Size | Smaller companies | Market capitalization | Premium contested, long dry spells |
| Yield | Higher dividend payers | Dividend yield | Rate sensitivity, dividend traps |
Value factor
Value buys what looks cheap against book value, earnings or cash flow. In the Fama-French data, value is measured as HML (high minus low book-to-market). The hard part is that "cheap" often reflects a real problem in the business, so better-designed value indexes combine several ratios and screen for balance sheet quality. MSCI classes value as a pro-cyclical factor.
Momentum factor
Momentum buys recent winners and avoids recent losers. The standard academic version, used in the Ken French Data Library, ranks stocks on returns from 12 months back to 2 months back, skipping the latest month because very short-term returns tend to reverse. Momentum rebalances often, so turnover and trading costs matter more here than for other factors. MSCI notes that value and momentum typically move in opposite directions.
Quality factor
Quality favors companies with steady profits and manageable debt. There is no single definition. MSCI's quality indexes use return on equity, debt-to-equity and earnings variability, while the Fama-French profitability factor (RMW, robust minus weak) uses operating profitability alone. MSCI classes quality as a defensive factor.
Low-volatility factor
Low-volatility strategies hold stocks that have moved less than their peers. They aim to change the shape of the ride, not remove risk. These portfolios tend to pile into defensive sectors and can trail badly in a sharp rally.
Size and yield factors
The size factor (SMB, small minus big) holds smaller companies against larger ones. MSCI itself notes that some academics and practitioners contest whether a size premium still exists. Yield strategies favor dividend payers, which can drift toward rate-sensitive sectors and toward companies whose high yield reflects a falling share price.
The five factors of the Fama-French model
When people ask for "the five factors," they usually mean the Fama-French five-factor model: market (the return on stocks over Treasury bills), size (SMB), value (HML), profitability (RMW) and investment (CMA, conservative minus aggressive, which favors firms that grow their assets slowly). Momentum is not one of the five, although most factor products treat it as a core factor.
Averages from the Ken French Data Library give a sense of scale. From July 1963 to September 2026, the market returned an average of 7.2% a year over Treasury bills. The long-short factor portfolios averaged 2.2% for size, 3.5% for value, 3.0% for profitability, 2.9% for investment and 7.3% for momentum. These are paper portfolios before trading costs and fees, built with short positions most fund buyers never hold, so a long-only ETF should not be expected to earn them.
Single-factor vs multi-factor strategies
A single-factor fund gives you a clean, strong exposure and a clean, strong disappointment when that factor slumps. A multi-factor fund combines several, often value, momentum, quality and low volatility, so one factor's bad year is partly offset by another.
How the factors are combined matters. A "mix" approach builds separate factor sleeves and blends them. An "integrated" approach scores each stock on every factor at once and buys the best overall scores. The two methods can produce quite different portfolios from the same factor list.
Benefits of Smart Beta Strategies
The case for smart beta is real but narrower than the marketing. The benefits worth paying for are:
- Rules you can read. The methodology is published, so you can see exactly what you own and why. That is more transparency than most active funds offer.
- Targeted exposure. If you want more value, quality or low volatility than the market gives you, a factor index delivers it without picking stocks.
- Less concentration in the largest names. Equal and fundamental weighting reduce dependence on a few mega caps that dominate a cap-weighted index.
- Risk shaping. A minimum-volatility fund can lower market sensitivity. As of September 30, 2026, iShares reported a 3-year equity beta of 0.50 for its USA minimum-volatility ETF.
- Cost below most active funds. Factor ETFs usually charge more than a plain index fund but less than many actively managed funds.
What the extra smart beta fee costs
The cost gap is easy to measure. As of November 4, 2026, iShares listed a 0.03% expense ratio for its core S&P 500 ETF and 0.15% for its USA quality, momentum, value and minimum-volatility factor ETFs.
On an illustrative $25,000 position, 0.15% costs $37.50 a year and 0.03% costs $7.50 a year, a difference of $30 a year before trading costs. That is small in dollars. The real question is whether the tilt is worth any premium at all, because you pay it every year, including the years the factor lags.
Smart Beta Risks and Long Factor Droughts
The biggest smart beta risk is not that a factor fails once. It is that a factor can trail the market for longer than most investors will wait. The pain is relative, too: you watch a plain index fund climb while your tilt goes nowhere, and every month the urge to switch gets louder.
Value and momentum drawdowns in the factor data
These figures come from monthly long-short factor returns in the Ken French Data Library (files built from the September 2026 CRSP database), compounded month by month, before costs.
- Value's long drought. From January 2007 to December 2020, the value factor (HML) lost 55.8% while the market's return over Treasury bills compounded to about 240%. Its peak-to-trough drawdown ran from December 2006 to September 2020: 57.8%, nearly 14 years.
- Then the rebound. From January 2021 to September 2026, the same value factor gained 51.4%. Anyone who gave up in 2020 sold at the low point of that cycle, which is exactly when quitting felt most reasonable.
- Bad years are normal. Value had a negative return in 27 of 62 full calendar years from 1964 to 2025. Its worst 10-year window, June 2010 to May 2020, lost 47.4%.
- Momentum's crash. In March to May 2009, as beaten-down stocks rebounded off the financial-crisis lows, the momentum factor lost 49.4%, including 34.4% in April 2009 alone. The market's excess return over those same three months was 26.4%.
Multi-factor mixing and drawdowns
Value and momentum have tended to offset each other. Their monthly returns had a correlation of -0.19 from July 1963 to September 2026. A 50/50 blend of the two, rebalanced monthly, had a maximum drawdown of 40.7% over that period, against 57.8% for each factor alone.
That is real diversification, and also a warning. The blend still lost 30.6% from January 2007 to December 2020 and 23.0% from March to May 2009. Combining factors softens the worst stretches. It does not make them short.
Crowding, data mining and other smart beta risks
- Crowding. When many funds chase the same signal, exits can get disorderly in a reversal.
- Data mining. A factor can look convincing because it was the survivor of many failed backtests. Out-of-sample evidence matters more than a smooth simulated chart.
- Backfilled history. Index launch documents often show years of performance calculated before the index existed. That history applies today's rules with hindsight.
- Turnover. Frequent rebalancing, especially in momentum, raises trading costs that the index return does not show.
- Concentration. A factor score can push the portfolio into a few sectors, so you may own a sector bet without meaning to.
- Behavior. The most common failure is the investor, not the factor: buying after a strong run and selling after a long lag.
Smart Beta ETF Examples Compared
People often ask for the top smart beta ETFs. "Top" depends on what you want the tilt to do, so a more useful view is how a few widely held factor funds differ from a plain S&P 500 fund. This is a snapshot from the iShares fund pages as of November 4, 2026 (holdings and price-to-book as of November 3, 2026; 3-year beta and standard deviation as of September 30, 2026). It is an illustration of how factor funds differ, not a recommendation.
| Fund | Index tracked | Expense ratio | Holdings | 3-year beta | 3-year standard deviation | Price-to-book |
|---|---|---|---|---|---|---|
| IVV (iShares Core S&P 500 ETF) | S&P 500 Index | 0.03% | 505 | 1.00 | 12.42% | 5.56 |
| QUAL (iShares MSCI USA Quality Factor ETF) | MSCI USA Sector Neutral Quality Index | 0.15% | 118 | 0.90 | 11.69% | 8.15 |
| USMV (iShares MSCI USA Min Vol Factor ETF) | MSCI USA Minimum Volatility Index | 0.15% | 174 | 0.50 | 9.55% | 4.49 |
| MTUM (iShares MSCI USA Momentum Factor ETF) | MSCI USA Momentum SR Variant Index | 0.15% | 125 | 1.27 | 20.38% | 5.75 |
| VLUE (iShares MSCI USA Value Factor ETF) | MSCI USA Enhanced Value Index | 0.15% | 146 | 1.23 | 19.56% | 2.33 |
Reading beta, volatility and valuation in factor ETFs
A few things stand out. The value fund is cheap on price-to-book (2.33 against 5.56 for the S&P 500 fund), which is what it is built to be, but it carried a beta of 1.23, so "value" did not mean "defensive" over that window. The minimum-volatility fund did what its name says, with a beta of 0.50. The quality fund owns the most expensive stocks of the group on price-to-book, a reminder that quality and value can pull in opposite directions. Each factor fund holds far fewer stocks than the S&P 500 fund, so concentration rises with the tilt.
These numbers move. Betas and volatilities come from a trailing three-year window and will change as markets change.
Related lesson: Exchange-traded funds
How to Evaluate Smart Beta Performance
Judging a smart beta fund means asking two separate questions: did it deliver the exposure it promised, and was that exposure worth having? A single total-return number answers neither.
Benchmark, active return and tracking error
Start with the right benchmark, usually the parent cap-weighted index the factor rules were applied to. Then measure:
- Active return. The fund's return minus the benchmark's. In an illustrative year where the fund returns 12% and the benchmark 10%, active return is 2 percentage points.
- Tracking error. The volatility of that return gap. A tracking error of 4% means the fund's yearly gap from its benchmark commonly swings by several points either way.
- Information ratio. Active return divided by tracking error. In the example, 2 divided by 4 gives 0.5. It shows how much outperformance you got per unit of deviation you sat through.
Factor regression and rolling windows
A factor regression runs the fund's returns against market, size, value, profitability, investment and momentum factor returns, such as those in the Ken French Data Library. The output shows how much of each factor the fund actually carries and whether anything is left over after those exposures. A "quality" fund that loads mostly on the market and low volatility is not giving you much quality.
Look at rolling 12-month and 36-month relative returns instead of one full-period figure. Note the longest stretch the fund spent behind its benchmark and the worst rolling gap. If you would have sold during that stretch, the strategy probably does not fit you, however good the long-run chart looks.
Live track record vs backtest
Separate the period before the index launched from the period after. Pre-launch numbers are simulations built with knowledge of what worked. Live numbers, after fees and trading costs, are the evidence. A strategy with a short live record and a long, smooth backtest deserves more caution, not less.
Related lesson: Backtesting a trading strategy
Choosing a Smart Beta Fund for a Portfolio
Choosing a smart beta fund starts with the problem it should solve, not with last year's best performer. Chasing the top line on a performance table is how most investors end up buying a factor right after its best run. A workable process:
- Name the job. Higher long-run return, lower volatility, income, or diversifying an existing tilt. One fund rarely does all four.
- Read the methodology. Write down the factor definition, starting universe, weighting rule, constraints and rebalance schedule. If you cannot explain them in a few sentences, you cannot judge the fund.
- Check what you already own. A growth-heavy portfolio plus a momentum fund may double a bet you already have. Compare holdings and sector weights for overlap.
- Add up every cost. Expense ratio, bid-ask spread, and the turnover cost hidden inside the index return.
- Decide role and size first. A factor fund can be a satellite next to a broad core holding, replace part of the core, or become the whole equity allocation. Each step up adds tracking error and behavior risk. Size it so a multi-year lag would be annoying, not unbearable.
- Set an invalidation rule. Decide in advance what would show the thesis is wrong, such as the fund no longer delivering its factor exposure, or the methodology changing. "It lagged for two years" is not, on its own, a reason. Long lags are part of the design.
- Rebalance on a schedule. Keep the tilt at its target weight rather than adding after strong runs and cutting after weak ones.
Market-Neutral Factor Investing vs Smart Beta
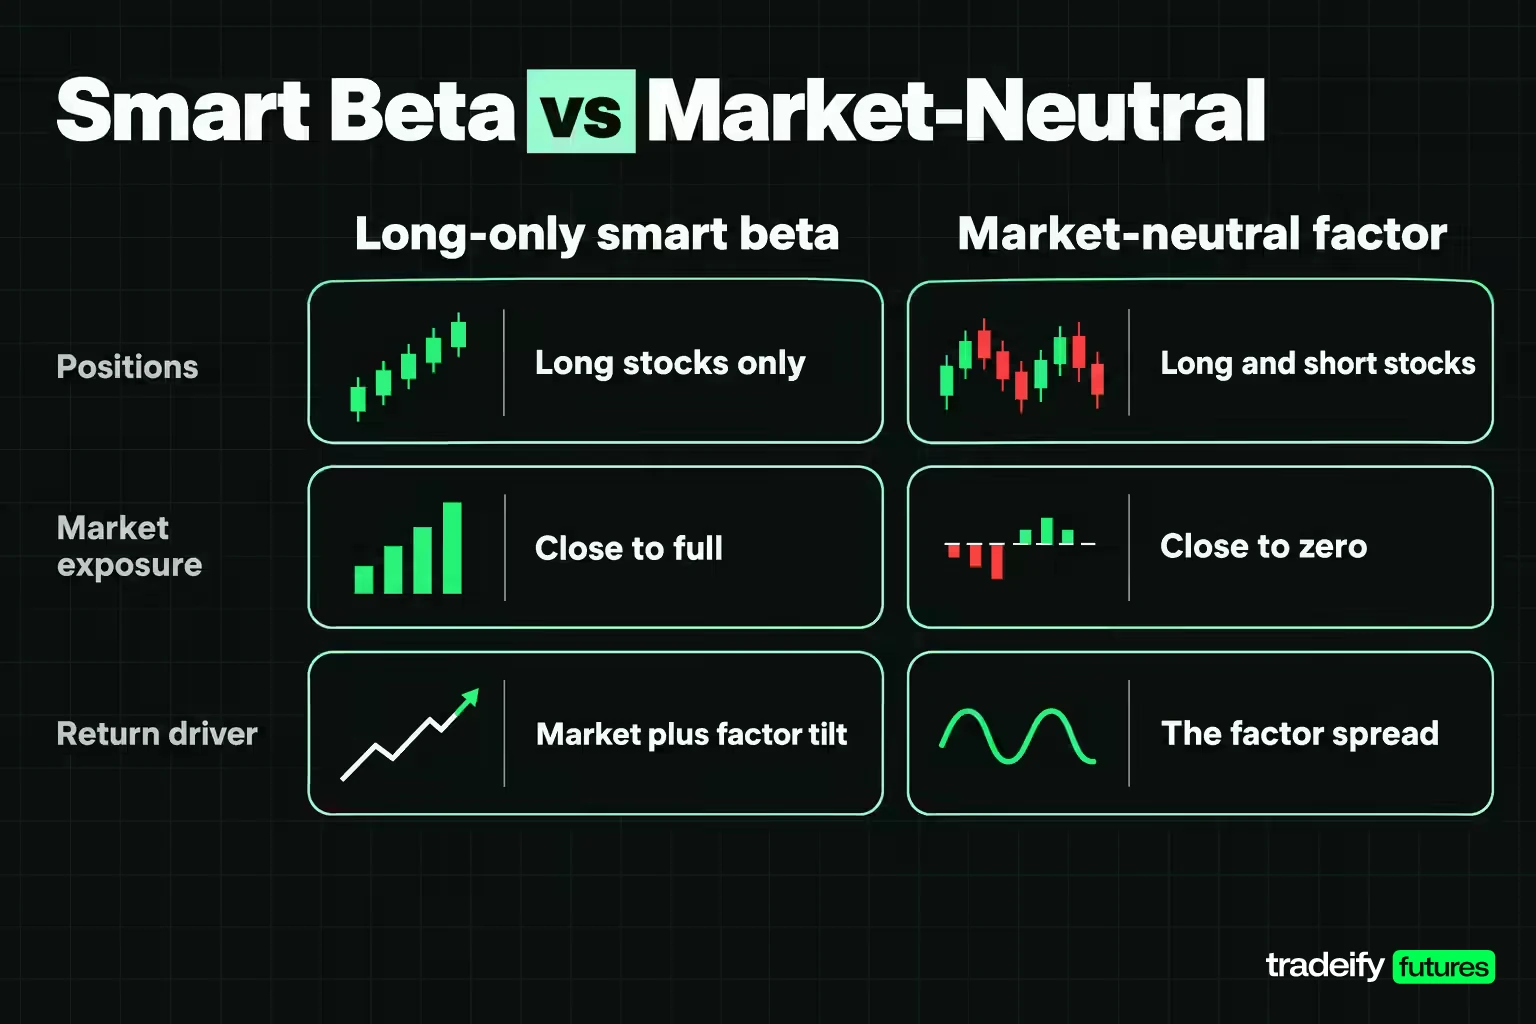
Market-neutral factor investing and smart beta use the same factor research but hand you very different exposures. The factor returns quoted in academic work, including the Ken French Data Library series, come from long-short portfolios: long the stocks with the trait, short the stocks without it. That strips out most of the market's movement and leaves the factor itself.
A smart beta ETF is long only. It owns more of the favored stocks and less of the rest, but it still carries nearly full market exposure. Most of its return comes from the market, with the factor tilt as a smaller layer on top.
| Feature | Long-only smart beta fund | Market-neutral factor strategy |
|---|---|---|
| Positions | Long stocks only | Long favored stocks, short unfavored stocks |
| Market exposure | Close to full | Close to zero by design |
| Main return driver | The market plus a factor tilt | The factor spread itself |
| Typical access | Low-cost ETFs | Hedge funds and liquid alternative funds |
| Costs | Expense ratio and turnover | Higher fees, borrowing and shorting costs |
| When it disappoints | Market falls, or the tilt lags the market | The factor spread itself goes negative |
The practical takeaway is that a long-only fund cannot capture the full long-short premium, and a market-neutral fund does not help much when you want stock market growth. They solve different problems.
ESG Smart Beta and Custom Factor Strategies
ESG-integrated smart beta combines a factor tilt with environmental, social and governance screens or scores, for example a quality or low-volatility index that also excludes certain industries or reweights toward higher ESG ratings. The screen changes the holdings, so it also changes the factor exposure, and two ESG factor funds can differ as much as two value funds.
Customization is spreading too. Separately managed accounts and direct-indexing services can build a personal version of a factor index, with your own exclusions or tax-driven trades. Some managers now use machine-learning models to pick signals or weight factors. The same caution applies to all of it: more flexibility means more ways to fit the past, and a model tuned on historical data still needs a live record before it earns trust.
Factor Rotation in Index Futures Like ES and RTY
Factor thinking is useful even if you never buy a factor ETF, because the major equity index futures are themselves built on index rules. E-mini S&P 500 futures (ES) track the S&P 500, which is weighted by float-adjusted market capitalization, so they carry the large-cap, mega-cap-heavy exposure of that index. Russell 2000 futures (RTY) track small companies, so the gap between RTY and ES moves partly with the size factor.
That gives a trader a lens on the session. When small caps lead large caps, or leadership shifts from recent winners to recent laggards, the move often reads as a factor rotation rather than random noise. The spring 2009 momentum crash, when last year's losers rallied hardest off the lows, is the extreme version. Knowing which kind of day it is can explain why ES and RTY, or NQ and YM, are moving differently, and why a setup that worked all month suddenly stops working.
On our accounts, traders use futures such as ES, NQ, YM and RTY and their micros; we don't offer cash stocks, so factor ETFs aren't something you can trade with us. Positions close by 4:45 PM ET each day, and our hedging rule treats opposite positions in two Equity Index products as a hedge, so a long RTY and short ES "size spread" isn't allowed on our accounts. Funded accounts are simulated.
Smart Beta and Factor Investing FAQ
What is smart beta in investing?
Smart beta is an index strategy that weights or selects stocks by rules other than market capitalization, such as value, quality, momentum or low volatility. It is usually delivered through an ETF. The rules are systematic, but choosing them is an active decision.
What are the 5 factors in factor investing?
The best-known five are from the Fama-French five-factor model: market, size, value, profitability and investment. Many fund providers use a different practical list, often value, size, momentum, quality, low volatility and yield.
What is the 70/30 Buffett rule?
There is no documented 70/30 Buffett rule. "70/30" usually means a portfolio of 70% stocks and 30% bonds. In his 2013 shareholder letter, Buffett described a 90% / 10% split for his wife's trust: 90% in a very low-cost S&P 500 index fund and 10% in short-term government bonds.
What are the top smart beta ETFs?
Widely held smart beta ETFs include factor funds such as QUAL (quality), USMV (minimum volatility), MTUM (momentum) and VLUE (value), plus equal-weight S&P 500 funds. No single list is "top," because each fund does a different job. Compare the index methodology, expense ratio and live record against a plain S&P 500 fund before choosing.
Is smart beta the same as factor investing?
They overlap heavily. Factor investing is the idea of targeting specific return drivers, and smart beta is the most common way to buy that idea in an index fund. Factor investing also includes long-short and actively managed strategies that are not smart beta.
Does factor investing beat the market?
Not reliably over any given period. Some factors have earned premiums over many decades of data, but each has lagged the market for years at a time, and long-only funds capture only part of the paper premium after costs. Past results do not guarantee future returns.
Smart beta funds, factor strategies and index futures can all lose money, and long-only factor funds can trail the market for many years. Futures add leverage, so losses can exceed what you expect. Historical and backtested factor returns are not predictions. Funded trading accounts are simulated. This article is education, not investment advice.


