




TL;DR: Beta and market risk go together because beta measures how much of a position moves with the broad index. Read beta beside R squared, since a low beta can hide a volatile market. Over 5,221 daily returns, gold's beta was 0.03 while its volatility nearly matched the S&P 500's. Convert beta into dollars of index exposure before you size a hedge, then state the risk the hedge leaves behind.
Every position you hold carries two kinds of risk. One comes from the market you chose: a crop report, a pipeline outage, a central bank in Frankfurt. The other comes from the whole market moving at once, and it hits every position you hold on the same afternoon. That second kind is the one traders underestimate, because three positions in three different markets look like three separate bets until a broad sell-off proves they were partly the same bet.
Beta is the number that measures the second kind. This guide defines it, shows how to calculate it, and then measures it on eight futures markets over January 2006 to November 2026, so you can see what the coefficient looks like on contracts traders actually hold, how much it moves around, and how to turn it into a dollar figure a hedge can use.
What Beta Means
Beta is the slope of a regression of a position's returns on the returns of a named market index. A beta of 1.00 means the position has moved one for one with the index on average. A beta of 0.50 means it has moved half as much, in the same direction, on average.
Three things follow from that definition, and each one changes how you use the number.
- The index has to be named. A beta against the S&P 500 and a beta against the Nasdaq-100 are different numbers for the same contract. Crude oil's beta in this study is 0.52 against the E-mini S&P 500 and 0.33 against the E-mini Nasdaq-100.
- Beta is a measurement, not a property. It describes the window you measured. Change the window and the number changes.
- Beta measures co-movement, not size. A market can swing hard and still carry a beta near zero if its swings do not line up with the index. Gold has a beta of 0.03 here, with annualized volatility of 18.7%, which is close to the index's own 19.4%.
That last point is where traders get caught. A small beta does not mean a calm market. It means the market's moves are mostly unrelated to the index's moves, and you still own all of them.
Related lesson: Correlation risk
How Beta Measures Market Risk
Beta measures market risk, also called systematic or non-diversifiable risk: the part of a position's movement that arrives because the broad market moved. The rest is specific risk, the part that belongs to the contract itself, and holding many unrelated positions can average it down. Market risk does not average down that way, because every position shares the same index.
Related lesson: Diversification
The number that tells you how much of a position's risk beta actually covers is R squared, the share of the position's return variance the index explains.
- The E-mini Nasdaq-100 (NQ) has a beta of 1.05 against the E-mini S&P 500 (ES) and an R squared of 85.2%. Most of what NQ does is index risk.
- Gold has a beta of 0.03 and an R squared of 0.1%. Almost none of what gold does is index risk, so beta says almost nothing about how risky a gold position is.
- Crude oil sits in between, with a beta of 0.52 and an R squared of 5.5%. It has real index exposure, but more than nine tenths of its variance comes from somewhere else.
So "beta equals risk" is half right. Beta equals exposure to one kind of risk. A position with a beta of 0.03 can still lose a lot of money on a day the index barely moves. On January 30, 2026, the gold series fell 10.78% while ES fell only 0.39%, and a beta-based risk model would have flagged almost nothing in advance.
How to Calculate Beta
The beta formula is the covariance of the position's returns with the index's returns, divided by the variance of the index's returns.
Beta = Cov(position, index) / Var(index)
A five-session beta calculation by hand
Take five made-up sessions with round numbers, labelled illustrative. The index returns +1%, -2%, +1.5%, -0.5% and +2%. The position returns +1.5%, -2.5%, +2.5%, -1% and +2%.
- Find each average. The index averages 0.4% and the position 0.5%.
- Subtract the average from each return. Index deviations are 0.6, -2.4, 1.1, -0.9 and 1.6. Position deviations are 1.0, -3.0, 2.0, -1.5 and 1.5.
- Multiply the paired deviations and add them. The products are 0.6, 7.2, 2.2, 1.35 and 2.4, which sum to 13.75.
- Square the index deviations and add them. The squares are 0.36, 5.76, 1.21, 0.81 and 2.56, which sum to 10.70.
- Divide. 13.75 / 10.70 = 1.29.
The beta is 1.29. Dividing both sums by 4 (one less than the number of sessions) gives the sample covariance of 3.44 and variance of 2.68, and the ratio is the same, because the divisor cancels. The correlation on these five sessions is 0.98.
Calculating beta in a spreadsheet
Put the position's returns in one column and the index's returns in the next. =SLOPE(position returns, index returns) returns beta directly. =COVARIANCE.S divided by =VAR.S gives the same answer, and =RSQ gives R squared, which belongs beside every beta you report.
The correlation and volatility check on beta
Beta also equals correlation multiplied by the ratio of the two volatilities. That identity is a useful self-check. For crude oil in this study, a correlation of 0.2344 times a volatility ratio of 2.2069 gives 0.5173, which matches the regression beta. If a beta you were given cannot be rebuilt this way, it was probably measured against a different index or a different window than you assumed.
How to Read a Beta Value

A beta value is a multiplier on the index's move, on average, over the window measured. Against a 1% index move:
| Beta reading | Average move against a 1% index move | Futures example in this study |
|---|---|---|
| 1.00 | 1% in the same direction | ES against itself |
| Above 1 | More than 1% in the same direction | NQ at 1.05 |
| Between 0 and 1 | Less than 1% in the same direction | Crude oil at 0.52 |
| Near 0 | Little relationship with the index | Gold at 0.03 |
| Below 0 | A move against the index | 10-Year T-Note at -0.08 |
Two checks keep that reading honest.
First, read the R squared. In this guide's study of Yahoo Finance continuous futures data from 2006 to 2026, a beta of 0.52 with an R squared of 5.5% (crude oil) is a weak tendency, while a beta of 1.05 with an R squared of 85.2% (NQ) is close to a rule. Second, read the window. These beta readings are 20-year averages, and on three-month windows the same markets can read very differently: crude oil's 60-session beta has ranged from -3.77 to 2.43.
A beta reading also says nothing about whether a position is good. A trader who wants index exposure wants a beta near the exposure they intended. A trader building a hedge wants a beta near zero or below. The number is a description, and the decision depends on the job the position is meant to do.
High Beta, Low Beta, Negative Beta and Market-Neutral Positions
Beta readings are usually grouped into four types, and each one has a clean futures example in this study.
- High beta (above 1). The position amplifies index moves. NQ has a beta of 1.05 against ES on the full sample, with a median of 1.13 on 60-session windows, so a Nasdaq contract behaves like a larger version of the S&P contract.
- Low beta (between 0 and 1). The position follows the index partly. Copper (0.42) and crude oil (0.52) fit here, though both carry far more of their own risk than index risk.
- Zero or near-zero beta. The position has little linear relationship with the index. Gold, at 0.03, is the example, and its volatility shows that zero beta is not the same as low risk.
- Negative beta (below 0). The position tends to move against the index. In this guide's 2006 to 2026 study of Yahoo Finance futures data, the 10-Year T-Note reads -0.08 on the full sample, and its 60-session beta was negative in 76.6% of windows, which is what a flight-to-quality asset looks like when you measure it against stocks.
Related lesson: Hedging risk
Market-neutral and beta-matched books
A market-neutral book, also called beta-neutral, holds positions whose dollar-weighted betas sum to roughly zero, so a broad index move should leave it roughly flat. What remains is the spread between the positions, which is the bet the trader actually wanted.
The common mistake is matching contract counts instead of beta-weighted dollars. One long NQ against one short ES looks neutral and is not. At the November 3, 2026 closes, that pair still carries $216,100 of net long index exposure, which is 0.57 of an ES contract, because NQ's notional is larger and its beta is above 1.
Beta in the Capital Asset Pricing Model
Beta became the standard measure of market risk through the Capital Asset Pricing Model (CAPM), which says investors should be paid only for the risk they cannot diversify away. The formula is:
Expected return = risk-free rate + beta × (expected market return − risk-free rate)
The term in brackets is the market risk premium. Beta scales it.
A CAPM calculation at three beta values
Use round inputs, labelled illustrative and not forecasts: a risk-free rate of 4% and an expected market return of 9%, so the premium is 5%.
| Beta | CAPM expected return | Reading |
|---|---|---|
| 1.05 | 9.25% | Slightly above the market, for slightly more market risk |
| 0.52 | 6.6% | Half the premium, for half the market risk |
| 0 | 4% | Only the risk-free rate, because there is no market risk to pay for |
| -0.08 | 3.6% | Below the risk-free rate, because the position offsets market risk |
The last row is the interesting one. In CAPM, an asset that tends to rise when the market falls is worth holding even with a lower expected return, because it pays off when everything else hurts.
Where beta and CAPM came from
CAPM was developed independently in the early 1960s by Jack Treynor (1961 and 1962), William F. Sharpe (1964), John Lintner (1965) and Jan Mossin (1966), building on Harry Markowitz's earlier work on portfolio choice. Sharpe's 1964 paper in The Journal of Finance, "Capital Asset Prices: A Theory of Market Equilibrium under Conditions of Risk", is the version most people cite. Markowitz, Merton Miller and Sharpe shared the 1990 Nobel Memorial Prize in Economic Sciences for their pioneering work in the theory of financial economics.
What the CAPM assumes about beta
CAPM assumes investors care only about expected return and variance, can borrow and lend at the risk-free rate, and hold diversified portfolios, so only beta risk earns a premium. Real markets break those assumptions, and the model has a mixed record in empirical tests. For a trader, its lasting value is the vocabulary: market risk is the part you cannot diversify away, and beta is how you measure it.
Beta vs Alpha
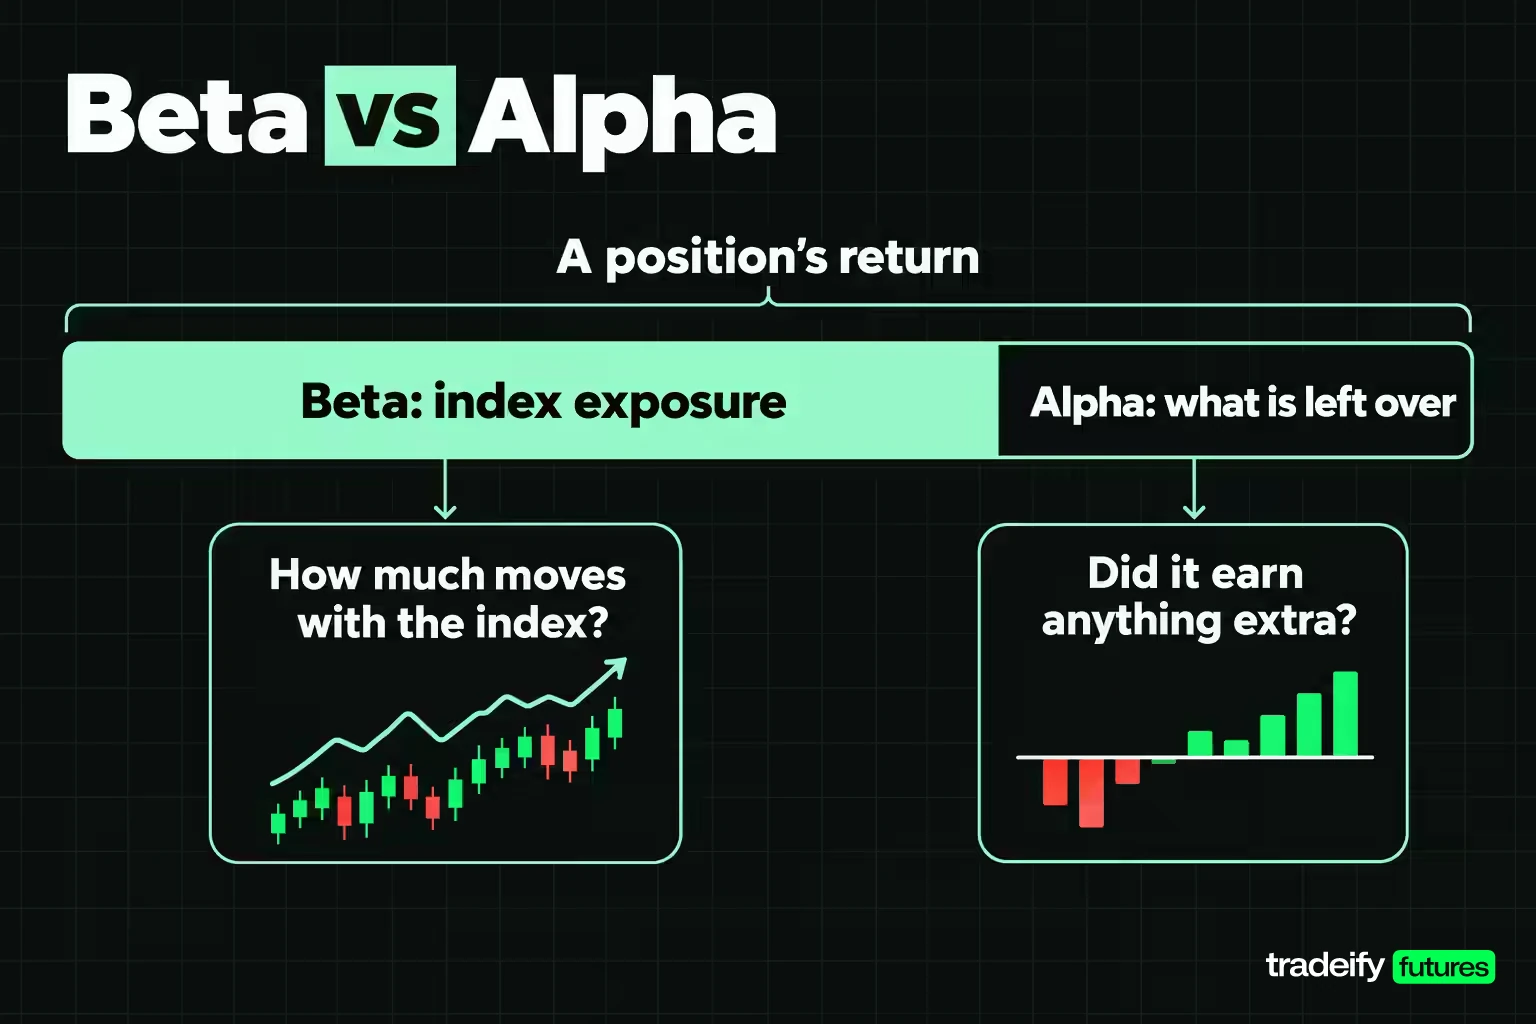
Beta is the return a position earns by moving with the index. Alpha is whatever is left over. In the CAPM regression, alpha is the intercept: the average return the position earned beyond what its beta and the index's return would predict. Michael Jensen formalized that measure in 1968 in a study of mutual fund performance, which is why it is often called Jensen's alpha.
- Beta answers: how much of this position is index exposure?
- Alpha answers: after removing that exposure, did the position earn anything extra?
Gold shows why a raw intercept needs care. Over the sample, gold's continuous futures series averaged an annualized 11.2%, and with a beta of 0.03 the regression intercept is 10.8% a year. That is not skill. It is a market's own trend, measured without subtracting a risk-free rate and on a series that is not adjusted for contract rolls. Real alpha is measured against the right benchmark, net of the risk-free rate and costs, and over enough data to separate it from luck.
Beta Measured on Eight Futures Markets
Most explanations of beta stop at a definition and a stock example. This one measures it. The study uses Yahoo Finance continuous front-month daily closes for eight futures markets, keeps only sessions where all eight have a close, and computes simple close-to-close returns: 5,221 daily returns from January 4, 2006 to November 3, 2026. Two returns are dropped because crude oil settled negative on April 20, 2020, and two because of gaps in the data. Every beta is measured against the E-mini S&P 500 by ordinary least squares, and volatility is annualized with the square root of 252.
| Market | Beta vs ES | Correlation | R squared | Annualized volatility | Volatility vs ES |
|---|---|---|---|---|---|
| E-mini S&P 500 (ES) | 1.00 | 1.00 | 100.0% | 19.4% | 1.00 |
| E-mini Nasdaq-100 (NQ) | 1.05 | 0.92 | 85.2% | 22.1% | 1.14 |
| Gold (GC) | 0.03 | 0.03 | 0.1% | 18.7% | 0.96 |
| Silver (SI) | 0.28 | 0.15 | 2.3% | 35.2% | 1.82 |
| Copper (HG) | 0.42 | 0.29 | 8.5% | 28.1% | 1.45 |
| WTI crude oil (CL) | 0.52 | 0.23 | 5.5% | 42.8% | 2.21 |
| 10-Year T-Note (ZN) | -0.08 | -0.25 | 6.3% | 5.9% | 0.31 |
| Euro FX (6E) | 0.08 | 0.18 | 3.3% | 8.8% | 0.45 |
Reading the eight-market beta table
Read the beta column of the eight-market table together with the last two columns, because beta alone ranks these markets badly.
- NQ is the only market where beta does most of the work. With an R squared of 85.2%, an NQ position is mostly a larger S&P position.
- Crude oil has the highest beta outside the equity index pair, at 0.52, yet the index explains only 5.5% of its variance. It is 2.21 times as volatile as ES, and almost all of that volatility is its own.
- Gold has the lowest positive beta and nearly the same volatility as ES. A beta-only risk model would treat a gold position as nearly riskless, and it is not.
- The 10-Year T-Note has a negative beta and the lowest volatility, so its offset to stock risk is real but small per dollar.
Continuous front-month series are not adjusted for contract rolls, so roll days add small jumps, most of all in monthly crude oil. The figures describe the past and are not a forecast.
Why Beta Changes Over Time
Full-sample betas are 20-year averages, and nobody holds a position for 20 years of averages. Re-estimating beta against ES on every overlapping 60-session window of the same Yahoo Finance continuous futures data (January 2006 to November 2026) (about three months, 5,162 windows) shows how far the reading can wander.
Rolling 60-session beta against ES
| Market | Lowest | 5th percentile | Median | 95th percentile | Highest | Share of windows negative | Latest window |
|---|---|---|---|---|---|---|---|
| E-mini Nasdaq-100 (NQ) | 0.75 | 0.87 | 1.13 | 1.47 | 1.87 | 0.0% | 1.61 |
| Gold (GC) | -0.96 | -0.48 | 0.03 | 0.67 | 1.17 | 46.8% | 0.80 |
| Silver (SI) | -1.19 | -0.45 | 0.26 | 1.37 | 2.39 | 25.3% | 1.61 |
| Copper (HG) | -0.66 | -0.05 | 0.44 | 1.19 | 1.63 | 6.3% | 0.84 |
| WTI crude oil (CL) | -3.77 | -0.68 | 0.52 | 1.40 | 2.43 | 18.0% | -1.67 |
| 10-Year T-Note (ZN) | -0.38 | -0.24 | -0.10 | 0.16 | 0.26 | 76.6% | 0.02 |
| Euro FX (6E) | -0.60 | -0.24 | 0.08 | 0.37 | 0.57 | 27.6% | 0.06 |
The latest window ends at the November 3, 2026 close, and it is a reading that will be stale within weeks.
NQ is the only beta here that behaves like a stable property: never negative, with the middle 90% of windows between 0.87 and 1.47. Every other market's beta changes sign at least sometimes. Gold's 60-session beta was negative in 46.8% of windows, so treating gold as a hedge against stocks is close to a coin toss on a three-month horizon. And the latest readings show how different "now" can be from "on average": gold at 0.80 against a 20-year median of 0.03, crude oil at -1.67 against a median of 0.52.
Longer windows make beta steadier, not certain
On 250-session windows (about a year, 4,972 windows), the medians barely move and the extremes shrink. NQ ranges from 0.84 to 1.46 with a median of 1.10. Crude oil's median stays at 0.52, but its range still runs from -1.69 to 1.66. Gold's share of negative windows falls only to 42.5%, and the 10-Year T-Note is negative in 80.6% of them.
Longer windows are steadier and less current. The practical answer is to choose a window in advance, state it, and re-estimate on a fixed schedule rather than when a position starts to hurt.
Beta on falling and rising sessions
A single beta assumes the relationship is the same in both directions. Splitting the sample into the 2,332 sessions when ES fell and the 2,839 when it rose shows it is not.
| Market | Beta on falling ES sessions | Beta on rising ES sessions | Full-sample beta |
|---|---|---|---|
| E-mini Nasdaq-100 (NQ) | 1.00 | 1.03 | 1.05 |
| Gold (GC) | -0.01 | 0.01 | 0.03 |
| Silver (SI) | 0.28 | 0.11 | 0.28 |
| Copper (HG) | 0.45 | 0.29 | 0.42 |
| WTI crude oil (CL) | 0.69 | 0.43 | 0.52 |
| 10-Year T-Note (ZN) | -0.09 | -0.06 | -0.08 |
| Euro FX (6E) | 0.07 | 0.08 | 0.08 |
Crude oil carries about 58% more index exposure on falling sessions (0.69) than on rising ones (0.43), and silver and copper show the same shape. That is the wrong way round for a long commodity position: it follows the index more on the days the index hurts. A hedge sized from the full-sample beta is short of cover on exactly those days.
Beta also depends on the index you choose
Measured against NQ instead of ES, crude oil's beta drops from 0.52 to 0.33, and ES itself reads 0.81. Neither number is wrong. They answer different questions, which is why the index belongs in the same sentence as the beta.
Related lesson: Volatility-based position sizing
Turning Beta Into Dollars of Market Risk

A beta becomes usable for sizing when you multiply it by the dollar value of the position. For a futures contract, that dollar value is the notional: price times the contract's multiplier. Notional times beta gives the dollars of index exposure, the amount that tends to move with the S&P 500.
The table uses closing prices from November 3, 2026, so the dollar figures are a snapshot as of that date. The multipliers are CME contract units, and the exposures use the unrounded betas.
| Contract | Close on November 3, 2026 | Contract unit | Notional | Beta vs ES | Dollars of index exposure |
|---|---|---|---|---|---|
| ES | 7,596.75 | $50 x index | $379,838 | 1.00 | $379,838 |
| NQ | 28,305.75 | $20 x index | $566,115 | 1.05 | $595,938 |
| Gold (GC) | 3,940.40 | 100 troy ounces | $394,040 | 0.03 | $11,822 |
| Silver (SI) | 49.587 | 5,000 troy ounces | $247,935 | 0.28 | $68,232 |
| Copper (HG) | 6.3785 | 25,000 pounds | $159,462 | 0.42 | $67,242 |
| Crude oil (CL) | 96.09 | 1,000 barrels | $96,090 | 0.52 | $49,710 |
| 10-Year T-Note (ZN) | 106.50 | $1,000 per point | $106,500 | -0.08 | -$8,125 |
| Euro FX (6E) | 1.1196 | 125,000 euros | $139,950 | 0.08 | $11,509 |
Why one NQ against one ES is not hedged
One long NQ carries $595,938 of index exposure. One short ES removes $379,838. The pair is left with $216,100 of net long index exposure, which is 0.57 of an ES contract. On a day the S&P 500 falls 2%, that pair still behaves roughly like being long more than half an ES contract.
A beta-matched version of the same pair needs about 1.57 ES contracts per NQ contract (595,938 / 379,838). Contract counts hide that, and so does any risk report that lists positions without dollar exposure.
How a negative beta changes a hedge
The 10-Year T-Note's exposure is negative: -$8,125 per long contract. A long T-Note position therefore slightly reduces a book's index exposure, and a short one adds to it. Gold, at $11,822 per contract, adds almost nothing either way. Neither does much per contract compared with one ES, which is the size problem a beta table makes visible.
Notional moves every session with price, while the multiplier does not, so dollars of index exposure are a current reading. Recompute them whenever prices have moved materially.
Portfolio Beta and the Index Hedge
Portfolio beta is the notional-weighted average of each position's beta. Weighting by each position's share of the book's notional is what makes the average equal to the beta you would get by regressing the whole book's returns on the index.
A four-position book worked through
Take a book holding one contract each of ES, gold, the 10-Year T-Note and the Euro FX, valued at the November 3, 2026 closes. Its notional is $1,020,327.
| Position | Share of book notional | Beta vs ES | Contribution to portfolio beta |
|---|---|---|---|
| ES | 37.2% | 1.00 | 0.372 |
| Gold (GC) | 38.6% | 0.03 | 0.012 |
| 10-Year T-Note (ZN) | 10.4% | -0.08 | -0.008 |
| Euro FX (6E) | 13.7% | 0.08 | 0.011 |
| Book | 100% | 0.387 | 0.387 |
The contributions add to a portfolio beta of 0.387, which matches the beta from regressing the book's own daily returns on ES. Gold is the largest position by notional and contributes almost nothing to market risk. The ES leg carries nearly all of it.
The hedge follows directly:
- Index exposure = the four positions' dollar exposures from the table above, which use unrounded betas: $395,043, or 0.387 of the $1,020,327 notional.
- Hedge size = $395,043 / $379,838 per ES contract = 1.04 contracts.
- The tradable hedge is one short ES contract.
Residual risk after a beta hedge
The book's daily dollar standard deviation over the sample, holding today's notional constant, is $6,977. The index explains 47.9% of the variance (R squared), which splits that figure into $4,827 of index-driven movement and $5,038 the index does not explain. A perfect index hedge removes the first part and leaves the second, which is 72.2% of the book's daily standard deviation.
Shorting one ES contract takes the book's daily standard deviation from $6,977 to $5,042. The small gap against the model's $5,038 is the cost of rounding 1.04 contracts down to 1.
Two sessions show what that means in money.
- December 1, 2008. The unhedged book lost $52,487, or 5.1% of its notional, a 7.5 standard deviation day. ES fell 8.88% and gold 5.10%, while the T-Note rose 1.58%. With one ES short, the same session would have lost $18,757. The hedge did its job on an index-driven day.
- January 30, 2026. This was the hedged book's worst session in the sample, a $43,483 loss. ES fell only 0.39% that day, while the gold series fell 10.78% (silver fell 31.35% the same session). No index hedge could help, because the loss was not index risk.
That second date is the whole argument for reading R squared beside beta. Hedging market risk removes market risk. It leaves everything else, and on this book everything else is most of the risk.
Four books compared on beta and market risk
The same method applied to four books built from these contracts:
| Book | Notional | Portfolio beta | Dollars of index exposure | Hedge in ES contracts | R squared | Daily dollar standard deviation | After round-lot ES hedge |
|---|---|---|---|---|---|---|---|
| ES only | $379,838 | 1.00 | $379,838 | 1.00 | 100.0% | $4,641 | $0 |
| ES and Euro FX | $519,788 | 0.75 | $391,347 | 1.03 | 97.5% | $4,842 | $775 |
| Four positions | $1,020,327 | 0.387 | $395,043 | 1.04 | 47.9% | $6,977 | $5,042 |
| All eight markets | $2,089,930 | 0.56 | $1,176,165 | 3.10 | 57.5% | $18,950 | $12,362 |
Adding more markets lowered the four-position book's portfolio beta, but the eight-market book shows the opposite trap. It carries $1,176,165 of index exposure, because NQ alone is 27.1% of its notional and contributes 0.285 of its beta. Holding more markets is not the same as holding less market risk. Position count is not a risk measure, and dollars of index exposure are.
Related lesson: Portfolio heat and total exposure
A Beta Checklist for Your Own Positions
Run this beta check on the positions you actually hold, not on a watchlist. It takes a few minutes in a spreadsheet, and it answers the question a contract count cannot: how much of this book is one bet on the index?
- Name the index you measure against, and keep it fixed inside any comparison.
- Choose the window before you look at the result. Sixty sessions is current and noisy; 250 sessions is steadier and slower.
- Record beta, R squared and volatility for each position. A beta without its R squared is half a reading.
- Convert each position to dollars of index exposure: price × multiplier × beta × contracts, with short positions negative.
- Add the exposures. The total is the market risk a hedge has to cover.
- Check the falling-session beta for anything you are relying on as a hedge or diversifier.
- Divide the total by one index contract's notional, round to a tradable lot, and write down the risk the round lot leaves.
- Re-estimate on a schedule, and compare the latest beta with its own historical range instead of an absolute threshold.
Beta hedges under prop account rules
Account rules can change which hedge you are allowed to place. On our accounts, positions are closed by 4:45 PM ET each trading day, so a daily beta describes the risk of a single session rather than an overnight hold. Our hedging rule prohibits opposing positions in the same instrument or in two products from the same Product Group, in one account or across accounts, so long NQ against short ES is a violation, not a hedge. Of the eight markets in this study, ES, NQ, gold, silver, copper, crude oil and the Euro FX are on our supported product list, and the 10-Year T-Note is not. Our funded accounts are simulated.
Related lesson: Position sizing
Frequently Asked Questions About Beta
What does alpha and beta mean?
Beta is the part of a position's return explained by moving with a market index. Alpha is the part left over after removing that index exposure, measured as the intercept of the same regression. Beta describes exposure, and alpha describes whether the position earned anything beyond it.
How do you calculate beta in finance?
Divide the covariance of the position's returns with the index's returns by the variance of the index's returns. In a spreadsheet, =SLOPE(position returns, index returns) gives the same answer. Always state the index, the window and the R squared with the result.
What is alpha in finance?
Alpha is the average return a position or fund earned beyond what its beta and the market's return would predict. Michael Jensen formalized the measure in 1968. A raw intercept is not skill until it is measured net of the risk-free rate and costs, against the right benchmark, over enough data.
What is the 7% rule in stocks?
It is a stock-selling guideline associated with Investor's Business Daily: cut a loss when a stock falls 7% to 8% below the purchase price. It is a stop-loss rule, not a beta measure, and it says nothing about how much of a position's risk is market risk.
Does a higher beta mean more risk?
A higher beta means more market risk, not necessarily more total risk. In this guide's 2006 to 2026 study of Yahoo Finance futures data, crude oil's beta of 0.52 is far below NQ's 1.05, yet crude oil's annualized volatility of 42.8% is nearly twice NQ's 22.1%. Read beta with volatility and R squared.
Can beta be negative?
Yes. In this guide's 2006 to 2026 study of Yahoo Finance futures data, the 10-Year T-Note has a beta of -0.08 against the E-mini S&P 500, and its 60-session beta was negative in 76.6% of windows. A negative-beta position tends to offset index moves, though the offset varies over time.
Is a beta below 1 good?
A beta below 1 is good when you want less index exposure than the index itself carries, and not otherwise. A hedge wants a beta near zero or below, while a position meant to carry index exposure wants the beta you intended. Check the R squared too, because a low beta on a very low R squared means little relationship, not a small one.
What is a good beta for a portfolio?
A good portfolio beta is the one that matches the index exposure you meant to carry, so there is no universal number. A book built to be market-neutral wants a portfolio beta near zero after hedges, and a book built to track the index wants about 1. The four-position example in this study sits at 0.387 unhedged.
Risk note: futures are leveraged, and losses can exceed the amount you planned to risk. Every beta, exposure and hedge figure in this guide comes from historical data that is not adjusted for contract rolls, and a beta measured on past sessions does not predict future ones. An index hedge reduces only index risk and leaves the rest of a book's movement uncovered. Simulated, evaluation and funded accounts are simulated, and results there may differ from live trading. This guide is education, not investment advice.


