



TL;DR: Trading halts and circuit breakers stop trading when prices move too far too fast, and the type that fired sets how long you wait. Market-wide breakers fire on 7%, 13% and 20% S&P 500 drops; single stocks pause about five minutes. During any halt a stop order cannot fill, so the size you carry into one is your real risk.
You have a position on, the quote stops updating, and a short code appears next to the symbol. Whether that freeze lasts two minutes, five minutes or the rest of the day depends on which rule fired, and so does what happens to your stop.
Trading halts and circuit breakers exist for the moments when a market moves faster than anyone can price it. A halt is the result: trading stops. A circuit breaker is one of the automatic rules that causes it. Here are the rules for US stocks and CME equity index futures, how long each kind of halt lasts, what they did in real crashes, and what your orders can and cannot do while the market is frozen.
What Trading Halts and Circuit Breakers Are
A trading halt is a temporary stop in trading, either in one security or across the whole market. A circuit breaker is a preset rule that triggers a halt automatically when price crosses a defined threshold. Every circuit breaker produces a halt, but not every halt comes from a circuit breaker.
There are four mechanisms worth separating, because each has a different trigger, scope and clock:
- Market-wide circuit breakers halt trading in every US listed stock at once when the S&P 500 falls 7%, 13% or 20% from the prior day's close.
- Single-stock pauses under the Limit Up-Limit Down plan stop one symbol for about five minutes when it hits its price band.
- Discretionary halts are called by the listing exchange, for example ahead of material news or when it wants more information from the company.
- SEC trading suspensions are regulatory actions. The SEC can generally suspend trading in a stock for up to ten business days, usually over missing or doubtful information or possible manipulation.
Futures markets add a fifth idea, the price limit, which caps how far a contract can trade in one session instead of always stopping it.
Who sets and enforces trading halt rules
The rules for stocks are exchange and FINRA rules approved by the Securities and Exchange Commission. The market-wide circuit breaker on NYSE markets sits in NYSE Rule 7.12, and when it fires, trading stops on all exchanges and in listed stocks traded over the counter. The single-stock bands come from a national plan that the exchanges and FINRA participate in. Futures limits are written into each exchange's own rules; the CFTC glossary defines a price limit as the maximum advance or decline from the previous day's settlement permitted in one session, as fixed by exchange rules.
That split matters if you trade futures. A stock halt and a futures halt are coordinated, but they come from different rulebooks and do not always run on the same clock.
How Market-Wide Circuit Breakers Work
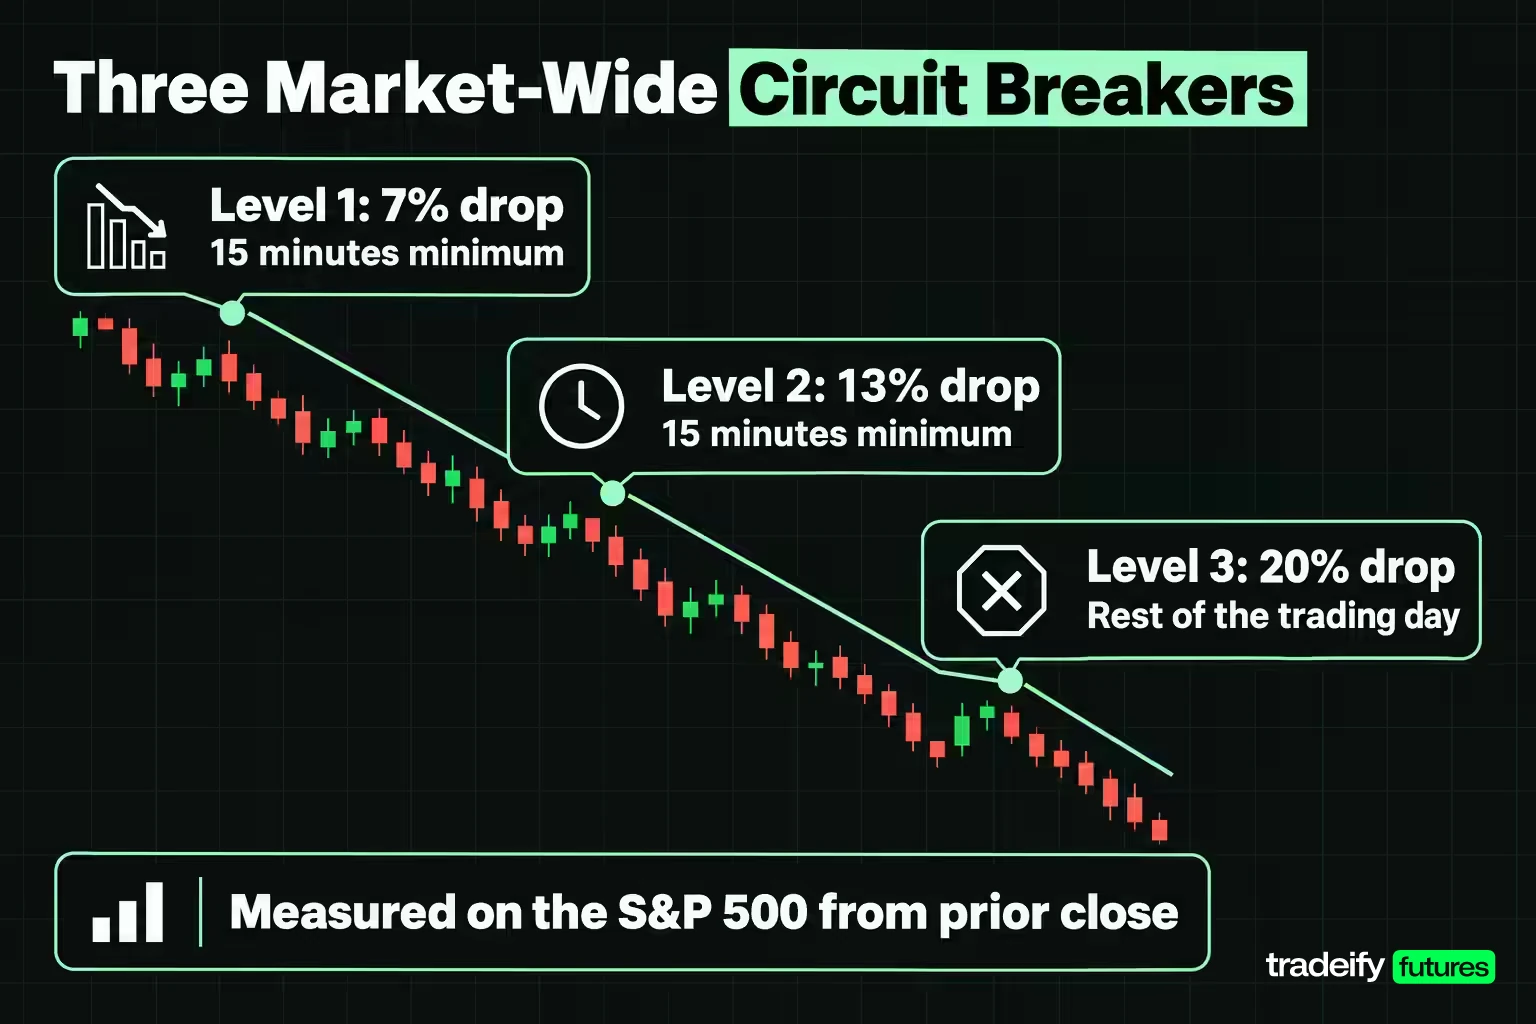
The trigger is a single-day decline in the S&P 500 Index measured against the previous day's closing value. Before the open, the securities information processor publishes the three trigger values, based on the index at 4:00 PM the prior day. The thresholds stay at 7%, 13% and 20% no matter where the index trades, so the point distances change every day.
Three details decide whether a big down day actually halts the market:
- The 3:25 PM cutoff. A Level 1 or Level 2 decline halts trading only if it happens between 9:30 AM and 3:25 PM ET. The same decline at or after 3:25 PM does not halt anything. A Level 3 decline halts the market at any time.
- Once per level per day. If the index falls 7%, reopens and falls further, nothing new happens until the 13% level is reached. Traders who expect a second 7% halt get caught by this.
- Cross-market scope. The halt covers listed stocks on every venue, listed options markets halt with them, and US equity index futures halt in coordination.
What happens to stock orders during a market-wide halt
The NYSE's published FAQ is unusually specific here. For its primary-listed stocks, orders that can take part in the reopening auction (market orders, displayable limit orders, market-on-open and limit-on-open orders) are accepted during the halt. Resting non-displayed orders are cancelled, new non-auction orders and immediate-or-cancel orders are rejected, and requests to cancel or modify resting orders are accepted. Market orders already resting on the book stay there.
So a halted stock market is not a closed order book. Some instructions still queue for the reopen; others simply vanish. Your broker's rules can be stricter than the exchange's, and the time to learn them is before a volatile day, not in the middle of one.
Circuit Breaker Levels in Index Points and Dollars
The three circuit breaker levels and what each one does:
| Level | S&P 500 decline from prior close | When it can trigger | Stock market halt |
|---|---|---|---|
| Level 1 | 7% | 9:30 AM to 3:25 PM ET, once per day | 15 minutes minimum |
| Level 2 | 13% | 9:30 AM to 3:25 PM ET, once per day | 15 minutes minimum |
| Level 3 | 20% | Any time in the trading day | Rest of the trading day |
Percentages are easy to repeat and hard to feel, so here are the same levels priced out. The index level of 7,000 is a round illustrative number, not a quote. The Micro E-mini S&P 500 (MES) is worth $5 per index point and the E-mini S&P 500 (ES) $50 per index point, per CME contract specifications.
| Circuit breaker level | Index points from 7,000 | Index level | Move on 1 MES | Move on 1 ES | 1 MES as share of a $50,000 account |
|---|---|---|---|---|---|
| Level 1 (7%) | 490 | 6,510 | $2,450 | $24,500 | 4.9% |
| Level 2 (13%) | 910 | 6,090 | $4,550 | $45,500 | 9.1% |
| Level 3 (20%) | 1,400 | 5,600 | $7,000 | $70,000 | 14% |
For scale, a 1% move from 7,000 is 70 points, or $350 on one MES. A Level 1 day is seven of those in one direction before the market pauses.
None of this is a forecast. It is a sizing check. One ES contract held into a Level 1 decline moves $24,500, roughly half of a $50,000 account. Keep that number in your head on the mornings when the headlines are ugly and you are deciding how much to carry into the open.
Related lesson: How a tick becomes a dollar figure
How Long a Trading Halt Lasts
How long a trading halt lasts depends entirely on which mechanism fired. The "15 minutes" you hear quoted applies to one case only.
| Halt type | Typical length | What ends it |
|---|---|---|
| Limit Up-Limit Down pause | 5 minutes, extendable by another 5 | Reopening auction on the listing exchange |
| Market-wide Level 1 or Level 2 | 15 minutes minimum | Reopening auctions, which can run later than 15 minutes |
| Market-wide Level 3 | Rest of the trading day | Normal open on the next trading day |
| ES and MES futures in a Level 1 or 2 cash halt | 10 minutes from the start of the halt | Futures reopen with the limit expanded to the next level |
| CME dynamic circuit breaker | 2 minutes (5 seconds near the close or settlement) | Automatic reopen from pre-open |
| News pending (T1, T2) | Minutes to hours | Exchange publishes resumption times (T3) |
| Additional information requested (T12) | No set length | Exchange decides when the company has answered |
| SEC trading suspension (H10) | Up to ten business days | Suspension expires; exchange stocks resume, OTC quoting may not |
Two edge cases change the clock. A stock still in a LULD pause during the last 10 minutes of regular trading does not reopen at all; the listing exchange goes straight to its closing process. And on NYSE markets, a stock that has not reopened after a market-wide halt by 3:50 PM gets no reopening auction and stays halted until the closing auction.
Halt codes that tell you which clock applies
When a symbol freezes, most platforms show a reason code published by the listing market. Reading it is the fastest way to know whether you are waiting five minutes or five days. The Nasdaq Trader code list includes:
- LUDP is a Limit Up-Limit Down volatility pause. LUDS is the same pause triggered by a straddle condition, where the quote sits outside the band on both sides.
- T1 means a halt pending material news, T2 means the news is being released, and T3 posts the times when quoting and then trading resume.
- T12 means the exchange has asked the company for more information. There is no published duration, and it is common on thin, low-float names after a sharp move.
- H10 is an SEC trading suspension, a regulatory action rather than a pause.
- MWC1, MWC2 and MWC3 mark market-wide circuit breaker halts at Levels 1, 2 and 3, and MWCQ marks the resumption.
Single-Stock Halts Under Limit Up-Limit Down
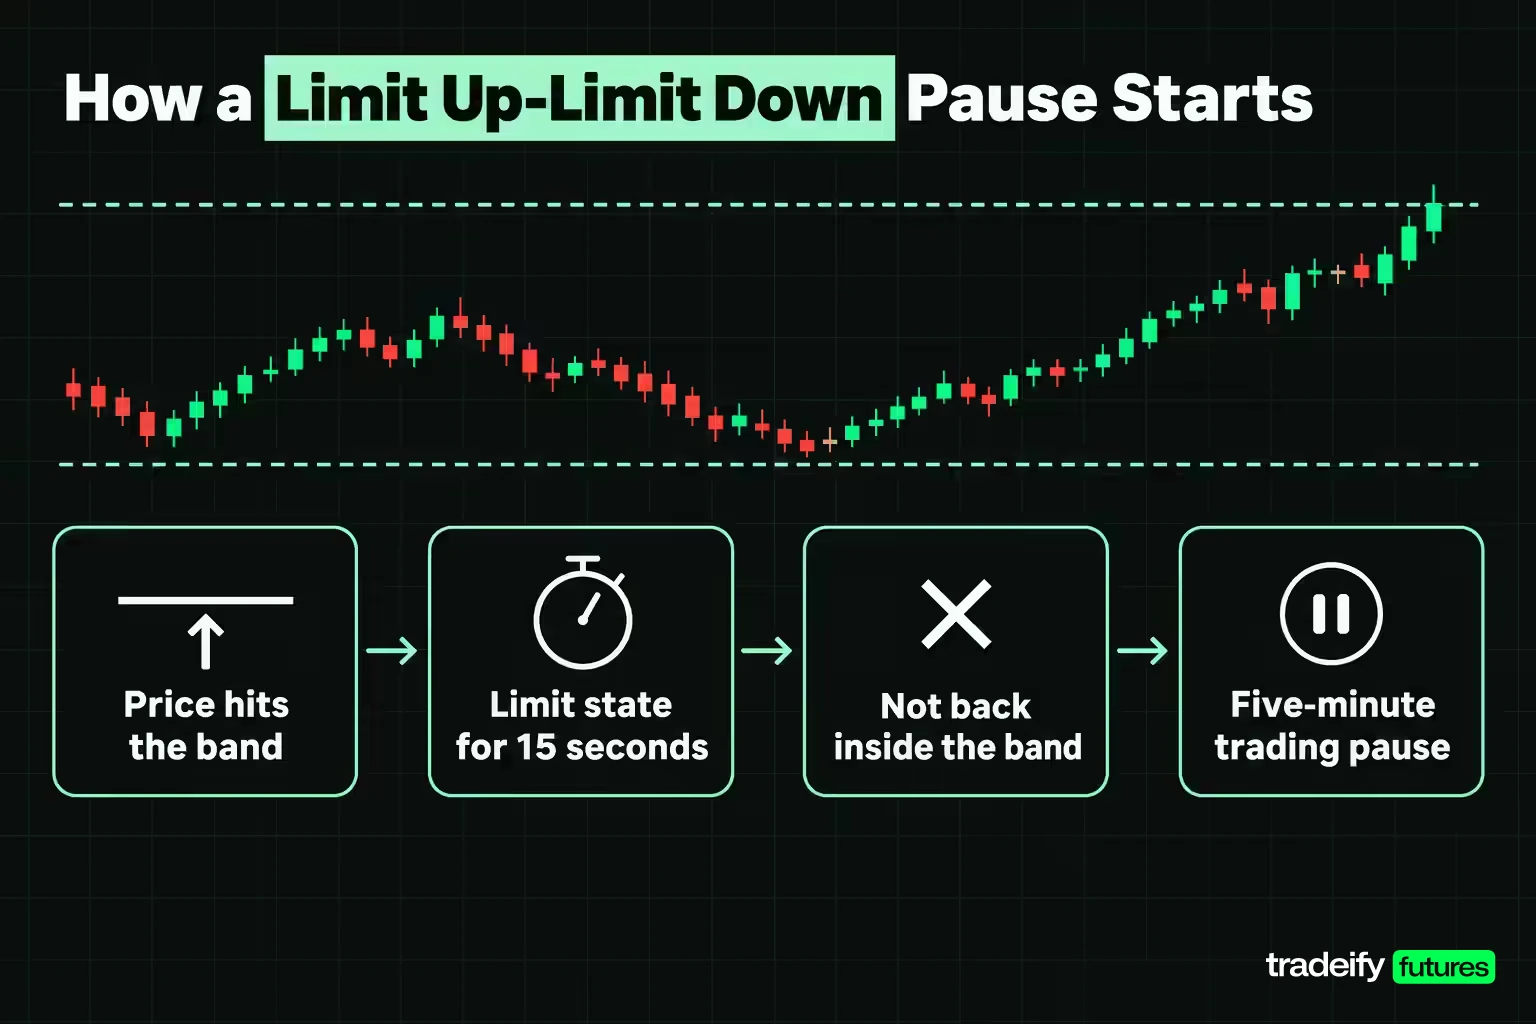
Single-stock halts are the ones active traders actually meet, because they fire on individual names on ordinary days. The Limit Up-Limit Down plan, usually shortened to LULD, sets a moving price band around each stock's average price over the preceding five minutes, recalculated continuously.
When the price reaches the upper or lower band, the stock enters a limit state. If it does not move back inside the band within 15 seconds, trading pauses for five minutes. The listing exchange can extend the pause by another five minutes if there is a significant imbalance between buy and sell orders, and every other market, including off-exchange trading, has to respect the pause.
Band width depends on the stock's tier and price. Tier 1 covers S&P 500 and Russell 1000 stocks plus some exchange-traded products; Tier 2 is every other covered stock.
| Stock tier and price | Band through most of the session | Worked band at an illustrative reference price | Last 25 minutes (3:35 PM to 4:00 PM ET) |
|---|---|---|---|
| Tier 1, above $3.00 | 5% | At $50.00, $47.50 to $52.50 | Doubles to 10%, $45.00 to $55.00 |
| Tier 2, above $3.00 | 10% | At $50.00, $45.00 to $55.00 | No change |
| Either tier, $0.75 to $3.00 | 20% | At $2.00, $1.60 to $2.40 | Doubles to 40%, $1.20 to $2.80 |
| Either tier, under $0.75 | Lesser of $0.15 or 75% | At $0.50, $0.35 to $0.65 | Doubles |
Three exclusions matter. LULD runs only from 9:30 AM to 4:00 PM ET, so it does not cover pre-market or after-hours trading. Rights and warrants are excluded. And over-the-counter stocks are not covered at all, which is why an unlisted name can move violently without ever pausing.
Related lesson: How the two sides of the quote are built
Circuit Breakers in Futures Markets
Circuit breakers in futures work differently, and this is where most stock-focused explanations go wrong. On CME equity index futures, a price limit caps how far price can trade. It does not, by itself, stop trading.
For the E-mini and Micro E-mini S&P 500, CME's published price-limit FAQ sets the rules by time of day (Central Time, with Eastern Time in brackets):
- 8:30 AM to 2:25 PM CT (9:30 AM to 3:25 PM ET): downside limits at 7%, 13% and 20% below the prior day's reference price.
- 2:25 PM to 3:00 PM CT (3:25 PM to 4:00 PM ET): only the 20% downside limit applies.
- 3:00 PM to 4:00 PM CT (4:00 PM to 5:00 PM ET): a hard 7% limit up and down from the 3:00 PM reference price.
- 5:00 PM to 8:30 AM CT (6:00 PM to 9:30 AM ET): a hard 7% limit up and down, plus dynamic circuit breakers with a 3.5% width. If the market moves more than 3.5% within an hour, trading pauses for two minutes.
At an illustrative index level of 7,000, that overnight 3.5% band is 245 points, or $1,225 on one MES and $12,250 on one ES, before the market even pauses.
When equity index futures actually halt
The rule that surprises people: ES and MES halt if, and only if, the cash stock market triggers its own market-wide circuit breaker under NYSE Rule 7.12. If the futures fall 7% on their own, for example overnight, they sit at the limit and keep trading at or above it. Offers priced below the limit are rejected.
When the cash market does trigger a Level 1 or Level 2 halt before 2:25 PM CT, the futures halt with it and resume 10 minutes after the halt began, with the limit expanded to the next level. That is five minutes before the earliest stock reopening. A Level 3 halt ends futures trading for the day, and trading resumes at the regular 5:00 PM CT start of the next session.
Other CME equity index products (for example Nasdaq-100, Dow and Russell 2000 futures) follow a slightly different path: hitting a limit before 2:25 PM CT starts a two-minute monitoring period, and a two-minute halt follows only if the limit condition is still there at the end. During CME pre-open states, orders can generally be entered, modified or cancelled, but nothing matches until trading resumes.
The March 2020 sell-off showed how this works in practice. The working group that later studied it recorded E-mini S&P 500 futures hitting their limit-down state overnight before three of the four market-wide halts.
Related lesson: Trading when a market is locked at its limit
Circuit Breaker History From Black Monday to Today
Circuit breakers are a response to one day. On October 19, 1987, the Dow Jones Industrial Average fell 508 points, or 22.6%, still its largest one-day percentage drop. The presidential task force that studied it, the Brady Report, argued that the market's own breakdowns had become "ad hoc circuit breakers" and that coordinated halts should be designed in advance.
The rules then changed several times:
- 1988: The first SEC-approved market-wide circuit breakers used fixed Dow point drops. A 250-point fall halted trading for one hour and a 400-point fall for two hours, roughly 12% and 19% of the Dow at the time.
- 1996 and 1997: Halt lengths were cut to 30 and 60 minutes, then the triggers were raised to 350 and 550 points, about 5.4% and 8.5% of the Dow.
- April 1998: After the first real trigger in October 1997, the exchanges switched to percentage levels of 10%, 20% and 30% of the Dow, reset each quarter.
- 2010: The May 6 Flash Crash took the Dow down about 9% between 2:32 PM and 2:45 PM before it rebounded within minutes. It never hit the 10% trigger, so the market never halted. Regulators responded with single-stock circuit breakers in June 2010, which were later replaced by Limit Up-Limit Down.
- 2013: The current system took effect. Market-wide breakers moved to the S&P 500 with 7%, 13% and 20% levels on February 4, 2013, and LULD rolled out in two phases starting April 8, 2013 and October 8, 2013.
- 2020: LULD Amendment 18, which removed double-wide bands at the open and close for some stocks, took effect on February 24, 2020, just as the COVID sell-off began.
The lesson running through every change is the same. Thresholds set too tight halt the market on ordinary bad days; thresholds set too loose never fire when they are needed. Each revision moved the trigger toward a level that only genuine liquidity crises reach.
Market-Wide Halts in Real Crashes
Market-wide halts have fired on only a handful of days, and each one taught regulators something.
October 27, 1997. The Dow fell 350 points (4.54%) by 2:36 PM, triggering a 30-minute halt. Trading reopened at 3:06 PM, the selling continued, and the 550-point trigger hit at 3:30 PM, closing the market for the day. The total drop was 554 points, or 7.2%. SEC staff later concluded the thresholds were far too low, since a 4.54% drop had happened on 11 earlier days since 1945, and that a close-for-the-day rule so near the first trigger may have added to the selling.
May 6, 2010. The Flash Crash is the near miss. The Dow dropped about 9% in roughly 13 minutes and recovered most of it, but the 10% trigger was never reached. Individual stocks traded at absurd prices, some down to a penny, which is why single-stock bands exist today.
March 2020. The current S&P 500 based system fired four times in eight trading sessions, all Level 1:
| Date | Level 1 trigger time | What followed |
|---|---|---|
| March 9, 2020 | 9:34:13 AM | Reopening auctions at 9:49:13 AM; S&P 500 closed down 7.6% |
| March 12, 2020 | 9:35:44 AM | Reopening auctions at 9:50:44 AM; S&P 500 closed down 9.5% |
| March 16, 2020 | 9:30:01 AM | Reopening auctions at 9:45:01 AM; S&P 500 ended down 12% |
| March 18, 2020 | 12:56:17 PM | Halt came after an early rally faded |
March 16 is the one to study. The halt fired one second after the open, before most S&P 500 stocks had even completed their opening auctions. After the reopen the index kept falling and finished down 12%, below the 7% halt level but short of the 13% Level 2 trigger. The halt slowed the day down. It did not set a floor.
As for whether a crash is likely in any given year, circuit breakers cannot tell you. They react to a decline that has already happened; they do not forecast one.
Do Trading Halts and Circuit Breakers Work
Whether trading halts and circuit breakers help depends on what you expect them to do. They are designed to interrupt speed, not to change the destination.
The case for them is about time and liquidity. A pause lets traders absorb information, lets liquidity providers reset their quotes, and replaces a disorderly slide with an auction where buyers and sellers meet at one price. After studying March 2020, an industry working group convened at the SEC's request concluded in its March 31, 2021 report that the mechanism worked as intended, that the halts appear to have calmed volatility without causing harm, and that the 7%, 13% and 20% levels and the 15-minute halt length are appropriate.
The case against them is the "magnet effect." If traders believe the market will close at a threshold, some may rush to sell before it does, pulling price toward the trigger. A federal advisory subcommittee cited evidence from China that selling intensified as markets approached a 7% band and floated raising the Level 1 trigger to 10%. The 2021 working group looked at the US data and found no evidence that the 7% and 13% levels act as magnets. It also noted how rare these drops are: since 1962, intraday S&P 500 losses of 7% from the prior close happened just 16 times, and the only four since LULD began were the March 2020 halt days.
There is also a cost that matters more to you than to a policy study. A halt traps every open position for its full length. If your exit plan depends on a working market, the halt suspends the plan along with the market. The honest summary: circuit breakers appear to make the system more orderly, and they make your open position less flexible while they run. Both things are true at once.
Why a Stop Order Cannot Fill During a Halt
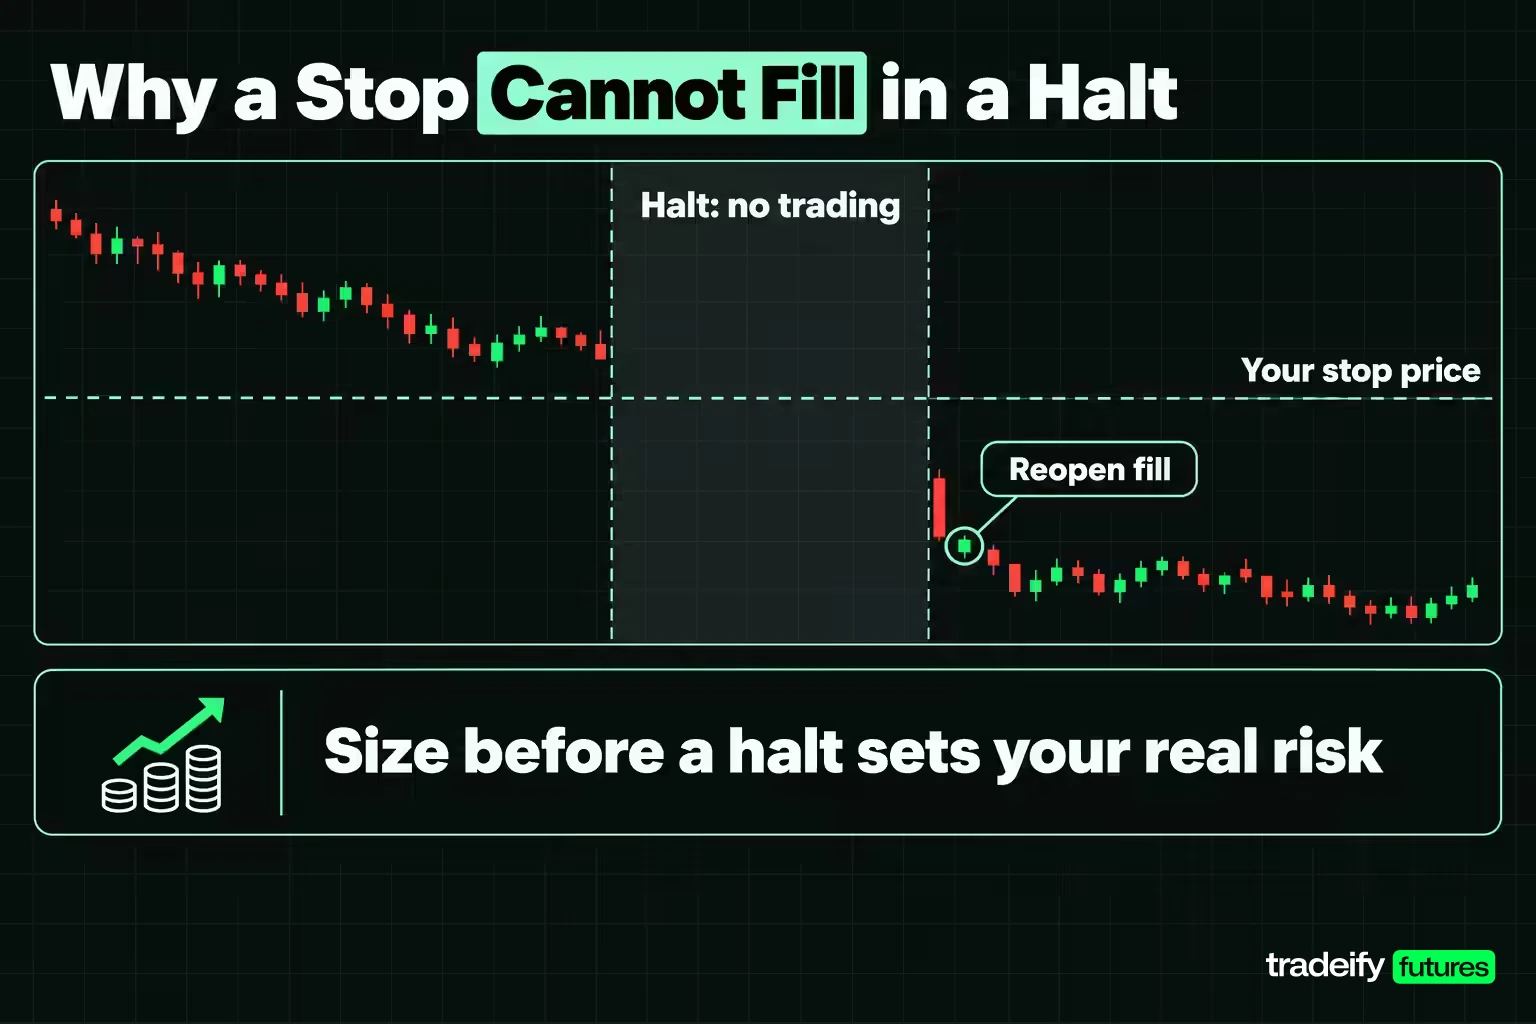
A stop order is an instruction to send an order when a price trades. It is not a promise that a fill exists at that price. During a halt there is no trading at all, so there is nothing for the instruction to reach. When the market reopens, the auction or the first prints set a new price, and that price can be well past your stop.
That gap is not your platform failing or your broker ignoring you. A halt stops trading; it does not stop the market from repricing. Everything that changed during the pause lands in one print.
Here is what that looks like in dollars. Imagine a trader long one MES at an illustrative 7,000 with a stop at 6,980, a 20-point stop and $100 of intended risk, in a $50,000 account.
| Reopen fill | Points lost | Loss on 1 MES | Multiple of the $100 plan | Share of $50,000 |
|---|---|---|---|---|
| 6,950 | 50 | $250 | 2.5 times | 0.5% |
| 6,930 | 70 | $350 | 3.5 times | 0.7% |
| 6,900 | 100 | $500 | 5 times | 1% |
Run the same trade on one ES and the intended risk is $1,000. A 70-point fill is $3,500, or 7% of the account, and a 100-point fill is $5,000, or 10%. Same stop, same chart, ten times the damage, because the size was chosen for a market that was open.
None of this makes stops useless. It means a stop is a plan for a market that is trading. A halt is the one situation where you know in advance it will not be, so the risk you carry through a halt is set by your position size before it starts, not by where the stop sits.
Related lesson: How stop orders trigger and fill
What to Do When a Trading Halt Hits
When a symbol or the whole market freezes, the useful question is not how far the index has fallen. It is what you are holding and what can still act on it. Work through the steps in order.
- Identify the halt. Read the code. LUDP or LUDS means a band pause of about five minutes. T1 or T2 means news, so watch for published resumption times. T12, H10 or an operations halt means nobody can tell you the clock. For futures, check whether it is a two-minute dynamic pause or a halt tied to a cash-market circuit breaker.
- If you are flat with no orders, stay flat. A halt is not an entry signal. The reopen is where the market finds a new price, and the first prints can move hard in either direction.
- If you hold a position, accept that you cannot exit until trading resumes. Check whether your venue accepts order entry during the pause; some instructions queue for the reopen and others are rejected.
- Treat any protective stop as unverified. It works as intended only if a market exists at your price when trading resumes. In a gap it fills worse or, if it is a stop-limit, may not fill at all.
- Decide about unfilled working orders now. Some may already have been cancelled or rejected by the venue. Others will execute at the reopen whether or not you still want them.
- When trading resumes, confirm every protective order is live before anything else. Brackets and attached stops can be cancelled or rejected around a halt, and an unprotected position is the real risk in that moment.
- Size the next decision against what just happened. If a 20-point stop just filled 70 points away, the temptation is to win it back on the next trade. The better move is reducing exposure until the market settles.
Trading halts on a prop firm account
On a prop firm account, the firm's own rules keep running while the exchange is halted. A daily loss limit, a trailing drawdown and a required flat time still apply to the price you get when trading resumes, so a halt can turn into a rule breach even though you never touched the mouse.
On our accounts, a CME halt is treated as what it is: an exchange event that hits every participant equally, so we don't compensate losses during CME halts. News trading is allowed at your own risk, positions still have to be closed by 4:45 PM ET, and the daily loss limit is not a stop loss, since system protection may not be effective in extreme volatility. Size for the gap, not for the stop.
Trading Halts and Circuit Breakers FAQ
What triggers a trade halt?
Four things can. A market-wide circuit breaker fires on a 7%, 13% or 20% drop in the S&P 500. A single-stock LULD pause fires when a stock holds at its price band for 15 seconds. The listing exchange can halt a stock for pending news or missing information, and the SEC can suspend trading for up to ten business days.
Can you sell a stock during a trading halt?
No trades happen in a halted stock on any market, including off-exchange venues. Depending on the exchange and your broker, you may be able to enter an order that waits for the reopening auction. That is a queued instruction for later, not a sale now.
Do futures keep trading when the stock market halts?
Not when the stock market triggers a market-wide circuit breaker before 2:25 PM CT. E-mini and Micro E-mini S&P 500 futures halt with it and resume 10 minutes after the halt began, with wider limits. A futures-only 7% move does not halt ES; it trades at or above the limit.
What is the 3-5-7 rule in the stock market?
It is an informal risk-management rule of thumb that circulates among traders, with several versions, not an exchange or regulatory rule. It is easy to confuse with circuit breakers because of the numbers. The official market-wide thresholds are 7%, 13% and 20%.
Is there likely to be a market crash in 2026?
Nobody can say whether a crash will happen in 2026, and circuit breakers do not try to predict one. They react to a decline that is already under way and slow it down. What you can control is how much size you would be holding if one happened.
Do circuit breakers stop the market from falling?
They interrupt the speed, not the direction. On March 16, 2020, the market halted at 7% and still finished down 12%. Treat a halt as a pause, never as a floor.
This article is educational and is not investment advice or a recommendation to trade any instrument. Futures and other leveraged products can lose money quickly, and gaps through halts and price limits can produce losses far larger than a planned stop. The index levels, prices and dollar figures here are illustrations built from published exchange rules and contract specifications, not live data. Halt rules, limits and order handling are set by exchanges and regulators and can change, so check the current rules for your venue. Evaluation and funded accounts at prop firms are simulated, and their execution can differ from live markets.


