



TL;DR: Break even stops swap a possible loss for a small scratch, and they also turn some winners into scratches. On a 490-trade E-mini study, arming the move at 1R improved the paired result by 11.78R and cut drawdown 38.05%. Arming at 0.25R scratched 61.30% of shared entries and lost 4.95R, and no level was statistically separable from leaving the stop alone. The move pays only when returning trades would have hit the target less than 1 / (1 + target multiple) of the time.
A trade goes your way, you slide the stop up to your entry, and for a moment the position feels free. Then price drifts back, tags the stop by a tick, and runs to where your target was. Most traders who use break even stops know that afternoon.
The question is not whether that happens. It does. The question is whether the losses the move removes are worth more than the winners it removes, and that is a measurable question. This guide explains how break-even stops work, how to place them, the arithmetic that decides whether they pay, and what happened when the same E-mini rule was run with and without the move at seven different trigger levels.
What a Break Even Stop Is
A break even stop is an ordinary stop order whose price has been moved from its original distance to the trade's entry price, or one or two ticks beyond it, once the trade has moved far enough in your favour. "Break-even" in trading means the price at which a position shows neither a gain nor a loss. Some traders include commissions in that price, which pushes it a little beyond the raw entry.
The order type does not change when you move it. Investor.gov describes a stop order as an order that becomes a market order when the stop price is reached, and notes that the price at which the trade executes may differ from the stop price, especially in a fast-moving market. So a break-even stop is a trigger at the entry price, not a promise of an exit at the entry price.
On CME Globex, a stop is typically entered as a stop order with protection. CME's definitions say such an order fills only within a protected range set by the exchange, and any quantity that cannot fill inside that range stays in the book as a limit order. That stops absurd fills during a fast move, but it also means a moved stop can sit unfilled for a moment while price runs away from it.
Related lesson: The mechanics behind stop placement
What a break-even stop changes and what it does not
A break-even stop removes one outcome: the trade that reaches some profit and then goes all the way back to the original stop for a full loss. It adds a new outcome: the trade that comes back to entry, scratches, and then would have gone on to the target.
It does not change the entry, the market or the setup. It also does not take the risk out of the position. A session can open beyond the moved stop, and the fill can land below your entry on a long or above it on a short.
How to Move a Stop Loss to Breakeven
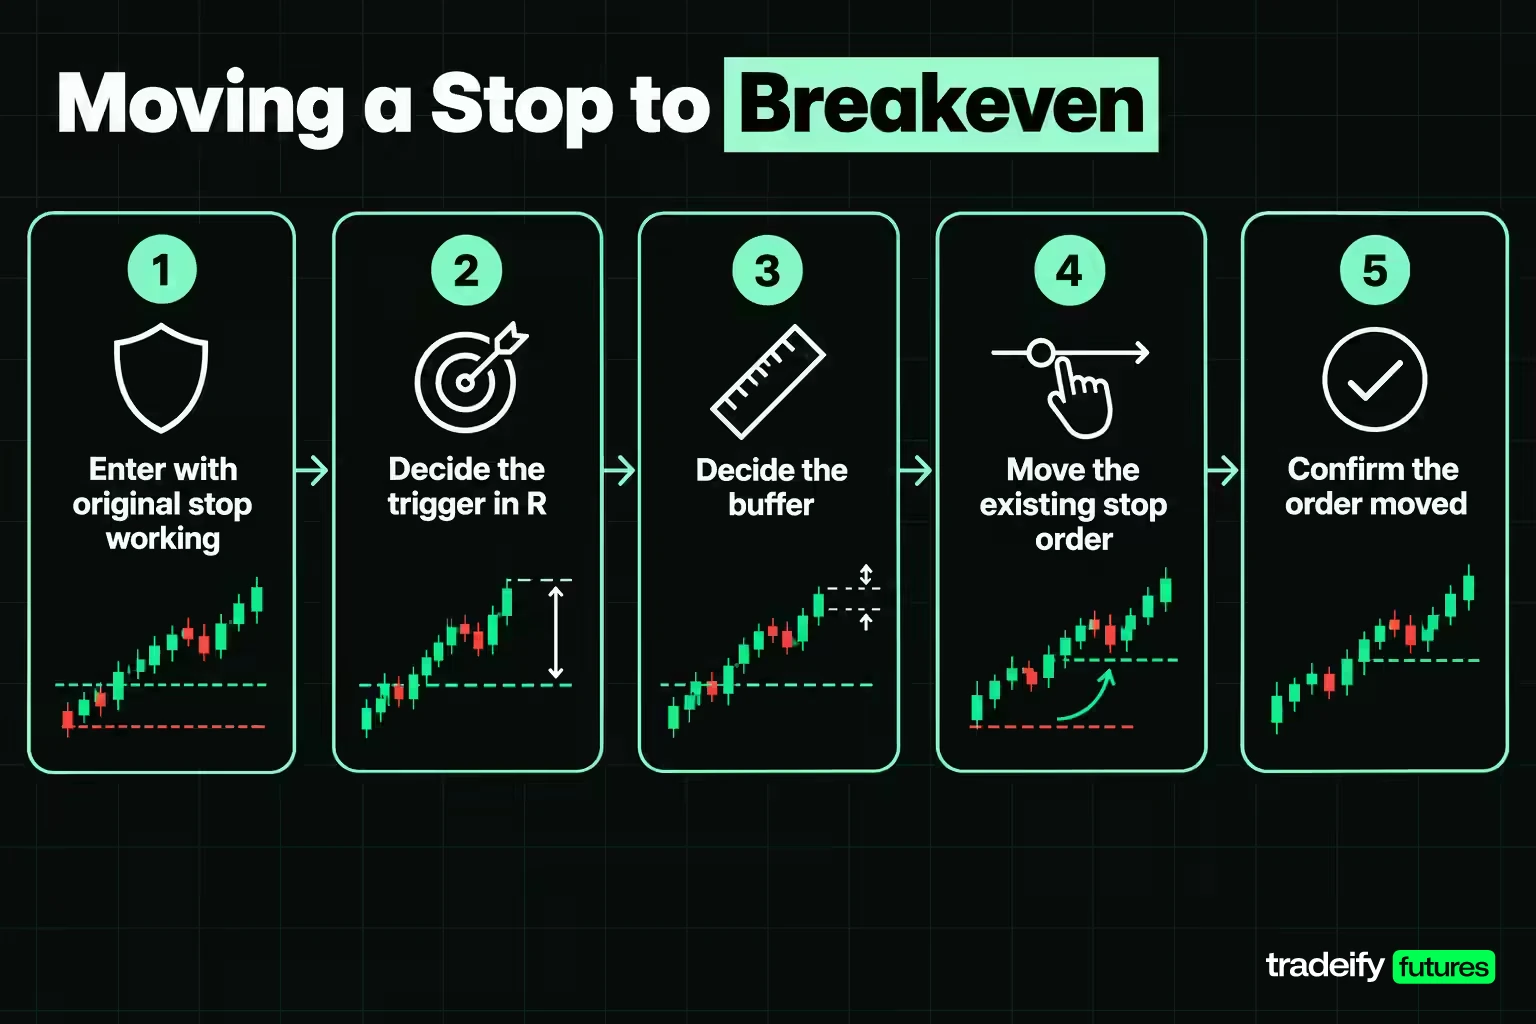
Moving a stop to breakeven is a short process, and most of the mistakes happen in the details rather than the idea.
- Enter with your original stop already working. The break-even move is a later edit, not a replacement for the first stop.
- Decide the trigger before the trade. Write it in R (multiples of the distance from entry to the original stop) or in points, such as "move at +1R".
- Decide the buffer. Placing the stop one tick beyond entry on the profitable side covers part of the round-turn cost. On the E-mini S&P 500 (ES) a tick is 0.25 index points, worth $12.50; on the Micro E-mini S&P 500 (MES) it is $1.25; on the E-mini Nasdaq-100 (NQ) it is $5.00; on the Micro E-mini Nasdaq-100 (MNQ) it is $0.50.
- Move the existing stop order rather than adding a second one. Dragging the stop on the chart or the DOM edits the working order; placing a new stop while the old one still rests can leave two exit orders on one position.
- Confirm the order moved. Check the working orders list, not just the chart line, and check that the quantity still matches the position.
Automatic break-even settings in bracket orders
Many platforms automate the trigger, buffer and order edit inside a bracket template. You set a profit trigger in ticks or points, and the platform moves the stop to breakeven, often with an offset, when the trigger trades. Automation removes hesitation, but it also removes judgment. It moves the stop on every trade, including the ones where the market structure says the trade still needs room.
The manual version has the opposite problem. The trigger you wrote down was 1R, but one heavy-looking candle at 0.6R is enough to make the stop move early. If you trade the move by hand, write the trigger on the order ticket or the chart before entry so the in-trade decision is only "did it trade there or not".
Expected Value of Moving Your Stop to Breakeven
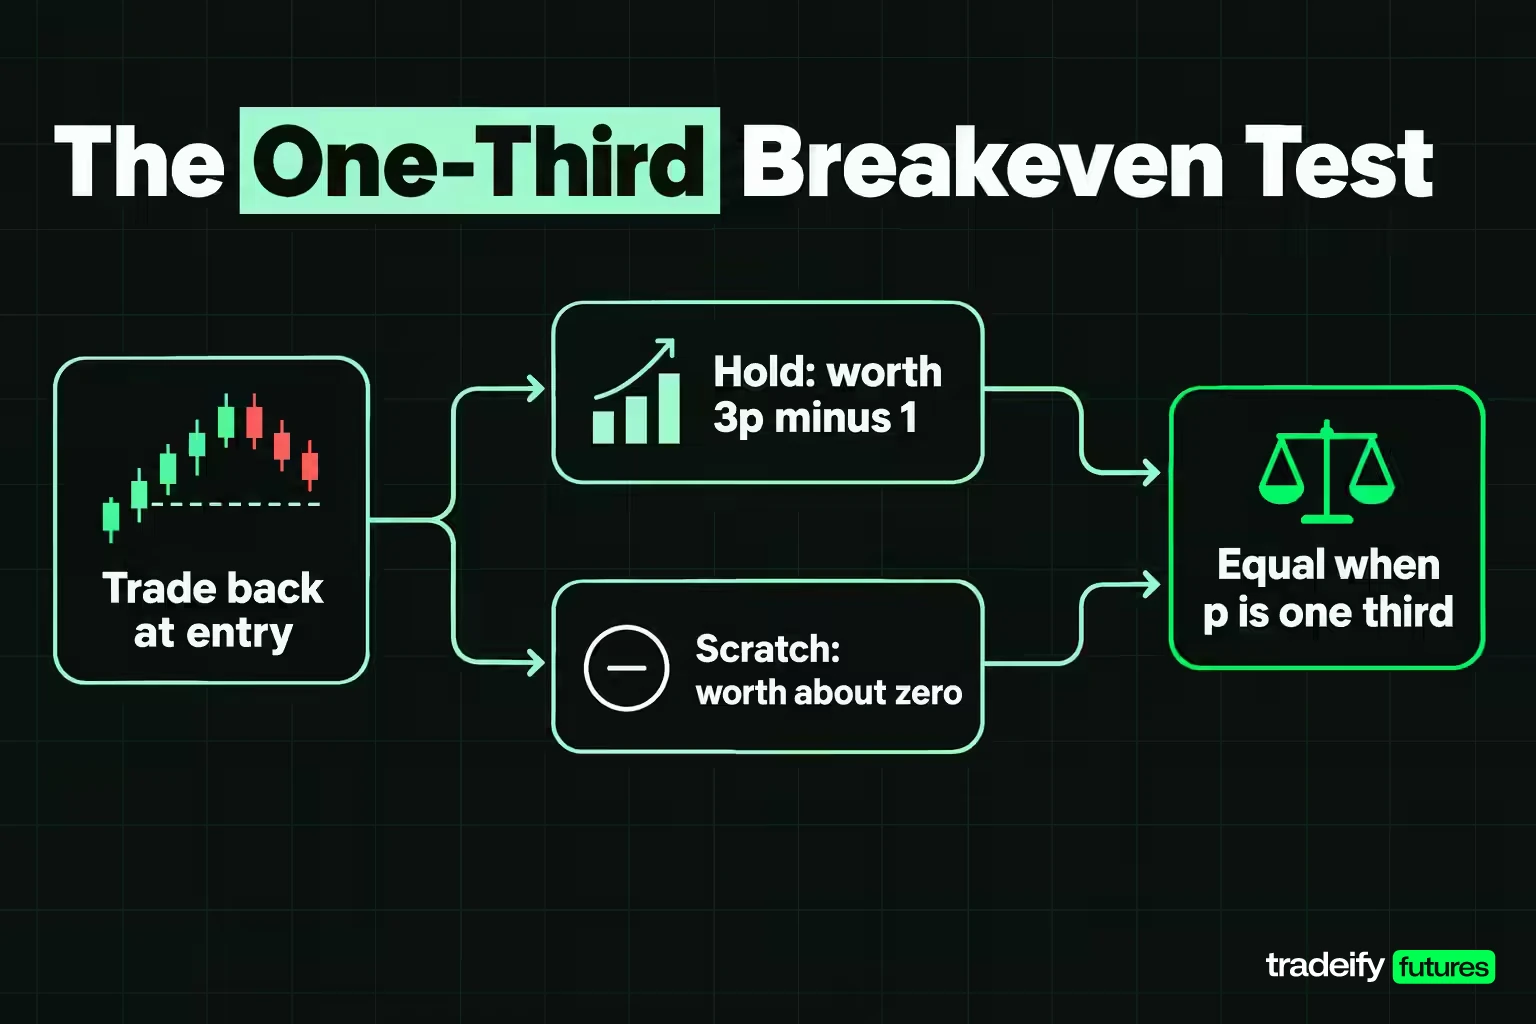
The expected value of a break-even stop comes down to one group of trades: the ones that reach your trigger and then come back to your entry. Every other trade finishes the same way whether you move the stop or not.
Take a trade with a 1R stop and a 2R target. Suppose it has already come back to the entry price, and call p the chance it would still reach the target if you left the stop alone. Holding is worth 2 times p, minus 1 times (1 minus p), which simplifies to 3p minus 1. A scratch is worth roughly zero. The two are equal when p is one third.
So the move is cheap when fewer than 33.33% of returning trades would have gone on to the target, and expensive when more do. For any target multiple m, the parity share is 1 divided by (1 plus m): 50% for a 1R target, 33.33% for 2R, 25% for 3R.
Why a scratch is not exactly zero
A scratch costs money. With the stop one tick beyond entry, a clean fill recovers one tick, and a round turn costs commission plus spread and slippage. If that round turn comes to about two ticks, the scratch nets about minus one tick per contract.
In R, that cost depends on the stop distance. In the 490-trade E-mini study in this guide, the median stop was 26.138 points on ES and 65.692 points on NQ, so one tick was 0.0096R on ES and 0.0038R on NQ. Small, but paid on every scratch, and a scratch that gaps through the moved stop costs far more.
Time exits and partial outcomes
Real trades do not only end at the stop or the target. Many end on a time limit, at the close of the session, or on a discretionary exit. Those outcomes sit between minus 1R and plus 2R, which is why the clean parity formula is a starting point rather than a verdict. The practical test is simpler: compare the average R that the returning trades actually earned with the average R of the scratches that would replace them.
Related lesson: Expectancy across a whole sample of trades
How the 490-Trade E-mini Stop Study Was Run
The study behind this guide is an illustrative measurement, built so anyone can rebuild it. It is not a strategy recommendation, and it tests one rule on one data set.
The data are Yahoo Finance daily bars for the front-month continuous E-mini S&P 500 (ES=F) and E-mini Nasdaq-100 (NQ=F) from September 18, 2006 to September 15, 2026, with 5,031 usable sessions per product after dropping sessions with a missing price field.
The rule:
- From the 21st session onward, buy at the close when the close is above the prior 55-session high, or sell short at the close when it is below the prior 55-session low.
- Set the risk unit, 1R, to the 20-session Wilder average true range as of the prior close. The stop is 1R from entry and fixed; the target is 2R.
- Hold for at most 20 sessions, then exit at that session's close. One position per product at a time; a new signal may be taken at the close of the session that ended the last trade.
- Charge two ticks (0.50 index points) per round turn on every trade.
- If a session opens beyond the stop or the target, fill at the open. If one session touches both, count the stop first, the pessimistic reading of a daily bar.
How the break-even versions and the paired test work
The break-even versions of the E-mini rule change only one thing. At the close of the first session whose best price reaches the arming level, the stop moves to one tick beyond entry on the profitable side, and the moved stop is live from the next session. That one-session delay keeps the arming bar from also being the exit bar, which a daily bar cannot resolve honestly.
With the stop untouched, the rule produced 490 completed trades, 246 on ES and 244 on NQ, for a total of 20.02R. Because a scratch frees the position sooner, each break-even version of the rule takes a different set of later signals. So the study also runs a paired comparison restricted to the entries both versions share, where the stop is the only difference. The 95% interval on each paired change comes from 20,000 bootstrap resamples of the per-trade differences.
E-mini Stop Study Results by Arming Level
These results come from this guide's own 490-trade E-mini breakout study: Yahoo Finance daily bars for ES and NQ from 2006 to 2026, a 1R stop and a 2R target, with the stop moved to one tick beyond entry once a trade reached the arming level. The first table runs each version of the rule on its own. Arming levels are in R, the distance from entry to the original stop.
| Arming level | Trades | Total R | Scratches | Target hit rate | Max drawdown R |
|---|---|---|---|---|---|
| Stop never moved | 490 | 20.02 | 0 | 33.06% | 24.31 |
| 0.25R | 618 | 18.76 | 392 | 15.05% | 14.73 |
| 0.5R | 559 | 21.37 | 265 | 19.68% | 18.68 |
| 0.75R | 521 | 19.76 | 178 | 23.22% | 17.79 |
| 1R | 503 | 32.26 | 116 | 27.44% | 16.96 |
| 1.25R | 492 | 32.97 | 84 | 29.07% | 17.11 |
| 1.5R | 491 | 16.55 | 46 | 30.14% | 18.79 |
| 1.75R | 490 | 21.88 | 20 | 32.04% | 19.79 |
The second table holds the entries constant. "Losses saved" are scratched trades that lost money with the stop untouched; "winners cut" are scratched trades that made money with it untouched.
| Arming level tested | Shared entries | Trades scratched | Losses saved | Winners cut | Change in R | 95% interval R |
|---|---|---|---|---|---|---|
| 0.25R | 447 | 274 | 185 | 89 | -4.95 | -49.99 to 38.94 |
| 0.5R | 453 | 212 | 144 | 68 | 4.18 | -34.41 to 42.43 |
| 0.75R | 465 | 161 | 108 | 53 | 0.28 | -34.25 to 33.79 |
| 1R | 477 | 112 | 78 | 34 | 11.78 | -15.44 to 38.46 |
| 1.25R | 482 | 83 | 59 | 24 | 13.41 | -10.10 to 35.96 |
| 1.5R | 487 | 46 | 30 | 16 | -2.46 | -20.65 to 15.12 |
| 1.75R | 490 | 20 | 14 | 6 | 1.86 | -9.88 to 12.81 |
Reading the E-mini break-even study results
Three findings hold up across the tables.
First, every interval contains zero. On 490 trades, this sample cannot show that any arming level changes the long-run result. The totals bounce between levels (1.5R is worse than 1.25R and 1.75R on either side of it), which is what noise looks like.
Second, the composition change is not noise. At every level the move removed about two losing trades for every winner it cut, and each cut winner was worth roughly twice a saved loss. At 1R that was 78 losses saved against 34 winners cut.
Third, drawdown fell at every arming level. On the shared entries at 1R, the worst peak-to-trough run dropped from 23.23R to 14.39R, a 38.05% reduction. If smoother equity is the reason you want the move, the study supports that reason far better than it supports "more profit".
What would change that reading: a larger sample, intraday bars that resolve the order of the stop and target inside a session, or a different entry rule whose trades retrace less often. Any of those could move the totals. The drawdown effect is the part most likely to survive, because it comes straight from removing full losses.
When to Move Your Stop to Breakeven
When to move your stop to breakeven depends on how often trades that reach a given profit come back to the entry. In this guide's own 490-trade E-mini breakout study (Yahoo Finance daily bars, 2006 to 2026), 81.97% of trades that reached 0.25R later traded back through the break-even level before they ended. At 0.5R it was 72.38%, at 1R it was 49.57%, and at 1.5R it was 29.11%.
Those numbers explain the whole debate. Arm early and you are editing the stop on trades that are still just breathing. Arm late and the move touches far fewer trades, and the ones it touches have already proved something.
Conditions that justify moving the stop, rather than a fixed habit:
- The trade has earned a distance you chose in advance, such as 1R, and that distance came from your own records.
- Price has made a new swing in your favour, so the original reason for the stop location (the level that would prove you wrong) is now behind the market.
- An account constraint matters more than expectancy, such as a daily loss limit or a drawdown floor that one full loss would threaten.
- A scheduled release or the session close is near, and you would rather scratch than carry the outcome through it.
A condition that does not justify it: the open profit feels uncomfortable. That is the most common trigger in practice and the only one with no data behind it.
Breakeven Stop Timing With ATR and Market Structure
Breakeven stop timing is a choice of trigger, and each common trigger has a different weakness.
R multiple and ATR breakeven triggers
An R trigger moves the stop when open profit reaches a multiple of the initial risk. Because the study's 1R was one 20-session average true range (ATR), its triggers were also volatility-scaled: arming at 1R meant arming once price had moved one ATR in the trade's favour. Volatility scaling keeps the trigger from being too tight on a fast day and too loose on a quiet one.
The weakness is that ATR describes the average range, not this trade's structure. A trade can reach 1 ATR while sitting right under a level that is likely to push it back.
Structural breakeven triggers at swing highs and lows
A structural trigger waits for the market to form a new swing in your favour, such as a higher low on a long, and then moves the stop to breakeven or just beyond that swing. The logic is clear: the stop follows the level that would invalidate the trade, not a round number of points.
The weakness is that swings are judged after the fact, and "confirmed" means different things on different timeframes. Write down what counts as a confirmed swing before the session.
Order-flow breakeven triggers
Some traders wait for evidence in the order flow, such as aggressive selling being absorbed near entry on a footprint chart, before trusting a level. It can add context, but it is the hardest trigger to define in advance and to test, which makes it the easiest to use inconsistently.
Pros and Cons of Break-Even Stops
The pros and cons of break-even stops show up clearly when the same rule is compared with and without the move.
| Effect on the rule | Stop never moved | Break-even armed at 1R |
|---|---|---|
| Trades | 490 | 503 |
| Share of trades that did not lose | 35.71% | 51.69% |
| Share of trades that reached the 2R target | 33.06% | 27.44% |
| Max drawdown R | 24.31 | 16.96 |
| Total R | 20.02 | 32.26 |
Read the two columns as a trade between two kinds of discomfort. The untouched stop gives you more full losses after open profit; the break-even stop gives you more scratches that run without you.
Pros:
- More trades finish without a loss, which can make a losing streak shorter and easier to sit through.
- Drawdown fell at every arming level in the study.
- Open risk on the position drops to roughly the cost of a scratch, so a trader can take the next setup without stacking two full risks.
Cons:
- Fewer trades reach the target, because the trades most likely to run often retrace first.
- Each scratch has a cost in ticks, and gaps through the moved stop cost more.
- The improvement in totals was not statistically reliable at any level, and it reversed between neighbouring levels.
Risks of Moving a Breakeven Stop Too Early
The main risk of moving a breakeven stop too early is that you end up managing noise. In this guide's own 490-trade E-mini breakout study (Yahoo Finance daily bars, 2006 to 2026), arming at 0.25R scratched 392 of 618 trades, the target hit rate fell from 33.06% to 15.05%, and the paired result was 4.95R worse than leaving the stop alone.
Why an early breakeven scratch costs more than it looks
In that 490-trade E-mini study, when the move was armed at 0.25R, 28.47% of the scratched trades would have reached the target, which looks favourable against the 33.33% parity line. The cost still won. The scratched trades averaged -0.06R with the stop untouched, while the scratches that replaced them averaged -0.08R, because so many of them did not fill at the planned tick.
Gaps through the moved stop
A stop one tick from entry sits where price trades constantly. In this guide's 490-trade E-mini study on daily bars, 117 of the 618 exits in the 0.25R run and 56 of the 559 exits in the 0.5R run were sessions that opened beyond the moved stop, at an average of -0.25R instead of the one-tick loss the plan assumed. In the untouched run, 5 of 490 trades gapped through the original stop, the worst filling at -1.22R.
Crowded entry prices
Entry prices on breakouts often sit at obvious levels, the same ones other traders use for their own entries and stops. A stop placed exactly at such a level is easy to reach on an ordinary retest. A tick or two of buffer, or a structural trigger, keeps the stop off the most crowded price.
Moving Stops to Entry in Risk Management and Position Sizing
Break-even stops belong to risk management because they change open risk and drawdown, not because they raise expectancy. Position size is still set by the original stop. The move only matters after the trade is on.
A worked break-even example on a $50,000 account
The following uses round, illustrative figures. Assume a $50,000 account and a 1% risk cap, which is $500, trading MES at $5 per index point with a stop of 26.138 points, the median ES stop distance in this guide's own 490-trade E-mini breakout study.
- Risk per contract is 26.138 times $5, or $130.69.
- $500 divided by $130.69 is 3.83, rounded down to 3 contracts.
- Three contracts risk $392.07, about 0.78% of the account, and the 2R target is worth $784.14.
- A scratch one tick beyond entry recovers 3 ticks of $1.25, or $3.75, and a two-tick round turn on 3 contracts costs $7.50. The scratch nets about -$3.75.
Now scale that study to this position. On ES alone, the study's untouched breakout rule made 0.25R over 246 trades in twenty years, about $99 at $392.07 per R. On the ES entries shared with the 1R break-even version, the move changed the result by 6.92R, about $2,711. The stop management mattered more than the edge, and the interval on that change still straddled zero.
The same 26.138 points on one full-size ES contract is $1,306.90 of risk, which is why the contract choice comes before any decision about moving the stop.
Related lesson: How full-size and Micro contracts differ in the dollars at risk
Breakeven stops with drawdown and daily loss limits
Many evaluation and funded accounts carry a trailing drawdown or a daily loss limit. A break-even stop can stop a profitable trade from turning into a full loss that brings the account close to its floor. It cannot protect against a gap or fast market that fills the moved stop well beyond entry, so the size still has to fit the limit with the original stop in place.
Partial Breakeven Stops on Split Positions
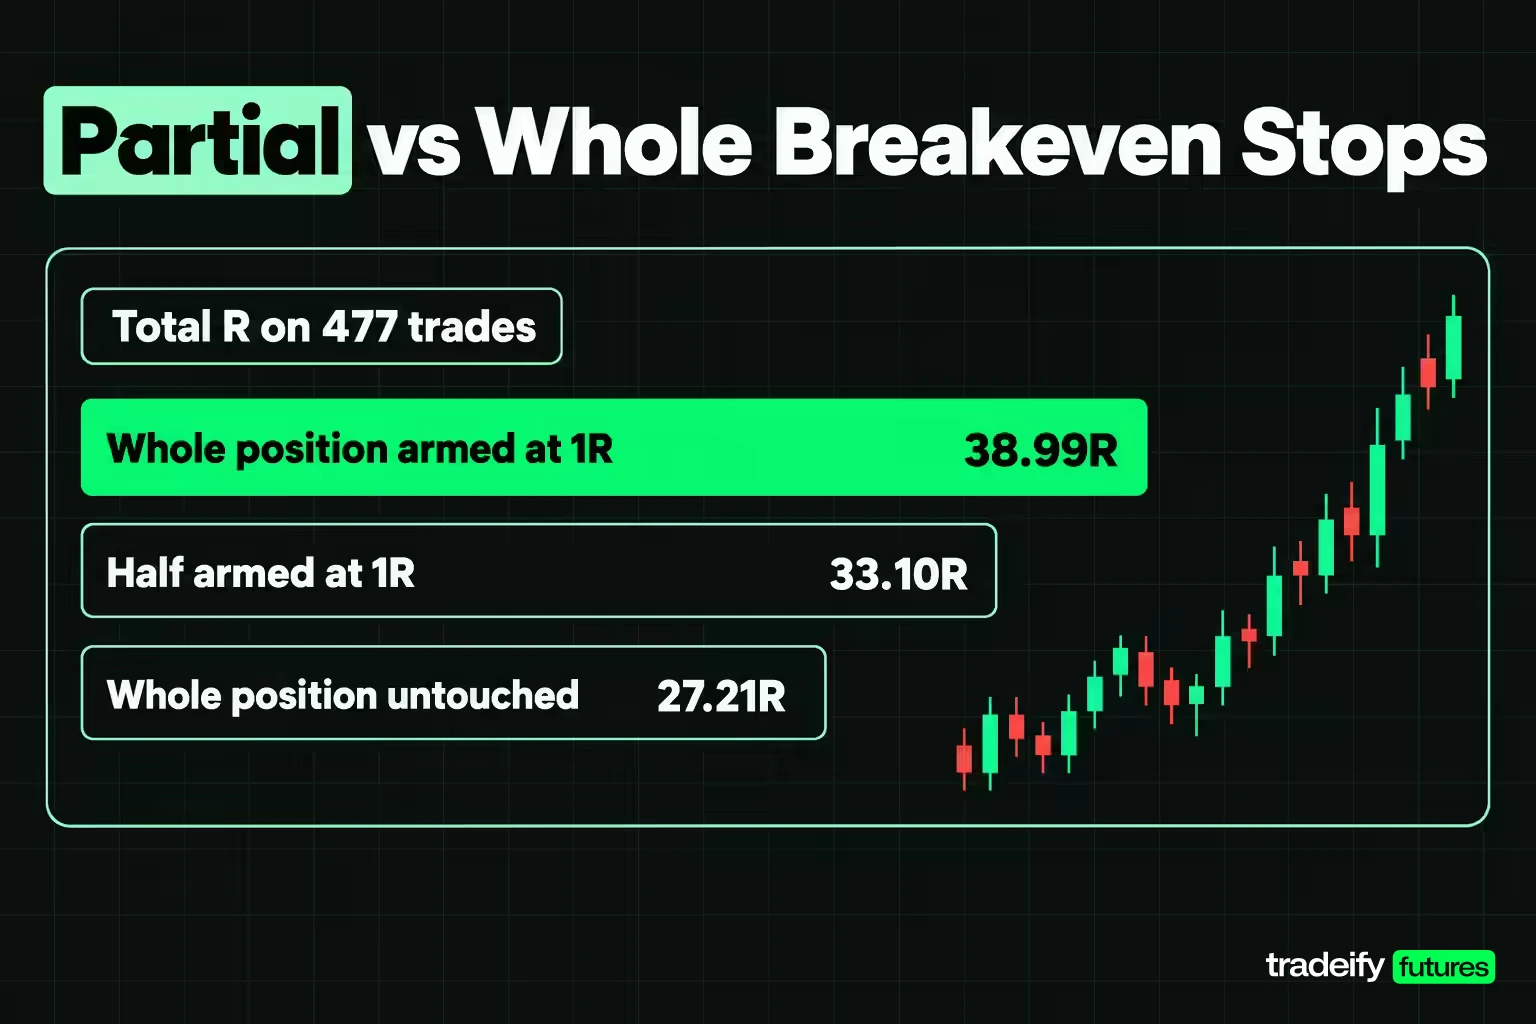
A partial break-even stop applies the move to part of the position. With two or more contracts, you can let one portion keep the original stop and move the other to breakeven, or bank part of the trade at a first target and move the rest to breakeven.
This guide's own 490-trade E-mini breakout study (Yahoo Finance daily bars, 2006 to 2026) tested both versions.
| Split version | Trades compared | Total R | Max drawdown R |
|---|---|---|---|
| Half untouched, half armed at 1R | 477 | 33.10 | 18.44 |
| Whole position armed at 1R | 477 | 38.99 | 14.39 |
| Whole position untouched | 477 | 27.21 | 23.23 |
| Half closed at 1R, rest to breakeven | 503 | 21.61 | 14.07 |
The half-and-half version landed between the two pure versions on both total and drawdown, as you would expect. The scale-out version cut drawdown to 14.07R, close to the full 1R version, but gave up much of the total, because half of every trade that reached 1R was capped at 1R. A split position is a way to buy part of the drawdown reduction without betting the whole position on one arming level. It needs a contract count that divides cleanly, which is one reason micro contracts are popular for this.
Related lesson: What changes when a position is added to or reduced as it runs
Breakeven Stop Behaviour in Futures, Forex and Stocks
Break-even stops behave differently by market because tick size, session structure and product behaviour change both the cost of a scratch and how often price comes back.
Break-even stops on futures contracts
In this guide's own 490-trade E-mini breakout study (Yahoo Finance daily bars, 2006 to 2026), ES and NQ disagreed about break-even stops. Over twenty years the untouched rule made 0.25R on ES and 19.77R on NQ. At the 1R arming level the paired change was 6.92R on ES and 4.86R on NQ; at 1.5R it was -5.25R on ES and 2.79R on NQ. A setting that looks right on one contract can look wrong on its closest cousin, so test per product.
Break-even stops on forex lot sizes
In spot forex, position size is in lots. A 0.01 lot is a micro lot, 1,000 units of the base currency, and on a pair quoted in US dollars one pip (0.0001) is worth about $0.10 at that size. The break-even arithmetic is the same, with pips in place of ticks, but the spread is often the main cost of a scratch, and it can widen around news.
Break-even stops on stocks and overnight gaps
Individual stocks can open far from the prior close after earnings or news released outside regular hours, so a break-even stop held overnight can fill well beyond entry. The parity math still applies; the gap risk is larger.
The Psychology of Break-Even Trading
The psychology of break-even trading starts with relief. Once the stop is at entry, the trade cannot hurt you much, and that feeling is real. It is also the reason the move gets made at the wrong times.
The common pattern runs like this. A trader takes a full loss after a trade was up nicely, feels the regret of giving it all back, and resolves to move the stop sooner next time. Then a few early scratches turn into winners without them, the regret flips direction, and the trader starts leaving the stop alone again. The rule changes with the last trade, not with the evidence.
A few precommitted rules help:
- Write the arming level into the plan before the trade, and use it on every qualifying trade.
- Do not move the stop because of open profit alone. Move it because the trigger you chose traded.
- Judge the setting over at least 50 to 100 trades, not over one painful scratch.
- Record each scratch and what price did next, so the regret has a number attached.
A scratch that runs to your target without you is not a mistake if the rule said to move the stop. It is one line in a sample, and the sample is what decides.
Test Your Own Breakeven Stop Rule
A published study answers one rule on one data set. Testing your own break-even stop rule takes a spreadsheet and your last 100 closed trades.
- For every trade, record the maximum favourable excursion in R: the furthest the trade moved in your favour, divided by your initial risk.
- For each arming level you are considering, count the trades that reached it.
- Among those, mark the trades that later came back through your entry before exiting.
- Among the returning trades, count how many reached your target anyway, and compare that share with 1 divided by (1 plus your target multiple).
- Add up the R those returning trades actually earned, and compare it with the cost of the same number of scratches on your instrument.
If the returning trades earned less than the scratches would cost, the move helps your trading at that level. If they earned more, the move costs you, and the only remaining question is whether the drawdown reduction is worth the price.
Break Even Stops FAQ
Should you always move your stop loss to break even?
No. In this guide's own 490-trade E-mini study, the move improved the paired result at some arming levels and worsened it at others, and none of the changes was statistically reliable. It did reduce drawdown at every level. Use it when your own records show the returning trades rarely reach the target, or when drawdown control matters more than the total.
Is a break-even stop the same as a trailing stop?
No. A break-even stop moves once, to the entry price, and then stays. A trailing stop keeps following price by a set distance, so it can lock in profit beyond entry but also gets hit by ordinary pullbacks more often.
What is the 3-5-7 rule in trading and how does it work?
The 3-5-7 rule is an informal heuristic that caps risk at 3% of the account per trade and 5% across all open positions, and pairs them with a 7% figure for winners. Versions differ on whether the 7 is a profit target or a size ratio between winners and losers, and it is not an exchange or regulatory rule. On a $50,000 account, 3% is $1,500 per trade and 5% is $2,500 of total open risk, both far larger than many day traders use.
Is it true that 97% of day traders lose money?
It is true for one studied group: Chague, De-Losso and Giovannetti found that 97% of persistent day traders in Brazilian equity index futures lost money. The group was the 1,551 people who began between 2013 and 2015 and kept going for more than 300 days, and only 1.1% of them earned more than the Brazilian minimum wage. It describes one market and one period, not every trader.
Next Step Before Moving Your Next Stop to Entry
Open your last 100 closed trades and add one column, the maximum favourable excursion in R. Then mark every trade that came back through its entry, and count how many of those reached the target anyway. If that share sits well below the parity line for your target multiple, a break-even stop is likely cheap for you; if it sits above, leave the stop alone for the next 100 trades and measure again.
Related lesson: The costs that sit inside a futures round turn
On our accounts, Tradovate ATM strategies include an Auto Breakeven stop type that moves a stop-market order to breakeven after a profit trigger you set, though bracket and ATM orders are not supported while Group Trading. Our trailing drawdown is enforced in real time on net liquidation value, which includes open profit and loss, so a moved stop that slips past entry still counts at its actual fill.
Trading futures and other leveraged products carries substantial risk, and losses can exceed what you planned when stops slip or prices gap. The study figures in this guide describe one historical sample under stated assumptions and do not predict future results. Evaluation and funded prop accounts are simulated trading accounts. This is general education, not financial advice.


