



TL;DR: Stop loss orders and placement start with the price that proves your trade wrong, then size the position to that distance. A stop guarantees an exit once triggered, not the price you get. On 10 years of E-mini S&P 500 data, a stop half a daily ATR from the open was touched on 38.3% of sessions. At 1.5 ATR it was touched on 5.7%, so distance buys survival at a steep dollar cost.
A stop loss order is the one part of a trade plan that has to work when you are least able to think. It is also the part most traders set by habit. A round 10 points, a tick under the last low, or whatever distance makes the size feel comfortable.
Habit stops fail in two ways. They sit inside normal noise and get taken out by moves that mean nothing, or they sit at a level that never proved anything and protect a trade idea that was already gone. This guide covers what stop loss orders actually do, the order types, the placement methods, and the measured cost of each distance on the E-mini S&P 500 futures contract, so the stop you place is one you chose on purpose and can afford.
How Stop Loss Orders Work Before Any Placement Decision
A stop loss order is an instruction to exit a position once price reaches a level you name, called the stop price. The SEC's investor education site, Investor.gov, defines a stop order as an order that becomes a market order once the stop price is reached, and adds that the execution price may differ from the stop price, especially in a fast-moving market.
That definition holds two separate promises. A stop loss promises you will be taken out of the trade once price trades at your level. It does not promise the price you get. Every placement decision in this guide follows from that split.
The side of the order depends on the position:
- A long position uses a sell stop placed below the current price.
- A short position uses a buy stop placed above the current price.
- The same order type used to enter a breakout (a buy stop above resistance) is an entry stop, not a stop loss, even though the mechanics match.
What happens when a stop loss is hit
When price trades at or through a stop loss, the order is triggered and sent to the market. A plain stop then fills at the best price available, which can be your stop price, a few ticks worse, or much worse if price is moving fast or opens past your level. A stop-limit becomes a limit order instead, which protects the price but may not fill at all.
After the fill, the position is closed and the loss is realized. Any linked target order in a bracket should cancel. Check that it did, because cancellation is not always instant.
Related lesson: Stop orders
Types of Stop Loss Orders
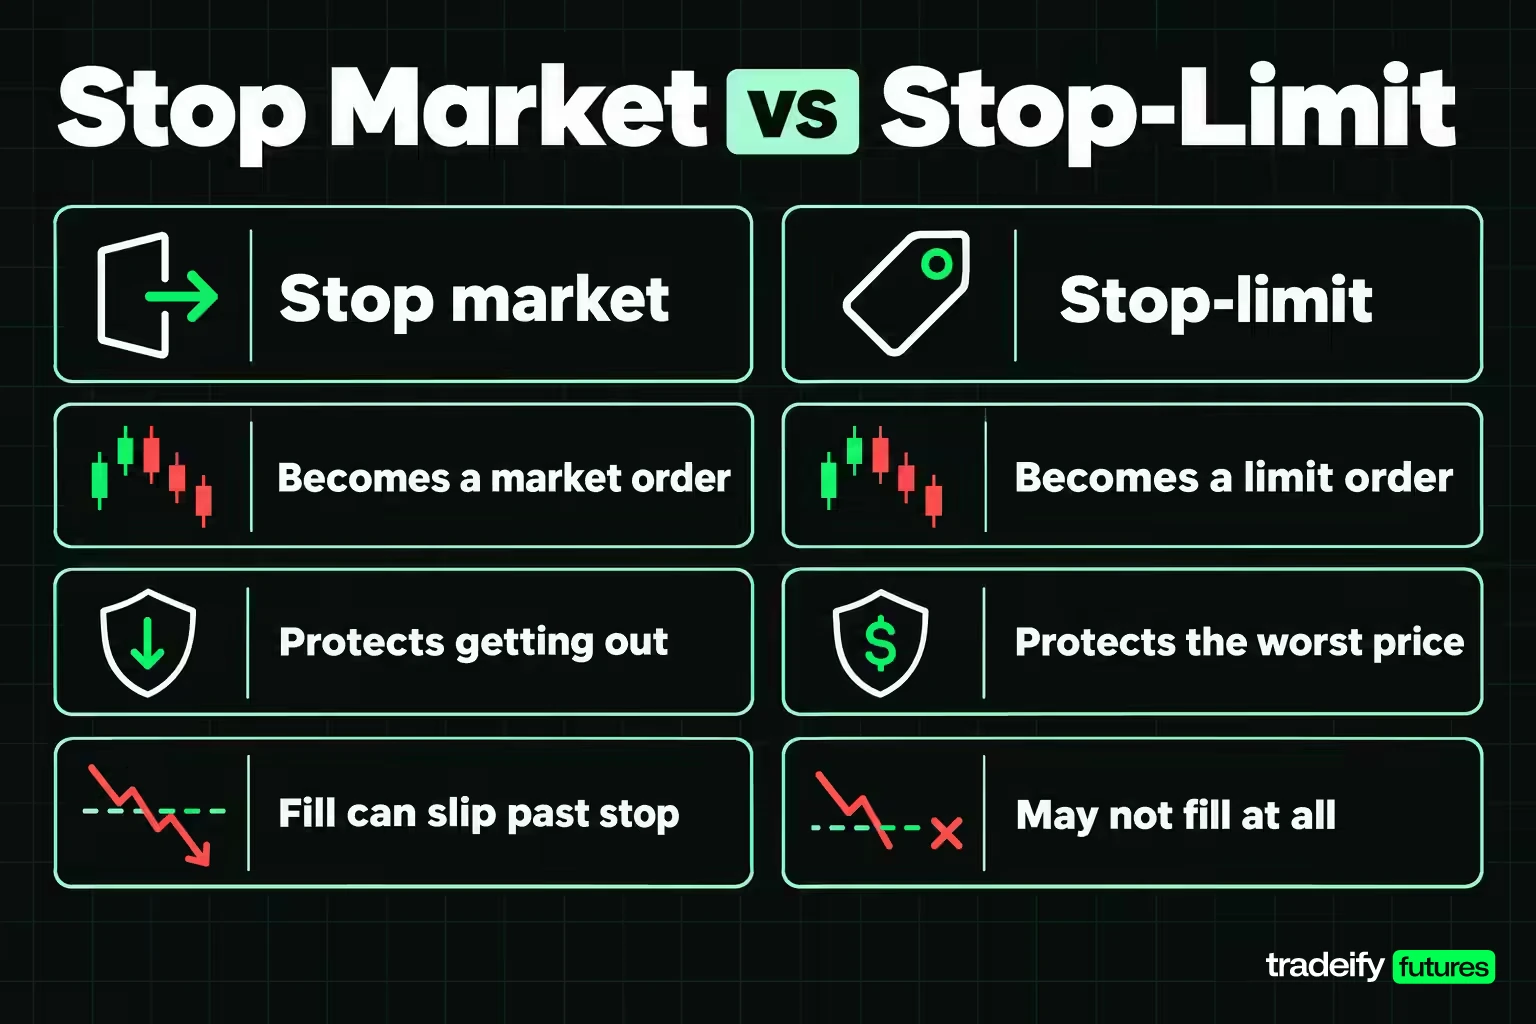
Stop loss orders come in a few forms, and the choice decides whether you are protecting the exit or the price. For a protective stop, the exit almost always matters more.
| Stop order type | What triggers it | What it becomes | What it protects | Main risk |
|---|---|---|---|---|
| Stop market (sell stop or buy stop) | A trade at or through the stop price | Market order | Getting out | Fill can be well past the stop in a fast market or gap |
| Stop-limit | A trade at or through the stop price | Limit order at your limit price | The worst price you accept | No fill if price jumps past the limit, so the position stays open |
| Stop with protection (CME Globex) | A trade at or through the trigger price | Order that fills only within a protection range | Getting out without an extreme fill | Unfilled quantity rests at the protection limit |
| Trailing stop | Price reversing by a set distance from its best level | Stop order that follows price | Open profit | Trails too tightly and exits on normal pullbacks |
Stop market orders
A stop market order is the default protective stop on most futures platforms. Once triggered it takes whatever liquidity is available. In a normal session on a liquid contract the difference between stop price and fill is often a tick or two. In a news spike or a gap it can be many points.
Stop-limit orders
A stop-limit sets two prices: the trigger and the worst acceptable fill. Robinhood's help page on stop limit orders gives the practical failure plainly. If the market jumps between the stop price and the limit price, the stop triggers but the limit order is not executed. For a protective stop, that leaves you holding the position you wanted to exit, at a worse price than your stop.
Stop orders with protection on CME Globex
CME Group's client systems documentation describes two stop types on its Globex platform: the stop-limit and the stop with protection. A stop with protection is triggered when the market trades at or through the trigger price and can only fill within a protection range around it. If it cannot fully fill inside that range, the unfilled quantity rests on the book at the protection price limit.
In practice a futures platform may hold your stop on its own servers or send it to the exchange, depending on the broker and the order type. Ask how yours works, because it changes what happens if your connection drops.
Order duration
Stops also carry a time in force. A day order expires at the end of the session; a good-til-canceled (GTC) order stays live until filled or cancelled. Robinhood Legend, for example, defaults stock orders to good-for-day. A stop that expired at yesterday's close is the most common reason a trader thinks a position is protected when it is not.
Related lesson: Stop-limit orders
Stop Loss Advantages and Disadvantages
Stop loss advantages are mostly behavioral. Stop loss disadvantages are mostly about the fill.
| Stop loss advantages | Stop loss disadvantages |
|---|---|
| The maximum planned loss is set before emotion arrives | The fill can be worse than the stop price in fast markets |
| You do not need to watch every tick | A short-lived swing can trigger the stop before price recovers |
| Position size can be calculated from a known distance | A stop-limit can fail to fill and leave the position open |
| It removes the decision to exit from the worst moment | Stops at obvious levels sit where many other stops sit |
| It turns a vague plan into an order the platform enforces | A day order can expire and leave the position unprotected |
The trade-off Investor.gov names is real. A stop sale "could be activated by a short-term fluctuation" in price. Robinhood's stop order page says the same thing in broker language: volatile conditions can trigger a stop and the price may later return to its prior level during the same day.
That is not an argument against stops. It is an argument for placing them where a short-term fluctuation does not reach, and for sizing the position so that distance is affordable. A trade without a stop does not avoid the downside. It moves the exit decision to the moment you are losing money, watching the number grow, and least likely to decide well.
Stop Loss Placement Strategies That Start From Invalidation
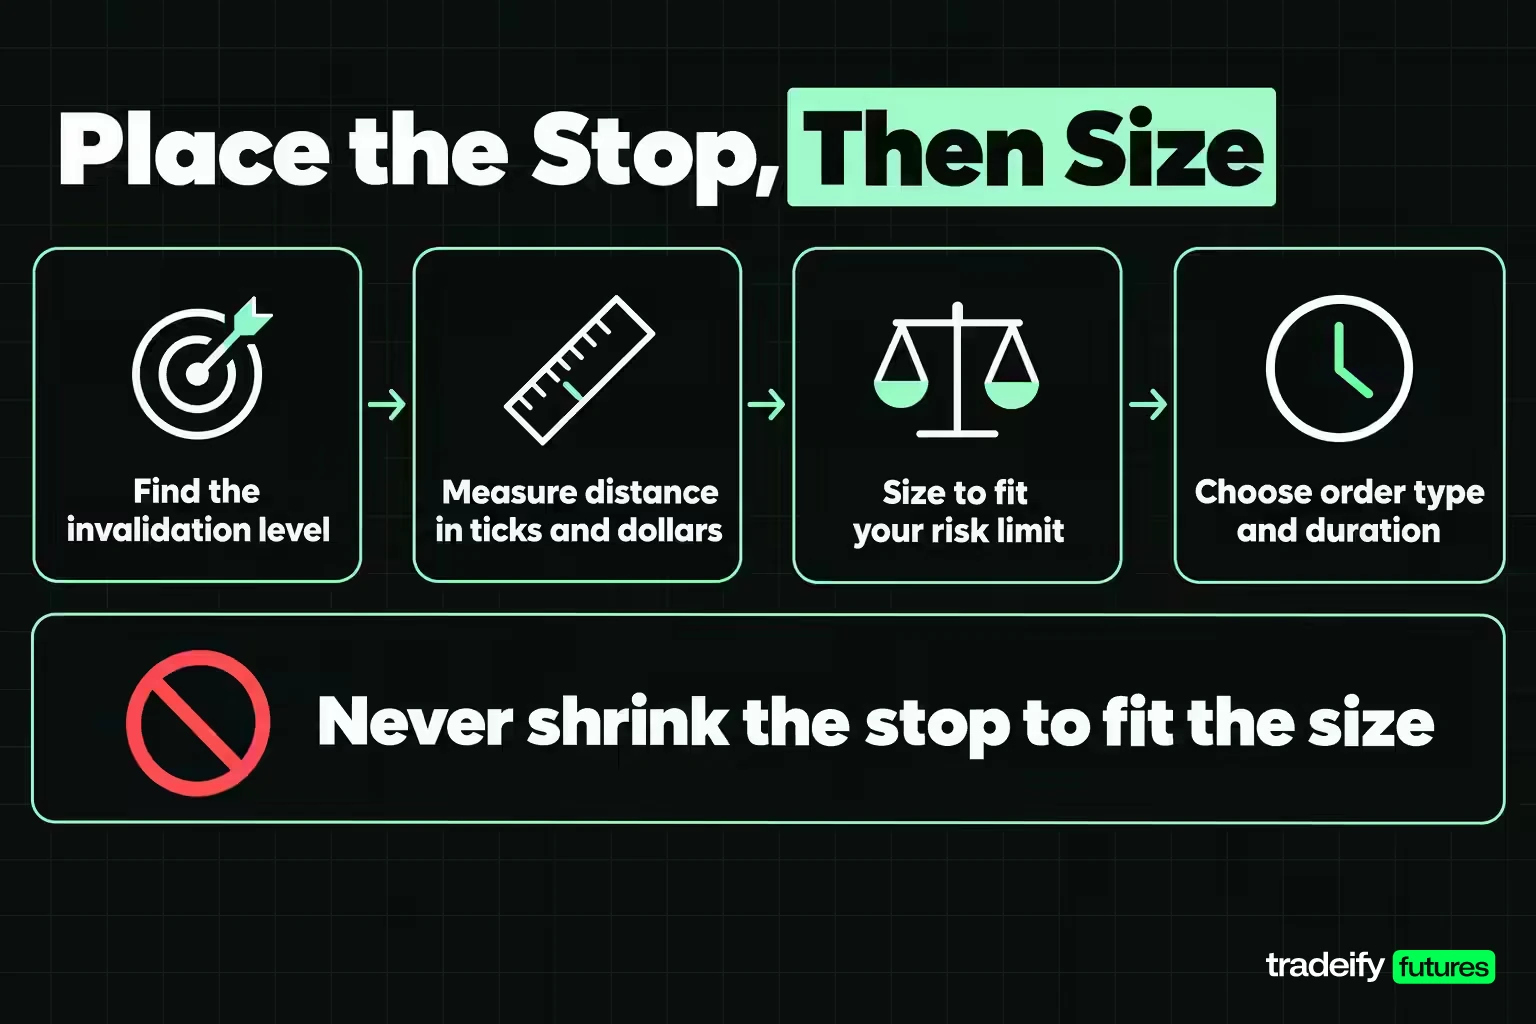
Stop loss placement works best as a fixed order of four decisions:
- Find the price that proves the trade idea wrong (the invalidation level).
- Measure the distance from entry to that level in ticks and dollars.
- Size the position so that distance fits your risk limit.
- Choose the order type and duration.
Reversing steps 1 and 3 produces the most common placement error: a stop chosen to fit the position rather than a position chosen to fit the stop. If the invalidation level is 40 points away and the account can afford 20, the answer is a smaller size or no trade, not a 20-point stop.
Structure-based stop placement at swing lows
A structure stop goes beyond a swing low for a long, or a swing high for a short, because a break of that level is what would prove the idea wrong. The weakness is that everyone can see the same low.
To put a number on it, this guide measured the continuous front-month E-mini S&P 500 futures (ES) daily bars published by Yahoo Finance, from November 2016 to November 4, 2026. On 2,453 sessions (quarterly roll sessions excluded), the session low traded below the prior day's low on 1,063 of them, 43.3%. On 591 of those, 55.6%, the session still closed back above the prior day's low.
In that Yahoo Finance ES data, a sell stop resting a tick under yesterday's low was taken out on about two sessions in five, and on more than half of those occasions the market recovered by the close. Adding a buffer of a quarter of the 20-day average true range (ATR) below the low cut the touch rate to 28.5%. Half an ATR cut it to 16.4%.
A structure stop needs a volatility buffer. "Just under the low" is where a level is most crowded, not where an idea is most clearly wrong.
Percentage-based stop placement
A percentage stop exits a fixed share below entry, such as 2% or 7%. It is simple and comes from stock investing, where a fixed percentage caps the damage on any one holding. Its weakness is that it ignores both structure and volatility. Seven percent of an index level near 7,700 is about 539 points, several times the E-mini S&P 500's typical daily range, so a percentage carried over from stocks often fits futures badly.
Volatility-based stop placement
A volatility stop sets the distance as a multiple of a volatility measure, most often the ATR. It adjusts automatically: wider in volatile markets and tighter in quiet ones. Its weakness is that it knows nothing about where the trade idea fails, so it works best as a buffer added to a structure level rather than a replacement for one.
Time-based stops
A time stop exits a trade that has not moved as expected within a set number of bars or minutes, even if the price stop was never touched. It addresses a separate problem: capital and attention tied up in a trade whose reason has expired.
Related lesson: Liquidity sweeps and stop runs
Technical Indicators for Stop Loss Placement
Technical indicators give stop loss placement a repeatable rule. Each one resolves into a price level, and that level still has to be converted into a distance you can price.
| Indicator | How the stop level is set | What it handles well | What it ignores |
|---|---|---|---|
| Average true range (ATR) | Entry minus a multiple of ATR for a long | Current volatility | Chart structure |
| Moving average | Beyond a chosen moving average | Trend direction | Volatility around the average |
| Parabolic SAR | At the indicator's dot, which tightens as the trend ages | Trailing in a trend | Ranging markets, where it flips often |
| Swing high or low channel | Beyond the lowest low or highest high of the last N bars | Structure in plain numbers | Volatility buffer beyond the level |
ATR-based stop loss placement
The ATR is the average of the true range over a lookback period, where true range is the largest of the bar's high minus low, high minus prior close, and prior close minus low. A 1.5 ATR stop on a long sits 1.5 times that average below the entry.
On ES, one tick is 0.25 index points and is worth $12.50, because the contract is $50 times the S&P 500 Index. The Micro E-mini S&P 500 (MES) is $5 times the index, so its 0.25-point tick is worth $1.25. Every ATR multiple should be rounded to a whole number of ticks and converted into dollars before it becomes a stop.
Moving average and Parabolic SAR stops
A moving average stop is a trend rule: the trade is wrong once price closes on the other side of the average. It suits trend-following entries and can sit a long way from a short-term entry. The Parabolic SAR moves closer to price as a trend extends, which makes it a trailing tool more than an initial stop.
Choosing between indicator stops
No indicator stop is correct in the abstract. The right one is the one whose failure condition matches the trade idea: a structure channel for a breakout, a moving average for a trend trade, an ATR buffer for anything whose obvious level is crowded.
Related lesson: Average true range
Stop Distance Measured on 10 Years of E-mini S&P 500 Data
Stop distance is the number that decides whether a stop survives ordinary noise, so this section measures it rather than describing it. The data is the Yahoo Finance continuous front-month ES series, read November 4, 2026, and every figure was calculated for this guide from those bars.
Daily stop distance and touch rates
Method: 2,493 daily sessions from December 8, 2016 to November 4, 2026. The ATR is the simple average of the last 20 true ranges, known at the prior close. A long is entered at the session open with a stop that many ATRs below; it counts as touched if the session low reaches it. Short stops are mirrored above the open. Dollar figures use the sample's median ATR of 55.70 points, rounded down to the 0.25-point tick.
| ATR multiple | Distance at median ATR | Ticks | Risk on one ES | Risk on one MES | Long stop touched | Short stop touched |
|---|---|---|---|---|---|---|
| 0.5 | 27.75 points | 111 | $1,387.50 | $138.75 | 38.3% | 41.1% |
| 0.75 | 41.75 points | 167 | $2,087.50 | $208.75 | 23.1% | 22.9% |
| 1.0 | 55.50 points | 222 | $2,775.00 | $277.50 | 14.1% | 11.6% |
| 1.5 | 83.50 points | 334 | $4,175.00 | $417.50 | 5.7% | 2.7% |
| 2.0 | 111.25 points | 445 | $5,562.50 | $556.25 | 2.1% | 0.7% |
| 3.0 | 167.00 points | 668 | $8,350.00 | $835.00 | 0.4% | 1 session |
In this Yahoo Finance ES sample, going from half an ATR to 1.5 ATR cuts the long touch rate from 38.3% to 5.7%, for 55.75 more points of risk per contract. Going from 1.5 to 2 ATR adds 27.75 points to remove most of the remaining touches. There is no distance where a stop cannot be hit. The real question is how much you will pay to avoid each share of touches.
Long stops were touched more often than short stops at every distance from 1 ATR outward. Down moves in this sample were sharper than up moves, which is a property of the decade measured, not a law.
Intraday stop distance on 5-minute bars
Daily ATR stops are wide for a day trader. The same test on ES 5-minute bars uses 3,090 entries across 47 sessions from August 27 to November 4, 2026: an entry at the open of every 5-minute bar from 9:30 AM to 2:55 PM ET, a stop placed a multiple of the 14-bar ATR away, and a one-hour window to touch it. The median 5-minute ATR was 6.07 points.
| 5-minute ATR multiple | Distance at median | Ticks | Risk on one ES | Risk on one MES | Long stop touched within 60 minutes | Short stop touched within 60 minutes |
|---|---|---|---|---|---|---|
| 1 | 6.00 points | 24 | $300.00 | $30.00 | 65.5% | 58.9% |
| 2 | 12.00 points | 48 | $600.00 | $60.00 | 34.6% | 31.0% |
| 3 | 18.00 points | 72 | $900.00 | $90.00 | 18.3% | 15.2% |
| 4 | 24.25 points | 97 | $1,212.50 | $121.25 | 9.8% | 7.7% |
In this guide's test of Yahoo Finance ES 5-minute bars, a one-ATR intraday stop was touched within an hour about two times in three. That stop is not measuring whether the idea was wrong. It is measuring whether the next hour had a normal wiggle, and it usually did. The 47-session sample is short and recent, so read it as a guide to scale, not a stable rate.
Adverse and favorable excursion from the open
Excursion is how far a session travels against an entry (adverse) and in its favor (favorable). This guide measured it in daily ATRs for a long taken at the open over the same 2,493 Yahoo Finance ES sessions.
| Percentile | Adverse excursion in ATR | Favorable excursion in ATR |
|---|---|---|
| 50th | 0.36 | 0.40 |
| 75th | 0.70 | 0.71 |
| 90th | 1.16 | 1.05 |
| 95th | 1.55 | 1.26 |
| 99th | 2.49 | 1.83 |
The median session is roughly balanced. The tails are not. At the 95th percentile, adverse travel was 1.55 ATR against 1.26 favorable; at the 99th, 2.49 against 1.83. A stop set at the median adverse excursion sits inside ordinary noise by design, and a target that assumes the favorable tail matches the adverse tail is optimistic exactly where it matters.
Adjusting Stop Placement for Market Conditions
Stop placement that worked last quarter can be wrong this quarter because the market's range changes underneath it. Fixed point stops are the most exposed.
The median 20-day ATR on ES was 15.96 points in 2017 and 87.04 points in 2026 through November 4. A 20-point stop that sat beyond a full day's typical range in 2017 is a fraction of a typical day now. As of November 4, 2026 the 20-day ATR was 97.35 points. Re-measure the distance whenever volatility changes, not just when the plan changes.
Trending versus ranging markets
In a trend, pullbacks tend to hold above prior swing lows, so structure stops beyond those lows and trailing stops both have room to work. In a range, price repeatedly tests both edges and often probes past them, so a stop just outside the range edge is exposed to the same false breaks that define the range. Range stops usually need a wider buffer beyond the edge, or a smaller position.
Stop placement in the opening hour
This guide's study of Yahoo Finance ES 5-minute bars from August 27 to November 4, 2026, split by time of day, shows how a lagging ATR understates risk at the open. With a 2 ATR stop and a one-hour window, long stops placed between 9:30 AM and 10:25 AM ET were touched 47.7% of the time, against 29.6% between 10:30 AM and 12:55 PM and 34.2% between 1:00 PM and 2:55 PM. The ATR going into the open is built from the quieter overnight bars, so the same multiple means less real room right when volatility is highest.
Related lesson: Volatility-based position sizing
When a Stop Loss Order Fills Past Its Price
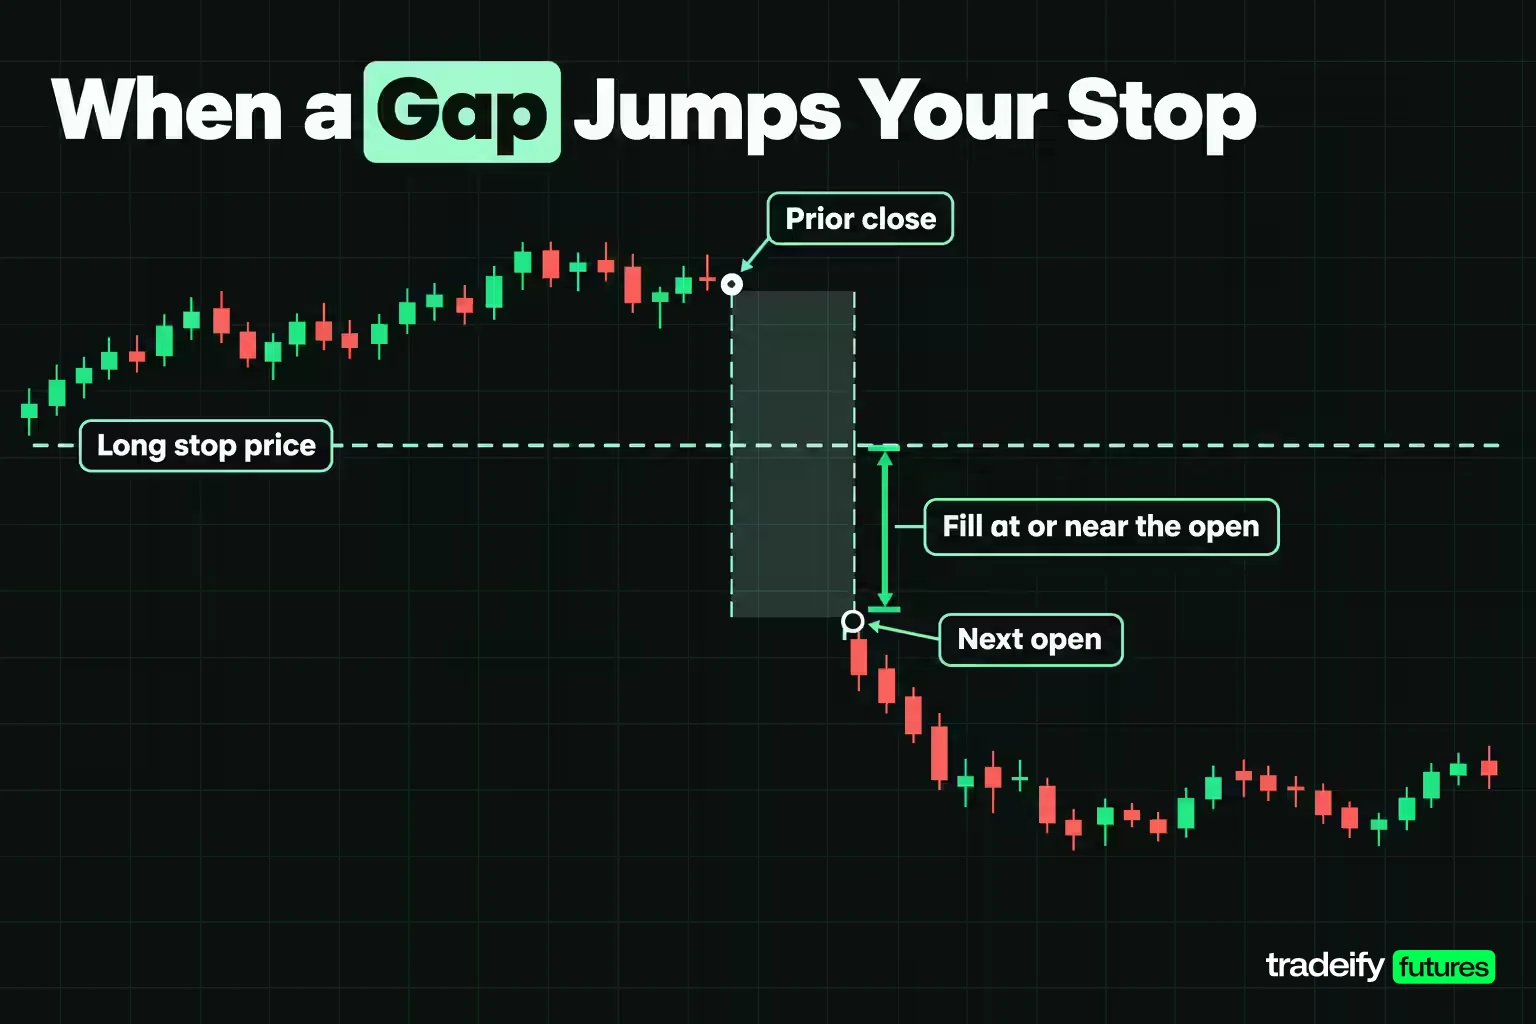
A stop loss order fills past its price whenever the market moves through the level faster than resting orders can absorb it, or when the market opens beyond it. Intraday, that usually means a few ticks of slippage. Across a gap it can mean much more.
A stop resting overnight cannot fill at a price the market never traded. If the close is on one side and the next open is on the other, a stop market order fills at or near the open. This guide counted those gap-throughs on Yahoo Finance's continuous ES daily bars from December 2016 to November 4, 2026.
| Long stop distance below prior close | Sessions that opened past the stop | Share of 2,453 sessions | Worst open past the stop |
|---|---|---|---|
| 0.5 ATR | 31 | 1.26% | 105.25 points |
| 0.75 ATR | 11 | 0.45% | 77.00 points |
| 1.0 ATR | 4 | 0.16% | 48.75 points |
| 1.5 ATR or wider | 0 | 0% | None in the sample |
The worst case in each row was the same session. ES closed at 5,712.25 on April 2, 2025 and opened at 5,550.50 on April 3, 2025. A stop half an ATR below that close sat 56.50 points under it, about $2,825.00 per ES contract of planned risk. The open was 105.25 points past the stop, a loss of $8,087.50 per contract from the close, or 2.86 times the planned risk. Quarterly roll sessions were excluded because the continuous series jumps between contract months on those days.
Daily bars show that gap-throughs exist and how far the open ran. They do not show the exact fill an order would have received, so treat these as counts and worst cases, not an average slippage budget.
A stop with protection or a stop-limit narrows the fill range but replaces slippage with the risk of no fill. Neither one removes gap risk. Only a smaller position, a wider distance, or being flat before the gap does that.
Related lesson: Trading halts and circuit breakers
Stop Loss Risk Management and Position Sizing
Stop loss risk management is the step that turns a placement into a trade you can afford. The formula is short: contracts = risk cap divided by (stop distance in ticks times tick value), rounded down.
Worked example with a daily ATR stop
Take an illustrative long at 7,700.00 on ES with the 20-day ATR at 97.35 points, its value as of November 4, 2026. A 1.5 ATR stop is 146.025 points, which rounds down to 146.00 points or 584 ticks, putting the stop at 7,554.00.
- Risk on one ES: 584 ticks times $12.50 = $7,300.00.
- Risk on one MES: 584 ticks times $1.25 = $730.00.
- A 1% cap on a $50,000 account is $500.00, which funds zero contracts of either.
A daily-ATR stop on ES at today's volatility needs a large account or a different timeframe. Forcing it into a small account by trading one MES anyway means risking 1.46% instead of 1%, and that is how fixed contract counts drift above plan.
Worked example with an intraday stop
Now an illustrative intraday long at 7,700.00 with the 5-minute ATR at the sample median of 6.07 points. A 2 ATR stop is 12.14 points, rounding down to 12.00 points or 48 ticks, so the stop sits at 7,688.00.
- Risk on one MES: 48 ticks times $1.25 = $60.00.
- Risk on one ES: 48 ticks times $12.50 = $600.00.
- The $500.00 cap funds 8 MES ($480.00, or 0.96%) and no ES.
- A 2-to-1 target from that stop sits at 7,724.00.
The stop came first and the size followed. If the chart had put invalidation 30 points away instead of 12, the same cap would have funded 3 MES, and that would have been the right size, not a reason to tighten the stop.
Stop size and a drawdown limit
The same arithmetic applies to any account with a hard loss limit. With an illustrative $3,000 drawdown limit, a $480.00 loss per trade allows six consecutive full losses before the limit is close. Doubling the size to fit a wider stop halves that count. The stop distance, the size and the loss limit have to agree before entry.
As for the question of how much day traders with $100,000 accounts make per day, there is no reliable published average, and any single figure hides the losing days. What can be planned is the loss per trade, which is exactly what a priced stop controls.
Related lesson: Position sizing
Trailing Stops and Break-Even Stops After Entry
Trailing stops and break-even stops change the stop after entry. Both can protect open profit, and both can cut a working trade short.
Trailing stop strategies
A trailing stop follows price at a set distance as the trade moves in your favor and never moves back. Common versions trail by a fixed number of ticks, by an ATR multiple, or behind each new swing low. The trailing distance should be at least as wide as the initial stop's noise buffer. A trail tighter than the noise exits on ordinary pullbacks inside a trend that is still intact.
Break-even stop techniques
A break-even stop moves the stop to the entry price after the trade has moved a set distance in your favor. It removes the planned loss on that trade but adds a new problem. In the daily ES sample, the median session moved only 0.36 ATR against a long from the open, so moving to break-even after a small favorable move puts the stop back inside routine noise.
A workable rule is to move to break-even only after price has moved at least as far as the original stop distance, or after a structure change such as a new higher low. Write the trigger down before entry so the move is a rule, not a reaction.
Related lesson: Trailing stops
Pairing a Stop Loss With a Take Profit Order
Pairing a stop loss with a take profit order creates a bracket: two exit orders linked so that when one fills, the other cancels (OCO, one-cancels-the-other). It completes the trade plan in the order book rather than in your head.
Robinhood's take profit / stop loss order for stocks and ETFs is a typical example. Both orders are live at once with the same quantity, and when one fully fills the other is cancelled. Its help page also flags the edge case: cancellation is not instantaneous, so in fast markets both orders may execute, closing more than intended or opening a position in the opposite direction. That order type is not available there for futures.
Futures platforms usually build the bracket at entry. The entry order carries a stop and a target that are placed automatically when the entry fills. Check three things on any bracket:
- The stop is a stop market or stop with protection, not a stop-limit that may not fill.
- Partial fills resize both legs.
- The bracket survives a disconnect, either because it is held on the broker's or exchange's servers or because you know it is not.
Related lesson: Bracket orders
Common Stop Loss Mistakes
Common stop loss mistakes look correct on paper and fail in the account.
| Stop loss mistake | Why it fails | Fix |
|---|---|---|
| Stop one tick beyond an obvious low or round number | The level is crowded and often probed | Add an ATR buffer beyond the level |
| Stop sized to the account instead of the idea | The stop sits inside noise and gets touched | Find invalidation first, then reduce size |
| Widening the stop after entry | A defined loss becomes an open one | Move stops only toward profit, by a written rule |
| Moving to break-even too early | Routine noise takes out a working trade | Wait for a move at least equal to the original stop |
| Stop-limit used as a protective stop | It may not fill in a fast move | Use a stop market or stop with protection |
| Fixed point stop kept through a volatility change | Distance no longer matches the market | Re-measure the ATR before each session |
| Day order on a position held past the session | The stop expires and the position is unprotected | Check time in force on every working stop |
| Stop drawn on a chart but never sent | It exists only in your software | Confirm the working order in the order list |
Recovering after a stop loss
Recovering lost money in trading starts with not trying to win it back on the next trade. A stopped-out trade is the plan working. The damage usually comes from what follows it, such as a bigger size, a tighter stop or a setup forced because you want the money back today. Keep the same risk per trade, review whether the stop was placed at invalidation or at comfort, and let a normal sample of trades decide whether the method needs changing.
Stop Placement Under a Daily Loss Limit or Trailing Drawdown
Stop placement on an evaluation or funded account has one more constraint: the account's own loss limits. A typical firm's daily loss limit or trailing drawdown is a hard line, and touching it ends the day or the account regardless of where your trade stop was.
Three rules follow. Size every trade so that its stop sits well inside the remaining daily loss allowance, not at its edge. Count the stop's realistic fill, not the stop price, because slippage counts against the limit too. Never treat the account's loss limit as the stop; it is a backstop, and a trade that reaches it was sized wrong.
On our accounts, the order types in this guide (stop, stop-limit, trailing stop and OCO brackets) are covered in our Help Center's order types guide. Tradovate ATM strategies place a stop and target automatically after the entry fills, and R Trader Pro keeps stops and brackets on Rithmic's servers if your internet drops. Brackets are not supported while Group Trading on Tradovate. All positions must be closed by 4:45 PM ET, so an overnight gap past a resting stop is not a scenario on our accounts, but a fast intraday move still is. News trading is allowed at your own risk, and the daily loss limit should never be used as a stop.
Stop Loss Orders and Placement FAQ
What is the meaning of a stop loss order?
A stop loss order is an instruction to exit a position once price reaches a stop price you set. When that price trades, the order becomes a market order, or a limit order for a stop-limit. Its purpose is to cap the loss on a trade before emotion gets a vote.
What happens when a stop loss is hit?
The stop triggers and the position is closed at the next available price. That fill can be at the stop or worse, especially in fast markets or across a gap. Any linked take profit order should cancel automatically.
What is a stop loss order on Robinhood?
On Robinhood, a stop order for stocks and ETFs triggers a market order when the stock reaches your stop price, executed during market hours only. Robinhood notes that the execution price may be very different from the stop price in volatile markets. It also offers stop limit orders and a combined take profit / stop loss order.
Does a stop loss guarantee a limited loss?
No. A stop loss guarantees an exit order once triggered, not the exit price. In this guide's study of Yahoo Finance ES daily bars, a stop half an ATR below the prior close was jumped by the next open on 1.26% of sessions, and the worst opened 105.25 points past the stop.
Where should I place my stop loss?
Place it beyond the price that proves the trade idea wrong, plus a buffer for normal volatility, then size the position to that distance. If the distance is too large for your risk limit, trade smaller or skip the trade.
Should I move my stop loss after entering a trade?
Only toward profit and only by a rule written before entry, such as trailing behind new swing lows. Moving a stop away from price turns a defined loss into an open-ended one.
How do I recover lost money in trading?
Keep risk per trade unchanged, review whether losing stops were placed at invalidation or at comfort, and let a meaningful sample of trades judge the method. Raising size to recover faster is how a normal losing streak becomes an account-ending one.
Risk note: This article is educational and is not investment advice. Futures are leveraged, and losses can exceed what you expect, including through slippage and gaps past a stop. The measurements here describe historical E-mini S&P 500 data and do not predict future results. Evaluation and funded accounts are simulated, and results in them do not guarantee results in a live account.


