




TL;DR: A futures breakeven calculator divides your round-trip cost by tick value to show how many ticks a trade must move to pay for itself. At an illustrative $1.50, MES needs 1.2 ticks and MNQ needs 3, while a $5.00 ES round trip needs 0.4. A cost worth 7.5% of risk lifts the win rate a 1.5-to-1 trade needs from 40.0% to 43.0%. Size never dilutes a per-contract fee, and at those rates ten micros cost three times one mini of equal exposure.
Every futures trade starts in the red. Before the market moves a single tick, you have paid a commission, exchange and clearing fees and a regulatory fee, and you will pay them again on the way out. A futures breakeven calculator answers one narrow question: how far does price have to move from your fill before that cost is covered?
The answer is usually a fraction of a point. That sounds harmless until you put it next to the stop you actually trade. On a tight stop, a fraction of a point can be a meaningful slice of your risk, and it quietly raises the win rate your strategy needs.
This guide works through the math by hand so you can check any calculator's output, then shows where breakeven changes real decisions: stop placement, position size, micro versus mini, and prop-account rules.
How a Futures Breakeven Calculator Works

A futures breakeven calculator needs three inputs: your all-in round-trip cost per contract in dollars, the contract's tick value, and the contract's tick size. A good one also asks for your stop distance, because that is where the cost turns into a decision.
The math is two lines.
- Breakeven in ticks = round-trip cost per contract ÷ tick value.
- Breakeven in price = breakeven ticks × tick size, added to your entry for a long and subtracted for a short.
Take an illustrative all-in cost of $1.50 per round trip on a Micro E-mini S&P 500 (MES) contract. The MES tick is 0.25 index points, worth $1.25. So $1.50 ÷ $1.25 = 1.2 ticks, and 1.2 × 0.25 = 0.30 points. A long entered at 7,000.00 breaks even at 7,000.30.
A profit and loss calculator does not show you this. It takes an entry, an exit and a size and tells you what the move was worth, usually before costs. Breakeven works the other way round: it tells you how much of the move belongs to your costs before any of it belongs to you.
Related lesson: Converting ticks and points into a dollar result
Futures Profit and Loss Before and After Costs
Futures profit and loss starts with the gross figure and then subtracts costs to reach net.
- Gross P&L for a long = (exit price − entry price) × multiplier × contracts.
- Gross P&L for a short = (entry price − exit price) × multiplier × contracts.
- Net P&L = gross P&L − (round-trip cost per contract × contracts).
The examples below use round prices and the illustrative cost schedule in this guide: $1.50 per round trip on a micro contract and $5.00 on a full-size or E-mini contract. Those are assumptions for the arithmetic, not any broker's published rates.
Worked futures P&L examples
A long position of 2 MES contracts bought at 7,000.00 and sold at 7,012.50 gains 12.50 points. At $5 per point that is 12.50 × $5 × 2 = $125.00 gross. Costs are 2 × $1.50 = $3.00, so net P&L is $122.00.
A short position of 1 Light Sweet Crude Oil (CL) contract sold at $70.00 and bought back at $69.60 gains $0.40 per barrel. CL covers 1,000 barrels, so gross P&L is $400.00. After a $5.00 round trip, net P&L is $395.00.
Losses work the same way, and cost makes them bigger. A long E-mini Nasdaq-100 (NQ) contract bought at 25,000.00 and stopped at 24,990.00 loses 10 points × $20 = $200 gross. Add the $5.00 round trip and the net loss is $205.
That last line is the one that gets forgotten. Cost is paid on winners and losers alike, so it shrinks every win and enlarges every loss. A journal that records only gross P&L will always flatter the strategy.
Contract Multiplier and Point Value in Breakeven Math
The contract multiplier is the number that converts a one-point price move into dollars. For an index future it is a dollar amount per index point. For a physical commodity it is the contract size, such as 1,000 barrels of crude oil or 100 troy ounces of gold.
Point value is the dollar result of a one-point move for one contract. On E-mini S&P 500 (ES), the multiplier is $50 × the S&P 500 Index, so a one-point move is worth $50. On MES it is $5. On NQ it is $20, and on Micro E-mini Nasdaq-100 (MNQ) it is $2.
The multiplier is why the same dollar cost becomes a different price distance on different contracts. A $5.00 round trip on ES is 0.10 points of price. The same $5.00 on MES would be 1.00 point, because each point is worth one tenth as much.
When a breakeven figure looks wrong, the multiplier is usually the culprit. Check it on the exchange's contract specification before you trust any calculator, especially on contracts whose price is quoted in cents, 32nds or fractions.
Related lesson: What each field on a contract specification means
Tick Size and Tick Value Set the Breakeven Distance
Tick size is the smallest price increment a contract can trade in. Tick value is what one tick is worth in dollars for one contract. They are linked by one formula: tick value = multiplier × tick size.
On ES the tick is 0.25 index points, so 0.25 × $50 = $12.50. On CL the tick is $0.01 per barrel, so $0.01 × 1,000 = $10.00. On Micro Gold (MGC) the tick is $0.10 per troy ounce on 10 ounces, so the tick value is $1.00.
Breakeven is measured in ticks because a stop, a target and a fill all land on whole ticks. That creates a practical wrinkle. A calculator may tell you breakeven is 1.2 ticks, but price can only print at 1 tick or 2 ticks. One tick in your favour still loses money. Two ticks is the first exit that clears the cost.
Fractional breakeven ticks and the first profitable exit
A breakeven figure that lands exactly on a whole tick deserves a second look. With the illustrative $5.00 round trip, NQ breaks even at exactly 1 tick ($5.00 ÷ $5.00). Exiting one tick in your favour returns $0.00 net, a scratch. The first exit that actually pays is 2 ticks.
So the useful output of a breakeven calculation is not just the decimal. It is the first whole tick beyond breakeven, and what that tick pays net. On MNQ with an illustrative $1.50 round trip, breakeven is exactly 3 ticks, so the first paying exit is 4 ticks and it nets $0.50.
Related lesson: The tick value and multiplier reference behind every breakeven figure
Breakeven Table for ES, NQ, CL, GC and Micro Futures
The first table lists the published contract specifications for widely traded CME Group futures, read from CME's contract specification data on November 4, 2026. The second applies the illustrative cost schedule used throughout this guide ($1.50 per micro round trip, $5.00 per full-size or E-mini round trip) so you can see how the same rule produces very different breakeven distances.
| Contract | Symbol | Contract unit | Tick size | Tick value |
|---|---|---|---|---|
| E-mini S&P 500 | ES | $50 × S&P 500 Index | 0.25 index points | $12.50 |
| Micro E-mini S&P 500 | MES | $5 × S&P 500 Index | 0.25 index points | $1.25 |
| E-mini Nasdaq-100 | NQ | $20 × Nasdaq-100 Index | 0.25 index points | $5.00 |
| Micro E-mini Nasdaq-100 | MNQ | $2 × Nasdaq-100 Index | 0.25 index points | $0.50 |
| Light Sweet Crude Oil | CL | 1,000 barrels | $0.01 per barrel | $10.00 |
| Micro WTI Crude Oil | MCL | 100 barrels | $0.01 per barrel | $1.00 |
| Gold | GC | 100 troy ounces | $0.10 per troy ounce | $10.00 |
| Micro Gold | MGC | 10 troy ounces | $0.10 per troy ounce | $1.00 |
| 10-Year T-Note | ZN | $100,000 face value | 1/2 of 1/32 of one point | $15.625 |
| Symbol | Illustrative round trip | Breakeven in ticks | Breakeven in price | First profitable exit | Net at that exit |
|---|---|---|---|---|---|
| ES | $5.00 | 0.4 | 0.10 points | 1 tick | $7.50 |
| MES | $1.50 | 1.2 | 0.30 points | 2 ticks | $1.00 |
| NQ | $5.00 | 1.0 | 0.25 points | 2 ticks | $5.00 |
| MNQ | $1.50 | 3.0 | 0.75 points | 4 ticks | $0.50 |
| CL | $5.00 | 0.5 | $0.005 per barrel | 1 tick | $5.00 |
| MCL | $1.50 | 1.5 | $0.015 per barrel | 2 ticks | $0.50 |
| GC | $5.00 | 0.5 | $0.05 per ounce | 1 tick | $5.00 |
| MGC | $1.50 | 1.5 | $0.15 per ounce | 2 ticks | $0.50 |
| ZN | $5.00 | 0.32 | 0.005 points | 1 tick | $10.625 |
How breakeven distance differs between full-size and micro contracts
With an illustrative $5.00 round trip, full-size contracts such as ES, CL, GC and ZN all clear their cost on the first tick, because their tick values are large next to the bill. With an illustrative $1.50 round trip, the micros need two to four ticks. MNQ is the extreme case: its $0.50 tick means a $1.50 round trip is three full ticks of overhead, and the first profitable exit pays just $0.50.
Same rule, same cost structure, a breakeven that ranges from under half a tick to three ticks. That spread is why a single "breakeven in points" figure from a generic calculator can mislead you. Run the number for the exact contract you trade, with your own cost.
What Goes Into a Futures Round Trip Cost
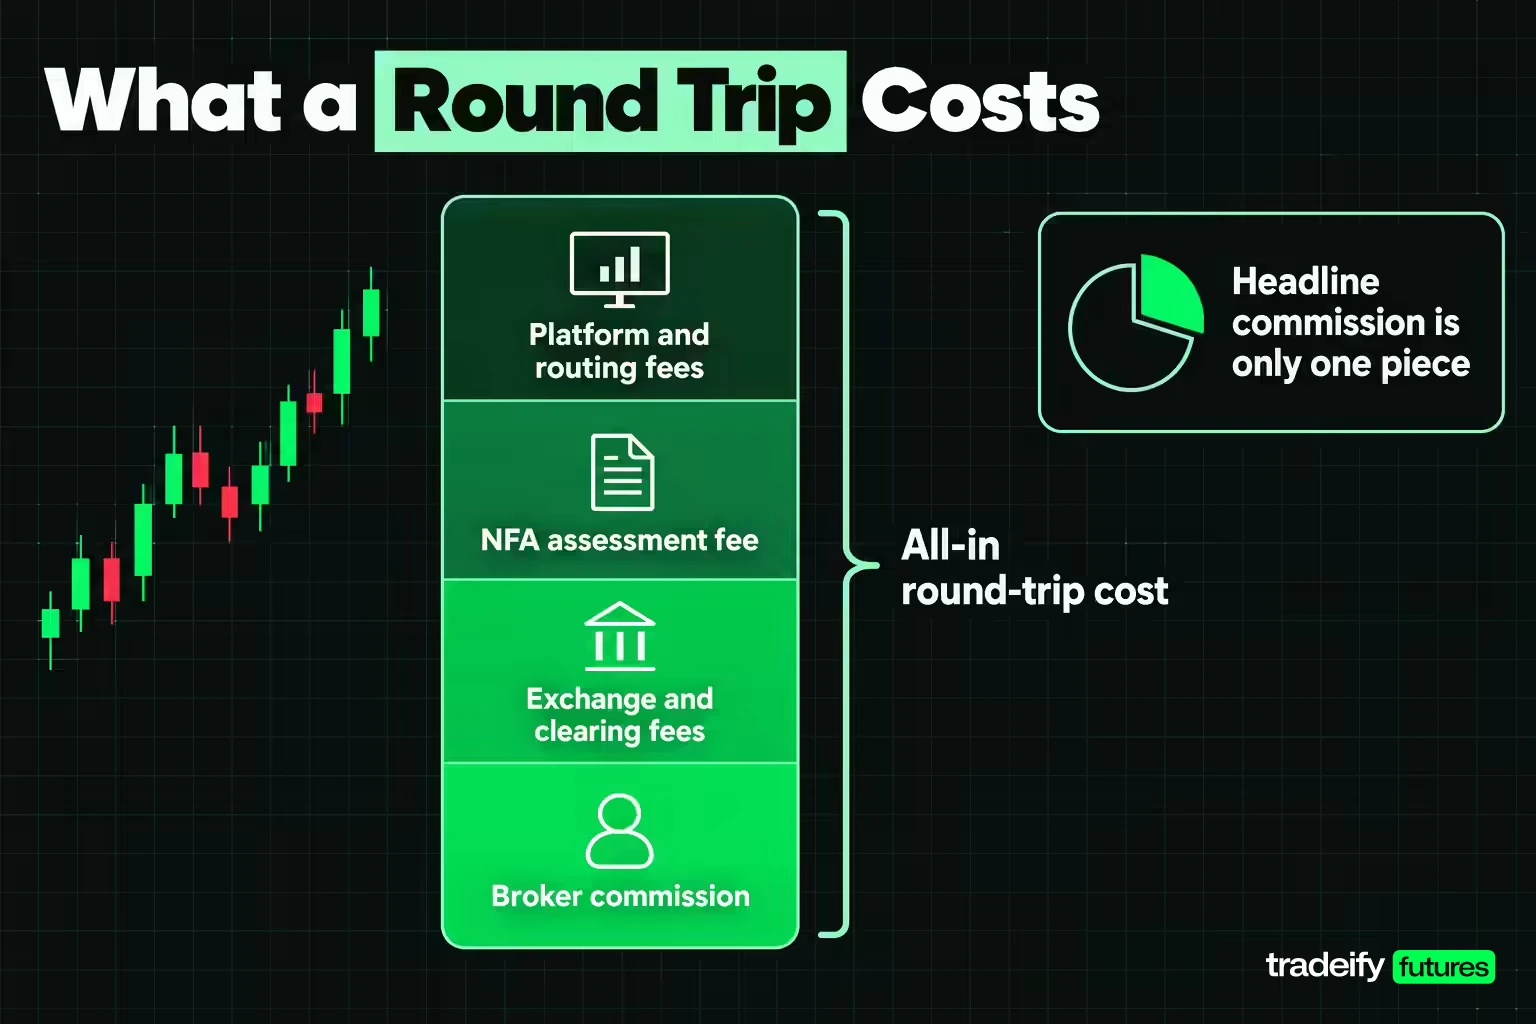
A futures round trip cost is everything you pay to open and close one contract. The breakeven formula is only as good as this input, and most traders underestimate it by using the headline commission alone.
The pieces usually include the following.
- Broker commission. The firm's own charge, quoted per contract per side or per round trip.
- Exchange and clearing fees. CME Group charges these per side per contract. Its fee schedule says the amounts vary with membership or incentive-program status, product, volume, venue and transaction type, so retail traders typically pay the non-member rate passed through by their broker.
- NFA assessment fee. Under NFA Bylaw 1301, FCMs pay $.02 per futures round turn from July 1, 2026 through June 30, 2027, rising to $.04 after that, and the fee is invoiced to customers.
- Platform, routing or data charges. Some are per contract, some per order, some monthly. Monthly charges do not belong in a per-trade breakeven, but per-order and per-contract charges do.
- Slippage. The difference between the price you expected and the price you got. It is not on any fee schedule, but it is a real cost.
Many brokers quote an "all-in" round-trip figure that bundles the first three. If yours does not, add them up yourself before you calculate.
Slippage and the honest breakeven
Stops are usually market orders once triggered, so they can fill a tick or more away from the stop price in a fast market. Adding one tick of slippage to the illustrative costs changes the breakeven a lot on small-tick contracts.
- MES: ($1.50 + $1.25) ÷ $1.25 = 2.2 ticks, up from 1.2.
- ES: ($5.00 + $12.50) ÷ $12.50 = 1.4 ticks, up from 0.4.
A practical approach is to calculate two breakevens: one with fees only, and one with your average slippage from your own fills. If you do not yet have that data, assume one tick on exits and replace it once your journal can tell you the real number.
Per-contract fees versus maker and taker fees
CME-listed futures charge a fixed dollar amount per contract, regardless of the price level. Many crypto derivatives venues instead charge a percentage of notional value, split into a maker rate for orders that add liquidity and a taker rate for orders that remove it. A percentage fee grows as price rises, so its breakeven in ticks moves with the market. A per-contract fee does not. Make sure a calculator's fee input matches the way your venue actually charges.
Breakeven Win Rate After Commissions
Breakeven distance in ticks is abstract. The win rate it forces on you is not.
Without costs, the share of trades you need to win to break even is 1 ÷ (1 + R), where R is your reward multiple. A 1-to-1 trade needs 50%. A 1.5-to-1 trade needs 40%.
Add a round-trip cost equal to C as a share of the amount you risk, and the requirement becomes (1 + C) ÷ (1 + R). The cost is paid on every trade, which is why it shows up on both sides of the math.
| Cost as share of risk | 1 to 1 | 1.5 to 1 | 2 to 1 | 3 to 1 |
|---|---|---|---|---|
| 0% | 50.0% | 40.0% | 33.3% | 25.0% |
| 2.5% | 51.2% | 41.0% | 34.2% | 25.6% |
| 5% | 52.5% | 42.0% | 35.0% | 26.2% |
| 7.5% | 53.8% | 43.0% | 35.8% | 26.9% |
| 10% | 55.0% | 44.0% | 36.7% | 27.5% |
| 15% | 57.5% | 46.0% | 38.3% | 28.8% |
Breakeven win rate on MES versus ES
Take the same 16-tick stop on two contracts. On MES, 16 ticks risks $20.00, and the illustrative $1.50 cost is 7.5% of it. On ES, 16 ticks risks $200.00, and the $5.00 cost is 2.5%. At a 1.5-to-1 target, the MES trader needs 43.0% winners, while the ES trader needs 41.0%.
Two points of required win rate may not sound like much. Over hundreds of trades it can be the difference between a strategy that pays and one that slowly bleeds.
It also gets worse in exactly the moment traders are most tempted to tighten up. After a run of losers, shrinking the stop feels like cutting risk. At 8 ticks the MES cost is 15% of risk, and the 1-to-1 trader now needs 57.5% winners, a higher bar set on a stop that normal noise reaches more often.
Related lesson: How the reward multiple sets the win rate hurdle
Setting Entry, Stop and Target Prices Around Breakeven
Breakeven earns its keep when you plan the trade. Here is one illustrative MES long, worked from entry to net result.
- Entry: 7,000.00.
- Breakeven price: 7,000.00 + 0.30 = 7,000.30. The first profitable exit is 7,000.50.
- Stop: 16 ticks, or 4.00 points, at 6,996.00. Gross risk is $20.00; net loss if stopped is $21.50.
- Target: 1.5R, or 24 ticks (6.00 points), at 7,006.00. Gross gain is $30.00; net gain is $28.50.
On paper this is a 1.5-to-1 trade. After costs, it pays $28.50 for every $21.50 it loses, which is about 1.33 to 1. That is the number your win rate has to support.
For a short, mirror every step. A short at 7,000.00 breaks even at 6,999.70, so the first profitable exit is 6,999.50.
Sizing a target to a net reward multiple
If you want a true 1.5-to-1 after costs on the 16-tick MES stop, size the target from net numbers. The net loss is $21.50, so a 1.5R net win is $32.25. Add back the $1.50 cost and you need $33.75 gross, which is 27 ticks, or 6.75 points, putting the target at 7,006.75.
The general version: target ticks = (R × net loss + round-trip cost) ÷ tick value, rounded up to a whole tick. It is a small adjustment, but it stops you from planning trades on gross numbers you will never be paid.
Position Sizing With Breakeven Costs Included
Position sizing with costs is a single division: contracts = risk budget ÷ (stop risk per contract + round-trip cost per contract), rounded down.
Take an illustrative $200 risk budget on MES with a 16-tick stop. Stop risk is $20.00 per contract and cost is $1.50, so each contract really risks $21.50. That gives 9 contracts, for $193.50 of total risk.
Size it on gross numbers and you get 10 contracts at $20.00 each, which looks exactly on budget. Once costs are added, those 10 contracts risk $215.00, 7.5% over the limit you set. On an account with a hard daily loss limit, that gap is where rule breaches come from.
Related lesson: Turning a risk budget into a whole number of contracts
Does breakeven change with position size
A per-contract cost does not get cheaper in ticks as you add contracts. One MES contract at $1.50 needs 1.2 ticks. Twenty contracts pay $30.00 and still need 1.2 ticks, because they also earn twenty times as much per tick. Trading smaller does not fix a breakeven problem, and trading larger does not dilute it.
A fee charged per order is different. An illustrative $0.25 per-order fee, paid on entry and exit, adds 0.40 ticks to the breakeven on one MES contract but only 0.02 ticks spread across 20. Order count matters too. A scale-out that exits in three pieces turns two orders into four, and on one contract the breakeven rises from 1.6 to 2.0 ticks.
So if your cost schedule has a per-order charge, fewer and larger orders help. If it is purely per contract, the only levers that change breakeven in ticks are the cost itself, the contract you choose and your stop distance.
Micro vs Mini Futures Breakeven Costs
Micro futures are smaller versions of the main contracts. On the main equity index, crude oil and gold pairs, the micro is one tenth of its sibling: MES is $5 × the S&P 500 against $50 for ES, MCL is 100 barrels against 1,000 for CL, and MGC is 10 troy ounces against 100 for GC.
Micro commissions are lower in dollars, but rarely one tenth of the full-size cost. Under the illustrative schedule a micro costs $1.50 and a mini $5.00, so the micro pays 30% of the bill on 10% of the tick value. That is why its breakeven in ticks is three times wider.
The clearest way to see it is to match exposure. Ten MES contracts carry the same dollars per point as one ES contract. Ten MES cost 10 × $1.50 = $15.00 round trip against $5.00 for one ES, three times the cost for identical exposure. On the same stop, the cost as a share of risk is three times larger on the micro route, and so is the win-rate penalty it adds.
Related lesson: How micro contracts relate to their full-size siblings
When micro futures still make sense despite wider breakeven
None of this makes micros a bad product. They let you size in smaller steps, which matters when a full-size contract would put too much of an account at risk on a sensible stop. Imagine an illustrative $200 risk budget and a sensible ES stop that risks $500 per contract. ES does not fit. On MES the same stop risks $50.00 plus $1.50 in cost, so 3 contracts fit for $154.50, instead of skipping the trade or tightening the stop to a level normal noise will hit.
The mistake is using micros to build size you could have taken in minis. Once you hold ten or more micros of the same contract, check whether one full-size contract would carry the same exposure for a third of the cost.
Margin and Leverage in a Futures Breakeven Calculation
Margin is the good-faith deposit you post to hold a futures position, and it often gets mixed into breakeven math where it does not belong. CME Clearing sets two levels. Initial margin is the amount required to open a position. Maintenance margin is the minimum you must keep; if the account falls below it, you may get a call to bring the account back up to the initial level, or the position may be reduced or liquidated.
CME Clearing raises margins when volatility rises and lowers them when it falls, with at least 24 hours' notice, and brokers can require more than the exchange minimum. So treat any margin figure as a current reading, never a fixed spec.
Why margin does not enter the breakeven formula
Margin is not a cost. It is collateral that comes back when you close the trade, so it never appears in breakeven ticks or breakeven price. What margin changes is how big the breakeven gap is next to the money you put up.
CME's education material puts futures margin typically at 3-12% of notional value. MES at an illustrative 7,000 has a notional value of 7,000 × $5 = $35,000, so that range would mean roughly $1,050 to $4,200 per contract. A 1% move in the index (70 points) is worth $350 on that one contract, which can be a large share of the margin posted. That is leverage: small price moves produce large changes in account equity, in both directions.
The breakeven lesson is simple. Leverage magnifies the dollar result of every tick, including the ticks you spend covering costs. It does not change how many ticks you need.
How Volatility Changes the Weight of Breakeven Costs
Commission schedules change slowly. Volatility does not, and it decides how much of your stop the cost eats.
An illustrative study from the previous edition of this guide measured the 14-day average true range (ATR) on a front-month continuous E-mini S&P 500 daily series covering 5,031 completed sessions from September 18, 2006 to September 15, 2026. The median 14-day ATR was 20.6161 index points in 2006 to 2011 and 71.5343 points in 2022 to 2026, 3.4698 times as wide. These figures describe one instrument on one data series and are not a forecast.
Apply the illustrative $1.50 MES cost to a stop of one ATR. In the quieter period that stop risked about $103.08 per contract and cost was 1.4552% of it. In the recent period the stop risked about $357.67 and cost fell to 0.4194%. On ES, with the $5.00 cost, the share went from 0.4851% to 0.1398%.
Why tight stops raise the breakeven cost share
The volatility lesson for breakeven is about stop size, not fees. On the E-mini S&P 500 study's recent median, a one-ATR stop is about 286 ticks. A trader who uses a 20-tick MES stop is risking $25.00, about one fourteenth of a typical day's range, and the $1.50 cost is 6% of that risk. The tighter the stop compared with the market's normal movement, the more the fixed cost matters, and the more often normal noise reaches the stop before the idea has a chance to work.
Related lesson: Measuring a market's normal range with ATR
Breakeven on Funded and Prop Trading Accounts
Funded and prop trading accounts use the same breakeven formula, but their rules change how often you pay it and how much room you have.
- Daily flat rules. Many prop accounts require positions to be closed before the session ends, so every trade is a full round trip inside one session. A trader who might otherwise hold a position for several days pays the cost each day instead.
- Loss limits. A daily loss limit or trailing drawdown counts your losses, and those losses include whatever you paid in costs. Sizing a prop account on gross stop risk, without adding the round-trip cost per contract, is how traders hit a limit on what looked like a planned loss.
- Contract caps. Prop accounts usually limit size by contract count rather than margin, often with ten micros counting as one mini. Within that cap, the micro-versus-mini cost gap still applies.
On our accounts, commissions are published per contract round trip: $1.82 for MES and $5.76 for ES. Ten MES cost $18.20 against $5.76 for one ES, so our Help Center suggests trading the mini once you size in multiples of 10 micros. All positions must be closed by 4:45 PM ET, and our funded accounts are simulated.
A Pre-Trade Futures Breakeven Checklist

Run this checklist before the entry, not after the exit. It takes about a minute, and every input is a number you already have.
- Write down your all-in round-trip cost for the exact contract, including exchange, clearing and NFA fees and any per-order charge.
- Divide it by the tick value to get breakeven in ticks, and note the first whole tick that clears it.
- Divide the cost by your stop risk in dollars. Above roughly 10%, the cost is doing real damage to your required win rate.
- If that share is too high, change the stop or the contract before you change the size, because size does not change a per-contract breakeven.
- Check your net reward multiple, not the gross one, and adjust the target if it falls short.
- Size the position on stop risk plus cost, rounded down.
Journaling net results to measure your real breakeven
A breakeven checklist only stays honest if your records do. Log net P&L, not gross, and log your actual exit fills so you can measure slippage. Be aware that thin liquidity, such as around the session open or in quiet overnight hours, can widen spreads and slippage, which raises your real breakeven even when the fee schedule has not changed.
Related lesson: Tracking net results and slippage trade by trade
Futures Breakeven Calculator Questions
How do you calculate breakeven on a futures trade?
Divide your all-in round-trip cost per contract by the contract's tick value to get breakeven in ticks. Multiply by the tick size to get the price distance, then add it to a long entry or subtract it from a short entry. With an illustrative $1.50 cost on MES, that is 1.2 ticks, or 0.30 points.
Does breakeven change with the number of contracts?
Not when costs are charged per contract, because cost and tick value both scale with size. It does change when part of the cost is charged per order, since that charge is spread across more contracts. Scaling in and out adds orders and raises it.
Why is breakeven wider on micro futures?
Micro commissions usually fall less than micro tick values do. A micro paying 30% of a mini's cost on 10% of its tick value needs about three times as many ticks to break even. Ten micros of the same exposure also cost about three times as much as one mini.
Does margin affect breakeven?
No. Margin is collateral returned when the position closes, so it is not part of the breakeven calculation. Leverage does magnify the dollar effect of each tick, including the ticks spent covering costs.
Is breakeven the same as moving a stop to breakeven?
Not quite. Moving a stop to your entry price leaves you exposed to the full round-trip cost if it is hit. A true breakeven stop sits at the commission-adjusted breakeven price, rounded to the next whole tick in your favour.
This guide is for education only and is not trading, investment or tax advice. Futures are leveraged, and losses can exceed your expectations and, in a brokerage account, your deposit. Costs, fees and margin requirements change; confirm current figures with your broker and the exchange. Funded and prop trading accounts are simulated, and simulated results do not reflect live market fills.


