



TL;DR: Continuous futures contracts are chart series that join dated contracts, so the key decision is how each roll gets stitched. Back adjustment keeps point and dollar moves, while ratio adjustment keeps percent moves. A raw splice prints fake gaps, such as 73.25 ES points ($3,662.50) as of November 3, 2026. No continuous price is tradable, so every order goes to a dated contract like ESZ26.
What Continuous Futures Contracts Are
Continuous futures contracts are price series that join a chain of dated futures contracts into one line. Every real futures contract expires, so a chart of one delivery month only covers that contract's life. A continuous contract keeps the chart running by switching to the next contract when the old one fades.
That convenience comes with a catch most traders find out the hard way. You draw a level off last year's chart, or you trust a backtest, and the number turns out to be something your platform calculated rather than a price anyone traded. Knowing how the series is built tells you which numbers you can lean on.
Interactive Brokers describes its version as a sequence of successively expiring lead contracts, each with the interval during which it was the lead. TradingView calls a continuous contract an artificial instrument built by linking contracts with different expiration dates.
Three practical points follow from those definitions.
- The series is built, not listed. No exchange lists it and no clearing house settles it. Your platform or data vendor builds it, and another vendor can build a different one from the same quotes.
- Each bar belongs to one real contract. At any moment the line is borrowing its price from a specific delivery month, such as the December E-mini S&P 500 (ESZ26).
- Two separate choices shape the line. A roll rule decides when the series moves to the next contract. An adjustment rule decides what happens to the older prices at that seam.
Interactive Brokers also states that its continuous contracts are for market data only and that orders on futures are not updated by them. Keep that limit in mind. A continuous chart is an analysis tool, and every order still goes to a dated contract.
Related lesson: How futures month codes and symbols work
Rollover Dates in a Continuous Contract
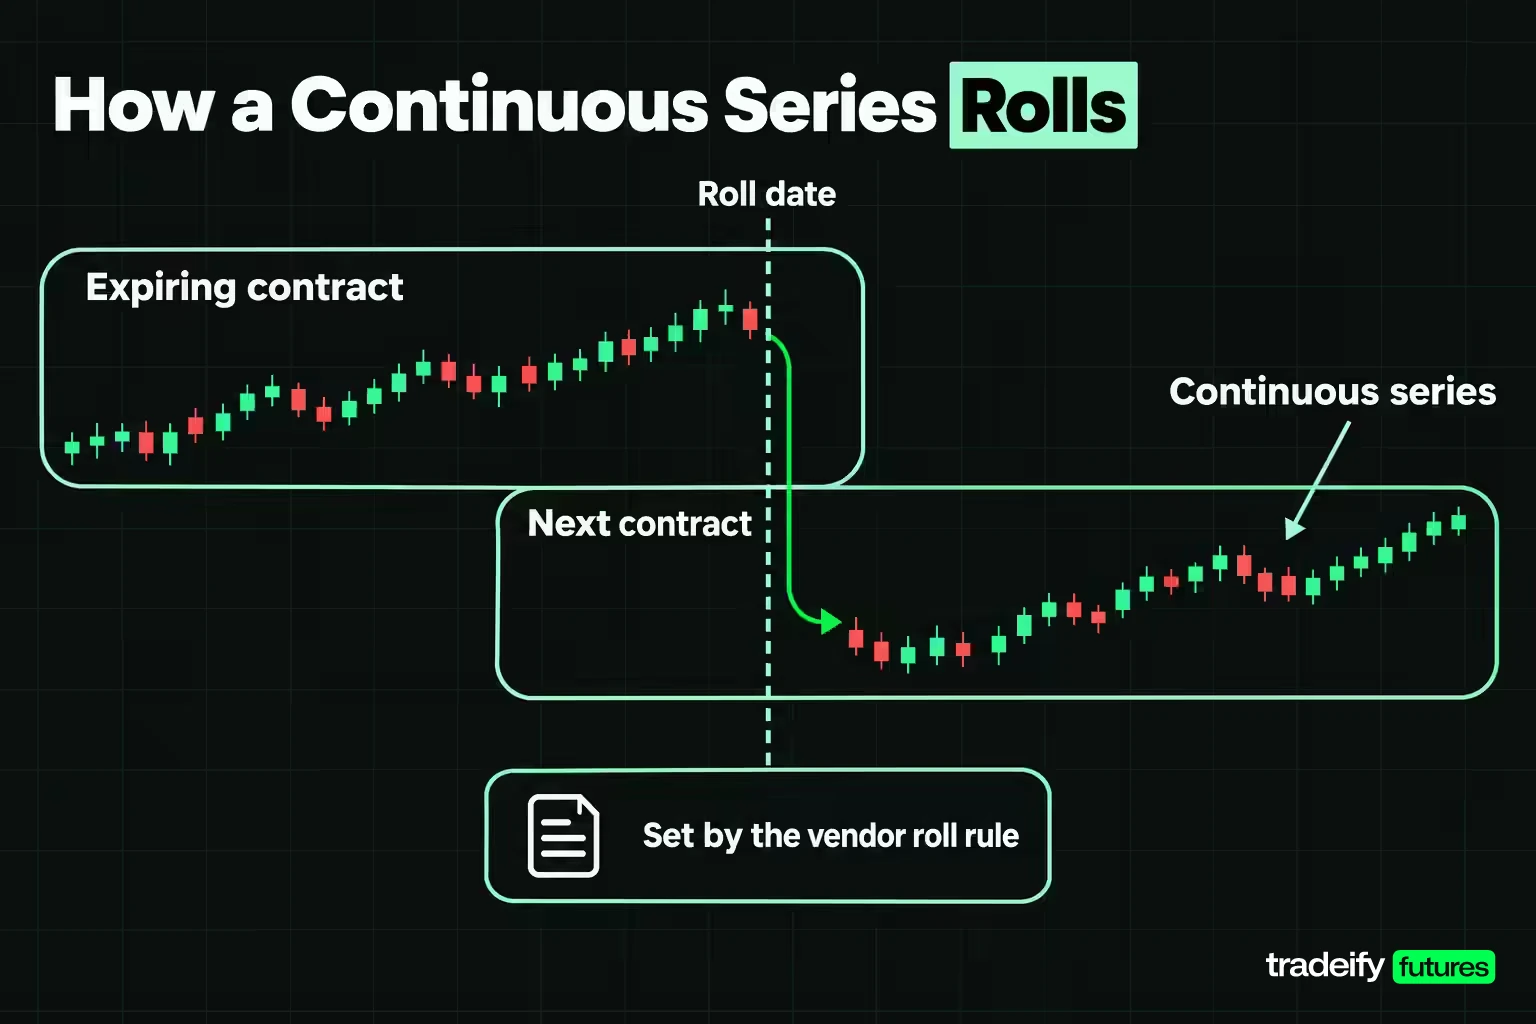
The rollover date in a continuous contract is the day the series stops borrowing prices from one delivery month and starts using the next. It is set by the vendor's roll rule, not by the exchange, so two platforms can switch on different days.
The common roll rules fall into a few families.
| Roll rule | When the series switches | Main weakness |
|---|---|---|
| Last trading day | On the expiring contract's final day | Liquidity has usually moved to the next month well before that |
| First of delivery month | On the first day of the contract month | Ignores where traders actually are |
| Date rule | On a fixed day per product, such as a set number of days before expiry | Can miss a quarter when volume moves early or late |
| Volume or open interest | When the next month's daily volume or open interest passes the current month | Can flip back and forth on a noisy day |
| Fitted rule | On a fixed offset learned from historical volume averages | Can switch before or after this quarter's actual volume crossover |
QuantPedia lists the last-trading-day, first-of-month and liquidity-based methods for backtesting. Sierra Chart offers both a date rule and a volume-based rollover and says the volume method is preferred for commodity futures and, more recently, for stock index and currency futures such as ES, NQ and 6E.
TradingView uses a fitted rule. Its main condition is the next contract's daily volume exceeding the current one, but it turns that into a fixed offset learned from history for each symbol. TradingView's own example is gold: the GC1! series switched to the December 2022 contract on 28 July 2022, about a month before the August contract expired on 29 August 2022. TradingView also notes the series can switch while the old contract still carries more volume, and the reverse.
Exchange roll dates versus continuous chart roll dates
The exchange gives a reference point for equity index futures. CME sets the equity index roll date as the Monday prior to the third Friday of the expiration month. For the December 2026 contracts that is December 14, 2026, against a December 18, 2026 expiration. ES itself stops trading at 9:30 AM ET on the third Friday of the contract month.
Other markets do not follow that calendar. December 2026 crude oil (CLZ26) has a last trading day of November 20, 2026, because crude trading ends three business days before the 25th of the month before delivery.
Volume shows how different the timing can be. As of the November 3, 2026 CME settlement, the March 2027 E-mini S&P 500 carried only 0.3% of the two nearest months' volume, so the market was still in December. January 2027 crude oil already carried 34.9% of the two nearest months' volume, with December crude about two and a half weeks from its last trade. A roll rule built on one of those markets would not fit the other. If your chart switched crude on a fixed date and ES on volume, neither choice would be wrong. They would just be answering different questions about where the market is trading.
Related lesson: How to tell which contract month the market is using
Contango, Backwardation and the Roll Gap
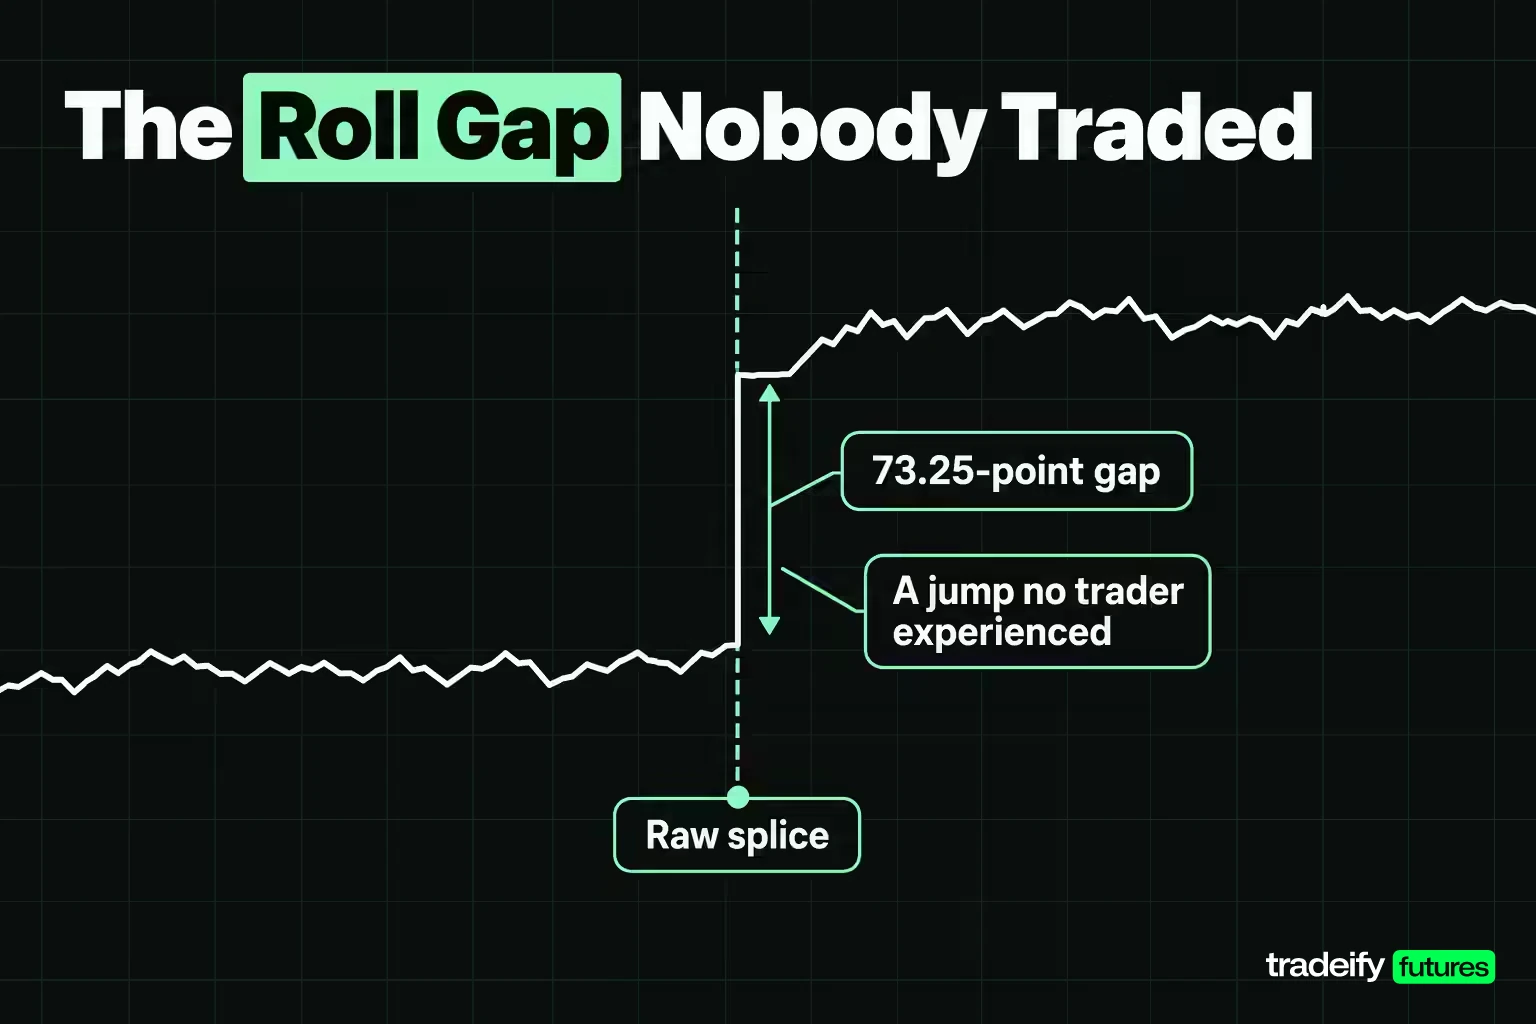
The continuous contract roll gap is the price difference between the old and new contract at the switch. It exists because deferred months trade at different prices from the front month. When later months trade higher, the curve is in contango. When later months trade lower, it is in backwardation.
A raw splice, with no adjustment, prints that difference as if the market moved. Here is what it looked like as of the CME settlement for the November 3, 2026 session.
| Market | Front month settle | Next month settle | Gap at a raw splice | Gap per contract |
|---|---|---|---|---|
| E-mini S&P 500 (ES), contango | Dec 2026 at 7,596.75 | Mar 2027 at 7,670.00 | +73.25 points | $3,662.50 |
| WTI crude oil (CL), backwardation | Dec 2026 at $96.09 | Jan 2027 at $94.77 | -$1.32 per barrel | -$1,320 |
No one earned that $3,662.50 on ES. It is the market's pricing of three more months of carry, not a move in the S&P 500. On crude oil, the raw splice prints a $1,320 loss that no position took.
This is where a chart misleads quietly. The gap looks like a breakout or a flush, and nothing on screen says it is a seam.
QuantPedia makes the backtesting point directly: a spliced dataset contains artificial jumps that show up as profits or losses that could not be achieved in practice. A strategy can look profitable when it is not, or unprofitable when it is.
The direction of the gap tracks the curve. In a contango market a long-only backtest on raw data collects fake gains at each roll. In a backwardated market it collects fake losses. The curve shape also changes over time, so the error is not a constant you can subtract later.
Stitching Methods for Continuous Futures
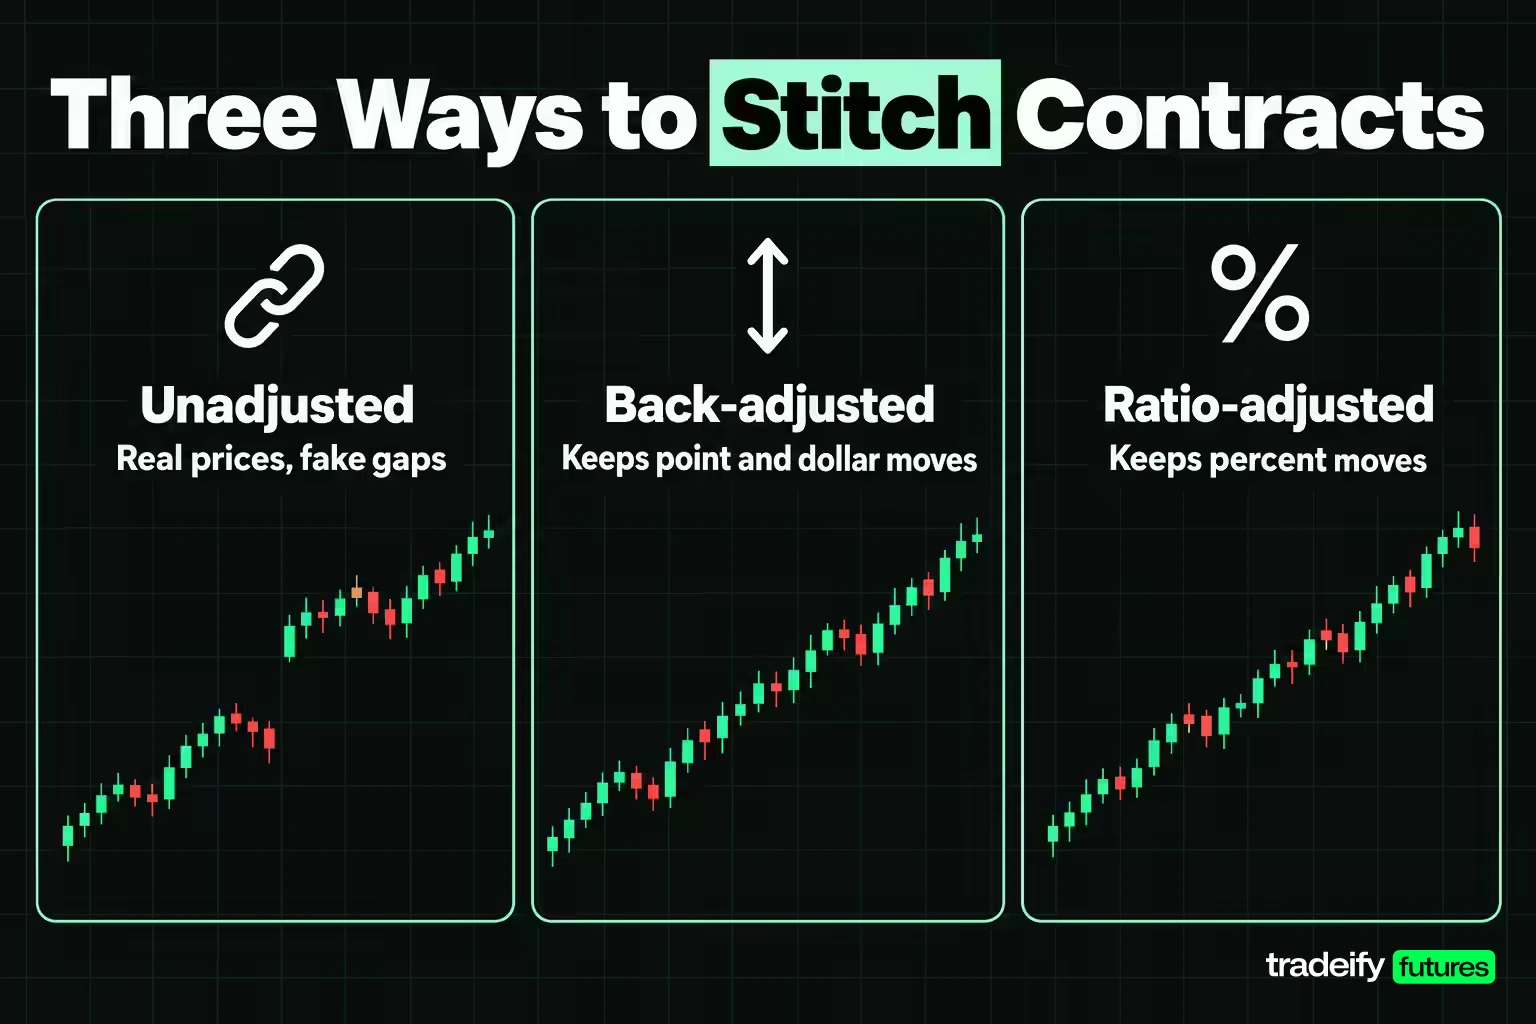
Stitching methods for continuous futures decide what happens to older prices at each roll. There are three main methods, plus a couple of variants.
Unadjusted continuous splice
The unadjusted method joins the contracts with no change. Every price on the chart is a price that actually traded in some contract. The cost is the roll gap. Each seam prints a jump that no trader experienced, such as the 73.25-point ES gap between the December 2026 and March 2027 settlements on November 3, 2026. NinjaTrader calls this setting MergeNonBackAdjusted and warns that significant price gaps may be present.
Back-adjusted continuous data, the additive method
Back adjustment shifts every older price by the gap at each roll so the line joins up. The newest contract keeps its real prices. Each older contract is moved up or down by the sum of all the gaps that came after it. QuantPedia calls this the backwards panama canal method.
Vendors compute the gap at slightly different moments:
- TradingView uses the difference between the new and old contracts' closes on the nearest daily bar to the switch.
- NinjaTrader uses the difference between the two closes one day prior to the rollover date, or an offset downloaded from its data server.
- Sierra Chart uses the difference between the two contracts' prior-day settlement prices. Since Sierra Chart version 2346 it uses settlements rather than the current day's open.
Back adjustment keeps point distances intact. A 20-point swing on the original contract is still a 20-point swing on the adjusted chart, so dollar P&L per contract is preserved. Percentage moves and absolute price levels are not.
Ratio-adjusted continuous data
Ratio adjustment multiplies older prices by a factor instead of adding a constant. Interactive Brokers documents the steps: take the closing prices of the new and old contracts on the switch date, divide new by old, and multiply all of the old contract's data on and before that date by the ratio. Repeat for each earlier roll.
Ratio adjustment keeps percentage moves intact, so returns are preserved. Point distances, and therefore dollar P&L per contract, are not. QuantPedia uses a first-of-month roll with backwards ratio adjustment because its research reports percentage performance.
Forward and calendar-weighted variants
A forward method anchors on the oldest contract instead. Old prices stay real and the recent end is shifted, which means today's chart price no longer matches the contract you can trade. A calendar-weighted method blends the two contracts over a window around the roll so the transition is gradual. QuantPedia notes that it avoids recalculating history at each roll, but it depends on predictable roll dates.
Worked Example of a Back-Adjusted and Ratio-Adjusted Continuous Contract
This worked example builds a continuous contract from three illustrative contracts in an ES-style market at $50 per point. The prices are round numbers chosen to show the arithmetic, not quotes.
- Roll 1: old contract A at 6,900.00, new contract B at 6,960.00. Gap of 60.00 points.
- Roll 2: contract B at 7,100.00, new contract C at 7,170.00. Gap of 70.00 points.
- Contract C now trades at 7,200.00 and is never adjusted.
The two backward methods then rewrite the older contracts.
| Bar on the original contract | Real price | Back-adjusted price | Ratio-adjusted price |
|---|---|---|---|
| Contract B at roll 2 | 7,100.00 | 7,170.00 | 7,170.00 |
| Contract A at roll 1 | 6,900.00 | 7,030.00 | 7,028.62 |
| Contract A, earlier bar | 6,000.00 | 6,130.00 | 6,111.84 |
Back adjustment adds 70 points to B and 130 points to A, the sum of both gaps. Ratio adjustment multiplies B by 1.009859 (7,170 divided by 7,100) and A by 1.018641, the product of both roll ratios. At the newest seam both methods land on 7,170.00, which is what you would expect. The differences grow the further back you go.
Now read the same 6,000.00 bar. The two methods print it 18.16 points apart, which is $907.84 on one ES contract. Neither number is wrong. They answer different questions, and a trader who does not know which one the chart uses cannot tell which question it answered.
What each method keeps from the real move
Take the real move on contract A from 6,000.00 to 6,900.00. That was 900 points, $45,000 per contract, and a 15.00% gain.
| Measure of the move | Real contract | Back-adjusted series | Ratio-adjusted series |
|---|---|---|---|
| Points | 900 | 900 | 916.78 |
| Dollars per ES contract | $45,000 | $45,000 | $45,838.82 |
| Percent | 15.00% | 14.68% | 15.00% |
Back adjustment keeps the 900 points and the $45,000 but understates the percentage, because it divides the same move by a higher base (6,130). Ratio adjustment keeps the 15.00% but overstates the points. That is the whole tradeoff in one table.
A quick check you can run on any platform: under both backward methods, the newest contract's prices must be untouched. If the right-hand edge of a back-adjusted continuous chart does not match the current contract's quote, the series is anchored somewhere else, possibly forward. In the forward version of this example, contract C would show 7,070.00 instead of its real 7,200.00.
Negative Prices and Other Distortions on Adjusted Charts
Adjusted continuous futures charts can show prices, levels and shapes that never existed in any contract. Knowing the main distortions keeps you from reading them as market behavior.
Negative prices on back-adjusted charts
A back-adjusted chart can print negative prices even when every real contract traded above zero. In a market that spends years in backwardation, each roll shifts older history down. Add enough of those shifts and an old price falls below zero. For example, an old crude bar at $20.00 with a cumulative offset of -$25.00 displays as -$5.00. That number is pure arithmetic.
Real negative prices are rare but possible. The CFTC's interim staff report records that the May 2020 WTI crude oil contract settled at -$37.63 per barrel on April 20, 2020, the first negative price since the contract was listed 37 years earlier. All other expirations settled above zero that day. A ratio method cannot handle a zero or negative real price, because the factor stops making sense, so ratio-built series around that date need special handling.
Levels that never traded
On any adjusted continuous chart, older support and resistance levels sit at prices that never printed. Imagine an old contract that topped at 6,900.00 and later rolls added 130 points of back adjustment. The chart now shows that top at 7,030.00, a price no order ever filled at. Drawing a horizontal line across years of adjusted history mixes levels that traders saw with levels the vendor computed.
It is tempting to treat an old adjusted high as a level the market "remembers". The market only remembers prices it actually traded.
Back-adjusted continuous history that keeps changing
Sierra Chart warns that with back-adjusted options the price for a particular date and contract month changes as time goes by, because every new roll rewrites everything before it. Its suggested fix is not to use the back-adjusted options. In practice that means a level you noted last quarter may not sit at the same number today.
Volume and indicators at a continuous contract seam
Volume on a continuous chart is the borrowed contract's volume, so it drops and jumps around a switch depending on the roll rule. Moving averages and oscillators that span a seam on an unadjusted chart absorb the roll gap as if it were a move. A 73.25-point roll gap on ES, the size of the December to March difference at the November 3, 2026 settlement, would add 7.33 points to a 10-bar simple moving average in a single bar.
Backtesting Accuracy on Continuous Futures Data
Backtesting accuracy on continuous futures data depends on one fact: most historical prices on an adjusted series never existed. The backtest is running on a model of the market, and the model's settings change the result.
Three accuracy problems show up most often.
- Raw splices add phantom P&L. In a contango market such as the ES curve on November 3, 2026, a long strategy collects about $3,662.50 per contract in fake gains at a roll of that size. In backwardation it collects fake losses.
- Adjusted series change the math. Back adjustment keeps dollars per contract but distorts percentages, and ratio adjustment does the opposite. On an illustrative 900-point move up from 6,000.00 with 130 points of later back adjustment, the back-adjusted series shows 14.68% where the real gain was 15.00%.
- Adjusted history drifts. Because each new roll rewrites earlier prices, a backtest re-run next quarter on the same back-adjusted series can return a different result from the same rules.
Costs need their own treatment. A continuous series hides the roll itself, and that is the part a backtest most often gets too cheap. A strategy that holds through a switch on a real account has to exit one contract and enter another, which means commissions, a spread and possible slippage on both legs. The continuous chart shows none of that.
Session details matter for intraday tests too. Sierra Chart notes that intraday transitions happen at the chart's session start time, and that reversed or evening session settings can move a rollover into the prior trading day. A one-minute backtest near a roll can therefore look different from one platform to the next.
Related lesson: How to backtest a trading strategy
Which Strategy Rules Survive Back Adjustment and Ratio Adjustment
Strategy rules survive a continuous contract adjustment only when they measure the same thing the adjustment preserves. Matching the rule type to the method is most of the work, and it is cheaper to do before a backtest than after a live drawdown.
| Rule type | Back-adjusted (additive) | Ratio-adjusted | Unadjusted |
|---|---|---|---|
| Point-based stops and targets, such as a 20-point stop | Survives | Distorted in older history | Survives except across a seam |
| Percentage moves and returns | Distorted in older history | Survives | Survives except across a seam |
| Absolute price levels, such as buying above a round number | Fails | Fails | Survives inside one contract only |
| Moving averages and oscillators | Survives in shape | Survives in shape | Distorted at every seam |
| Volume filters | Depends on the roll rule | Depends on the roll rule | Depends on the roll rule |
Four checks help confirm a result is not an artifact of the series.
- Run the same rules on a back-adjusted and a ratio-adjusted series. If the result changes sign or shrinks sharply, the edge may come from the construction rather than the market.
- Re-run with a different roll rule, for example a date rule against a volume rule. Trades clustered in the days around rolls deserve a closer look.
- Test the most recent period on single dated contracts with no adjustment. Those prices actually traded.
- Record the roll rule, adjustment method and data vendor beside every result. Without them nobody can reproduce the number, including you.
Choosing a Data Source for Continuous Futures Charts
The data source for continuous futures charts decides the roll rule, the adjustment price and how much history you get. Two vendors can show different charts of the same market for those reasons alone. Premium Data, a futures data vendor, notes that different roll schedules for the same market produce results that often differ visibly.
The questions worth asking any vendor or platform:
- Which roll rule does it use, and can you change it per product?
- Which adjustment does it apply, and is it on by default? TradingView's back-adjustment is off by default.
- Which price sets the gap: a daily close, a settlement, or an open? Sierra Chart changed from the current day's open to prior-day settlement in version 2346, so older exports may not match newer ones.
- Does it skip inactive months? Sierra Chart notes that August soybeans are never active and are skipped in favor of November.
- How much expired-contract history does it hold, and at which bar size?
Data feeds and platforms do not always mix. Sierra Chart states that its intraday continuous futures charts are not supported on Interactive Brokers, CQG or Rithmic data and need its own Denali Exchange Data Feed or Historical Data Service. It also says Rithmic's single-digit year symbols limit how much history the feature can reach. NinjaTrader downloads roll dates and offsets from its own server and calculates them locally only when the server has none.
A practical rule: use one vendor's continuous series for research and keep a note of its settings. Mixing a chart from one platform with a backtest from another can introduce differences that have nothing to do with the strategy.
How to Create a Continuous Contract in TradingView, NinjaTrader and Sierra Chart
Creating a continuous contract takes a few settings in most charting platforms. The steps below follow each vendor's own documentation.
TradingView continuous contract setup
- Type the root with 1! for the front-month series, such as ES1!, or 2! for the second month.
- Look for the B-ADJ button (Adjust for contracts changes) at the bottom of the chart, or the matching checkbox in chart settings.
- Turn it on to back-adjust older contracts by the close difference at each switch. Leave it off to see the raw splice.
- Check the contract switch markers to see which month each stretch of the chart uses.
TradingView notes that back-adjustment is not yet available for every futures symbol.
NinjaTrader 8 continuous contract setup
- Open Options and go to the Market data category.
- Set Merge Policy to MergeBackAdjusted for a back-adjusted chart, MergeNonBackAdjusted for a raw splice, or DoNotMerge to load only the selected contract month.
- To see or override roll dates and offsets, open the Instruments window, edit the instrument and open Contract months. The rollover date is the date to roll into that month.
- Merge policy can also be set per instrument if one market needs different treatment.
Sierra Chart continuous contract setup
- Update the Global Symbol Settings once so the rollover rules are current.
- Open Chart Settings and choose a Continuous Contract option: Date Rule Rollover, Volume Based Rollover, or either one Back Adjusted.
- On the Symbol tab, use a standard dated symbol for the current active month, such as ESM23-CME, not a continuous symbol.
- Turn on the rollover markers to see where each contract month starts.
Sierra Chart notes that its continuous feature does not roll the chart's own symbol forward. When the active month changes, update the symbol yourself.
Trading a Continuous Futures Signal on the Real Contract
Trading a continuous futures signal means translating it onto the dated contract that is actually live. The continuous chart can tell you where price is relative to its own history. The order has to go to a specific delivery month.
Four checks keep a chart signal from turning into an order on the wrong month or at a level that never traded.
- Confirm which contract the newest bars belong to. On a back-adjusted series the right-hand edge should match the current contract's quote. If it does not, find out why before using any level from it.
- Carry distances, not old levels. A stop 20 points below a swing low on a back-adjusted chart is still 20 points on the real contract, which is 80 ticks at 0.25 points or $1,000 on one ES contract. A level from adjusted history has no direct meaning on the live contract, however clean it looks.
- Watch roll week. Between the vendor's switch date and the exchange's last trading day, the chart and the liquid contract may not be the same month. As of the November 3, 2026 settlement, December crude still had about 65% of the two nearest months' volume while January had 34.9%, so a chart switched early or late would be quoting the thinner month.
- Check the symbol on the order ticket. A front-month continuous symbol and the dated contract can show the same price on most days and still point at different months during a roll.
On our accounts, continuous symbols are for charts only. The Help Center notes that TradingView symbols ending in 1!, such as ES1!, are chart-only and not tradable, and the rule of thumb is to trade the contract shown as the current Globex code on the CME calendar, written like ESH7 on Tradovate, Rithmic, WealthCharts and NinjaTrader or ESH2027 on TradingView and Tradesea. Because all positions are closed by 4:45 PM ET with no overnight holds, a roll on our accounts simply means choosing which contract month to trade in the next session.
Related lesson: When to roll a futures contract
Continuous Futures Contracts FAQ
Are continuous futures contracts real
No. A continuous futures contract is a constructed series inside a charting platform or data vendor's database. No exchange lists it and no order fills at its historical prices. It is built from real contracts, but the series itself is a calculation.
What is back adjustment in futures
Back adjustment is a way of removing roll gaps by shifting older contract prices by the price difference at each roll. The newest contract keeps its real prices, and each older contract moves by the sum of the later gaps. It preserves point moves and dollar P&L per contract, but not percentages or historical price levels.
Which continuous contract adjustment method is best
No single method is best. Back adjustment suits point-based stops, targets and dollar P&L. Ratio adjustment suits percentage returns and long-horizon comparisons. An unadjusted series suits checking prices that actually traded.
Why does my continuous chart differ from another platform
The two platforms are probably using a different roll rule, a different adjustment, or a different price to measure the gap. One may switch on a volume rule and the other on a fixed date. Check both platforms' settings before comparing levels.
Can you trade a continuous futures contract
Not as a product of its own. TradingView says only its front-month continuous symbols can be traded, only for CME and EUREX futures, and that second-month symbols cannot be traded at all. Any order placed that way still lands in a real dated contract, so check which month it is before you click.
Continuous futures data is a research and charting convention, not a tradable price, and backtests built on it inherit the assumptions of the series. Futures use leverage and can lose more than expected, sometimes quickly. Evaluation and funded accounts are simulated. Settlement prices cited here are from the November 3, 2026 session and change daily. This guide is education, not trading advice.


