




TL;DR: How to identify the active futures contract comes down to one check, which expiration carries the most volume right now. The nearest listed month is usually that contract, but not always. On November 4, 2026, December gold took 86.5% of gold volume while November traded 17 lots. Read volume by contract month on the exchange's settlement report, then confirm the month and year in your order ticket's symbol.
Every futures product trades as a stack of separate contracts, one per expiration month. They share a root symbol, but each month has its own order book, its own volume and its own price. The active futures contract is the month where most of the trading is happening, and that is the one you usually want to trade, because that is where the tight spreads and the deep book are.
The catch is that a chart labelled "ES" or "GC" does not tell you which month you are looking at, and a platform default can quietly put you in the wrong one. You can check it from exchange data in a few minutes. The examples here use real CME settlement reports from late October and early November 2026, including one product caught mid-handover, so you can see where the usual shortcuts break.
Active Futures Contract vs Front Month Definitions
The active futures contract is the expiration month with the highest trading volume for a product at a given time. It is a measurement, not a label, and it changes during every expiry cycle.
It is easy to confuse with "front month", which is a calendar term. The CFTC glossary defines the front month as the spot or nearby delivery month, the nearest traded contract month. Back months are every delivery month other than the spot or front month, and the glossary also calls them deferred months. Neither definition says anything about volume.
On most days for most products the two point at the same contract, which is why traders use them interchangeably. They are still two different claims:
- Front month (or nearby month) answers "which contract expires next?"
- Active contract answers "which contract is everyone trading today?"
- Back or deferred months are everything listed after the front month, whether they trade heavily or barely at all.
CME Group uses the volume meaning when it describes equity index rolls. After the roll date, CME says it is customary to treat the second nearest expiration as the "lead month", because the nearest contract will terminate soon and will have a less liquid market. So the exchange itself expects the active contract to move away from the front month before the front month expires.
Related lesson: How front month and back month contracts differ
How to Identify the Active Futures Contract in Four Checks

This check works for any exchange-listed future and does not depend on what your platform shows by default.
- Find the contract the exchange is quoting now. On CME Group product pages the quote shows the current contract code, for example ESZ6 for the December 2026 E-mini S&P 500. That gives you the starting candidate.
- Read volume by contract month, not the product total. The exchange's daily settlement report lists every listed month with its volume and open interest. Look for the month whose volume is far ahead of the rest.
- Compare the top two months. Most of the time one month holds almost all of the volume and you are done. If the second month is closing in, you are inside a handover window and the answer can change within days.
- Confirm the month and year on your order ticket. The volume check tells you which contract is busy. The symbol tells you which contract you are actually in. They are separate questions.
Two timing details change how you read the numbers. CME Group says its daily volume and open interest report is released at the end of each trading day as a preliminary report, with official data in the Daily Bulletin the following morning, and the two can differ. CME also notes that the open interest on a settlement page is the previous trading day's figure. So a close call on an intraday running total is a strong hint, not a settled answer.
Related lesson: What each field on a futures quote means
Reading Volume by Contract Month on a Settlement Report
A settlement report is the clearest place to see the active contract, because it puts every listed month on one screen. Here is how six products looked on the CME settlement report for the November 4, 2026 session (final report).
| Product | Nearest listed month | Busiest month | Busiest month volume | Busiest month share of all months | Runner-up month and share |
|---|---|---|---|---|---|
| E-mini S&P 500 (ES) | Dec 2026 | Dec 2026 | 2,329,405 | 99.7% | Mar 2027, 0.3% |
| Euro FX (6E) | Nov 2026 | Dec 2026 | 252,333 | 97.7% | Mar 2027, 0.9% |
| Gold (GC) | Nov 2026 | Dec 2026 | 232,561 | 86.5% | Feb 2027, 8.5% |
| Corn (ZC) | Dec 2026 | Dec 2026 | 191,398 | 45.9% | Mar 2027, 28.4% |
| Natural gas (NG) | Dec 2026 | Dec 2026 | 171,175 | 40.6% | Jan 2027, 20.0% |
| WTI crude oil (CL) | Dec 2026 | Dec 2026 | 454,113 | 34.8% | Jan 2027, 16.8% |
Three things are worth reading out of that table.
First, a share near 100% means there is nothing to decide. The December E-mini S&P 500 carried 99.7% of all ES volume that day, so anything else is a different, thinner market.
Second, a low share does not automatically mean the contest is close. Crude oil spreads its volume across many listed months, so the December contract held only 34.8% of the total and still traded about twice as much as January. The comparison that matters is the busiest month against the runner-up, not against the whole product.
Third, the nearest listed month was not the busiest month in two of the six rows. Gold and Euro FX both had a November contract in front of the December contract that did almost all of the trading.
Daily Settlement Prices for Each Contract Month
The same report carries one daily settlement price per contract month. CME's mark-to-market lesson explains that the exchange sets one final daily settlement price for everyone, and open positions are marked to it each day, with losing accounts paying winning accounts. Each month gets its own settlement, so two months of the same product can mark very differently.
As an illustration, the December 2026 E-mini S&P 500 settled at 7,720.50 on November 4, 2026. A position bought at an illustrative 7,700.00 would be marked 20.50 points higher, or $1,025 at $50 per point. The March 2027 contract settled at 7,795.25 the same day, so the same mark on the wrong month would start from a different price.
Related lesson: How daily settlement works on an open futures position
Why the Nearest Contract Month Is Not Always the Active Contract
The nearest month and the active contract split apart because each product has its own listing cycle, and the exchange lists months that traders mostly ignore.
The cycles differ a lot from product to product, according to CME contract specifications:
- E-mini S&P 500 lists quarterly months only, March, June, September and December.
- WTI crude oil and natural gas list a contract for every month, years ahead.
- Gold lists monthly contracts for 26 consecutive months plus any June and December in the nearest 72 months.
- Euro FX lists quarterly months plus serial months in between.
- Corn lists only March, May, July, September and December.
When a product lists every month but traders concentrate in a few of them, the nearest month can be a near-empty contract. Gold is the clearest case. Across the five sessions from October 29 to November 4, 2026, the November gold contract traded between 17 and 1,197 lots a session, while December traded between 142,006 and 237,470. On November 4 the December contract traded 232,561 lots against November's 17.
Euro FX shows the same pattern with a serial month. On November 4 the November 2026 contract traded 1,918 lots while December traded 252,333, which was 97.7% of all Euro FX volume.
So "trade the nearest month" works for ES and fails for gold. The rule that holds for both is simpler. Trade the month with the volume.
Related lesson: How futures expiration dates are set for each product
Watching an Active Contract Change Hands in Crude Oil
Crude oil gives a live example of the active contract in the middle of a handover. The December 2026 WTI contract (CLZ26) stops trading on November 20, 2026, so traders were moving to January 2027 during the sessions below. Figures are from CME's final settlement reports for each session.
| Session in 2026 | December 2026 volume | January 2027 volume | January share of the two | December open interest | January open interest |
|---|---|---|---|---|---|
| October 29 | 262,537 | 112,316 | 30.0% | 268,720 | 181,244 |
| October 30 | 272,385 | 115,733 | 29.8% | 261,778 | 184,114 |
| November 2 | 390,924 | 200,625 | 33.9% | 257,459 | 184,832 |
| November 3 | 376,081 | 201,939 | 34.9% | 236,239 | 193,732 |
| November 4 | 454,113 | 219,870 | 32.6% | 231,146 | 203,974 |
Read the two halves separately.
On volume, December was still clearly the active contract on November 4, trading about twice as much as January. January's share moved up from about 30% to about a third, but it did not go in a straight line. It slipped back on November 4.
On open interest, the shift is plainer. December open interest fell from 268,720 to 231,146 contracts over those sessions while January rose from 181,244 to 203,974, so the gap between them shrank from 87,476 to 27,172. Positions were leaving December for January faster than the volume share suggests.
That is a common shape for a handover. Open interest tends to move steadily as holders roll, and volume tends to cross later, often in one session, once short-term traders follow. With 16 days left between November 4 and December's last trading day, the volume crossover had not happened yet in this data, so the answer to "which crude contract is active?" on November 4 was still December, with a shrinking margin.
September 2026 Crossover Dates for Equity and Currency Contracts
A September 2026 measurement made for this guide covered one full equity and currency cycle. Method: daily volume per contract from a public market data feed over 64 sessions from June 17 to September 17, 2026, with the crossover taken as the first session the December 2026 contract traded more than September 2026.
On that measure, the E-mini S&P 500, E-mini Nasdaq-100 and E-mini Russell 2000 all changed hands on Monday, September 14, 2026. That is exactly the roll date in CME's published equity index table, the Monday before the September 18 expiration. Euro FX and British pound futures changed hands one session earlier, on Friday, September 11, 2026. Same exchange, same month, different handover days, which is why a single calendar rule for every product is unreliable.
Related lesson: Deciding the right moment to roll a contract
Volume vs Open Interest When the Active Contract Is Unclear

Volume and open interest measure different things, and they do not always point at the same contract. Volume is the number of contracts traded during a period. Open interest, per the CFTC glossary, is the number of contracts entered into and not yet closed by offset or fulfilled by delivery.
Natural gas on November 4, 2026 is a good example of the two disagreeing:
- December 2026 traded 171,175 contracts and January 2027 traded 84,401, so December did about twice the volume.
- January's open interest was 282,386 against December's 268,451, so more positions were already sitting in January.
- Five sessions earlier, on October 29, December led open interest by 21,069 contracts. By November 4 January led by 13,935.
So which natural gas contract was active? For a trader entering and exiting within the day, December, because that is where the trading was and where fills are easiest. For someone holding a position for weeks, January was already the month the market was settling into, and December's last trading day was November 25, 2026.
The practical rule is to use volume to decide where to trade today, and use open interest as the early warning that the handover is under way. When open interest flips first, volume usually follows within days.
Last Trading Day and Expiration Rules for the Active Contract
The active contract always has an end date, and the rule that sets it differs by product. Knowing that date tells you how long the current active contract will stay usable and when the handover has to be finished.
| Product | Contract | Last trading day | First notice day | How the last trading day is set |
|---|---|---|---|---|
| E-mini S&P 500 | ESZ26 | December 18, 2026 | None | 9:30 AM ET on the third Friday of the contract month |
| Euro FX | 6EZ26 | December 14, 2026 | None | Two business days before the third Wednesday of the contract month |
| WTI crude oil | CLZ26 | November 20, 2026 | November 24, 2026 | Three business days before the 25th calendar day of the month before the contract month |
| Natural gas | NGZ26 | November 25, 2026 | November 27, 2026 | Third last business day of the month before the contract month |
| Gold | GCZ26 | December 29, 2026 | November 30, 2026 | Third last business day of the contract month |
| Corn | ZCZ26 | December 14, 2026 | November 30, 2026 | Business day before the 15th day of the contract month |
Two patterns in that table matter for picking the active contract.
Energy contracts stop trading in the month before their named month. The December crude contract is finished on November 20, so by mid-November "December crude" is already the expiring contract.
On gold and corn, first notice day comes before the last trading day. December gold has its first notice day on November 30 but keeps trading until December 29. Most speculative volume leaves before the first notice day, so the active contract moves long before the expiration date printed on the calendar.
Can you hold a futures contract until expiry? On most exchange contracts, yes, but holding to the end means settling it, either in cash or by delivery, and many brokers do not let retail accounts reach that stage.
Related lesson: First notice day and last trading day explained
Cash Settlement vs Physical Delivery for the Active Contract
How a contract settles at expiry decides how early the active contract moves on.
Cash-settled contracts end with a payment, not goods. The CFTC glossary describes cash settlement as the seller paying the buyer the cash value of the commodity or an amount based on an index. The E-mini S&P 500 is financially settled, and CME's rulebook sets its final settlement price from a special opening quotation of the S&P 500 on the third Friday of the contract month. There is no delivery risk, so traders can stay in the front month until close to expiry, and the equity index handover happens only a few sessions before the final day.
Physically delivered contracts end with actual delivery. WTI crude oil is deliverable at Cushing, Oklahoma, and gold, natural gas and corn are deliverable too. Holders who do not want delivery have to be out before notice and delivery start, and some brokers enforce that. Charles Schwab Futures and Forex, for example, does not allow clients to take physical delivery and tells clients to roll ahead of first notice day and last trading day.
The effect on the active contract:
- Cash-settled products usually keep the front month active until shortly before the last trading day.
- Delivery products usually see the volume move to the next month earlier, often well before the expiry date, because few speculators want to be near delivery.
- A deliverable contract that still shows trades in its final days is often trading thin, between commercial players, which is not a market you want to enter by mistake.
Related lesson: How cash and physical settlement differ
Rolling to the Next Active Futures Contract
When the active contract changes, anyone holding a position has three choices, according to CME's course on expiration and the contract roll: offset it, roll it, or let it go to settlement.
Offsetting closes the position. The CFTC glossary defines an offset as selling the same number of contracts of the same delivery month you bought (or buying back the same month you sold). After an offset you have no position and no expiry to manage. It is the usual route for day traders, because a position closed before the session ends never meets a last trading day, and the next trade simply goes into whichever month is active then.
Rolling keeps the exposure but moves it to a later month. The CFTC calls a roll-over lifting a near futures position and re-establishing it in a more deferred delivery month. CME's example is a trader long four September E-mini S&P 500 contracts who sells four September and buys four December. CME also says traders decide when to roll by watching the volume of both the expiring contract and the next month, which is the same volume comparison a day trader uses, applied to a position.
A roll can be done as two separate orders or as one calendar spread order. The CFTC defines a calendar spread as buying one delivery month and selling another month of the same contract at the same time. On the E-mini S&P 500 the calendar spread trades in 0.05 index point steps worth $2.50, compared with 0.25 index points worth $12.50 on the outright contract, so the spread can often be done at a finer price than two separate legs. On November 4, 2026, March 2027 ES settled 74.75 points above December, or $3,737.50 per contract. That gap is a price difference between two contracts, not a cost, but it does mean your old price levels do not carry over.
For the US equity index futures, CME publishes a customary roll date, the Monday before the third Friday of the expiration month. The December 2026 roll date is December 14, 2026, four days before the December 18 expiration.
Related lesson: A step-by-step guide to the futures rollover
Reading the Contract Symbol Before You Trade
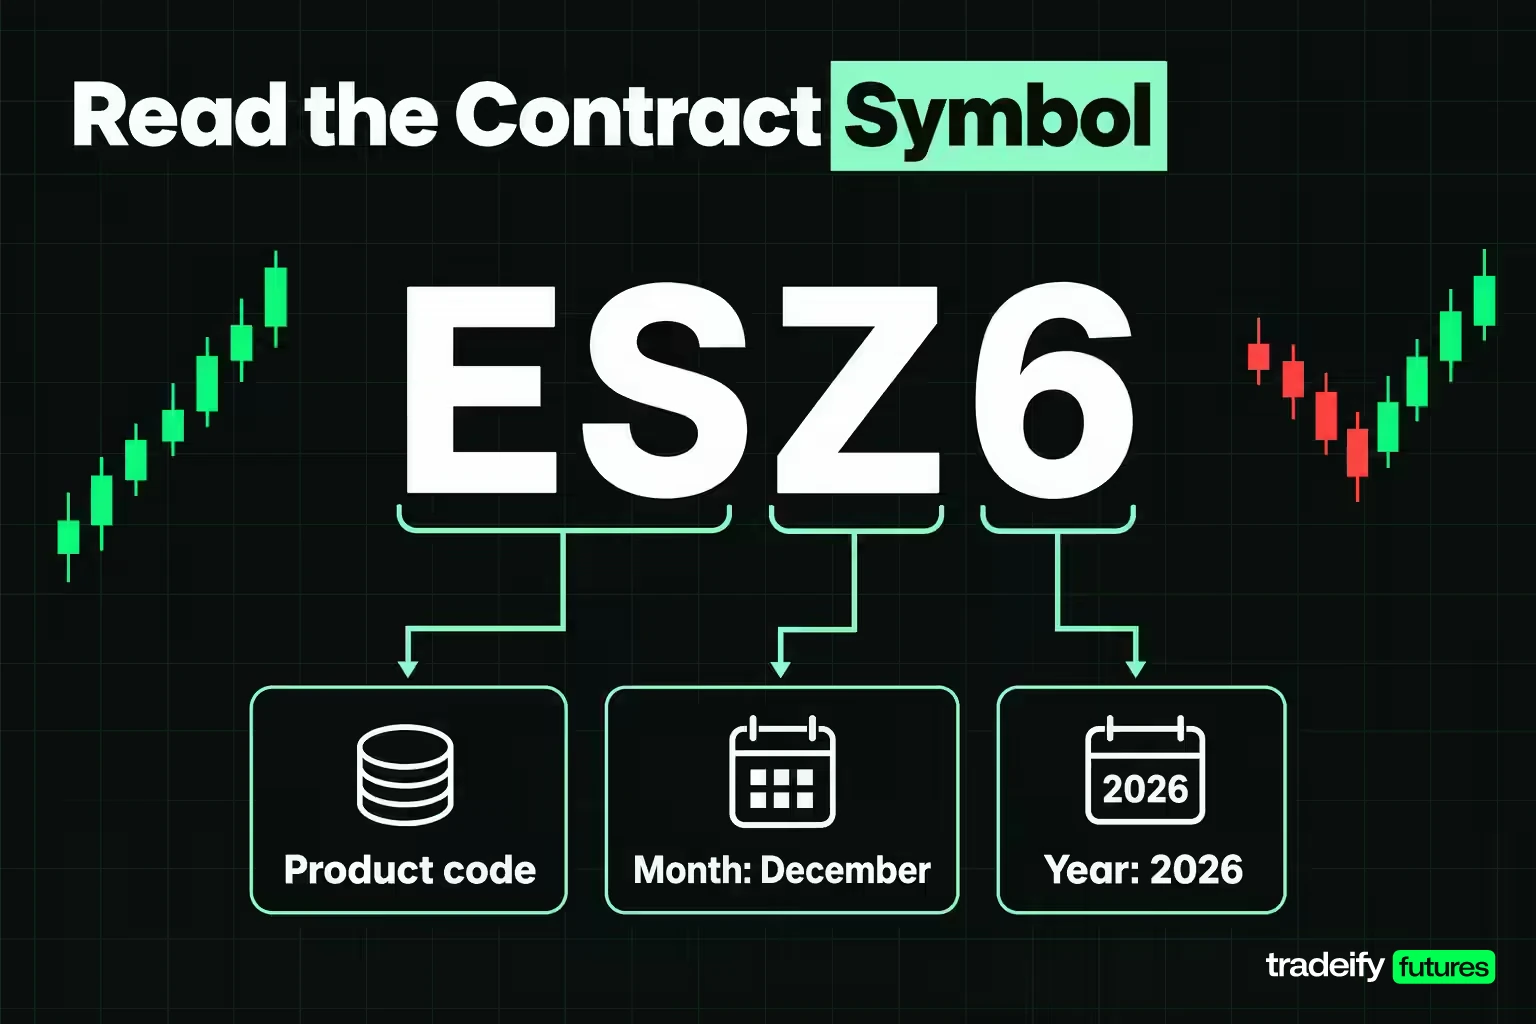
The volume check tells you which contract is active. The symbol tells you which contract your order is going to. CME's lesson on trading codes says a contract code is usually a one to three letter product code followed by characters for the month and year, and it warns that codes vary across platforms.
The month letters are the same everywhere CME products trade:
| Month | Code | Month | Code |
|---|---|---|---|
| January | F | July | N |
| February | G | August | Q |
| March | H | September | U |
| April | J | October | V |
| May | K | November | X |
| June | M | December | Z |
CME's own example builds ESF9 for the E-mini S&P 500 expiring in January 2019: ES, then F for January, then 9 for the year. The same logic gives ESZ6 or ESZ26 for December 2026, depending on whether the platform shows one or two year digits.
Three symbol habits cause most wrong-month trades:
- A root symbol with no month (just "ES") means the platform has picked a month for you. Check which one before sending an order.
- A continuous chart symbol stitches several contracts together. TradingView's 1! symbol, for example, follows the nearest contract, and TradingView says its switch to the next contract is mainly triggered by the next contract's daily volume exceeding the current one, using a per-symbol rule set from statistical averages. So the chart can switch on a different day from the one you would pick.
- Sierra Chart offers both date-rule and volume-based rollover for continuous charts, with volume-based rollover switching when daily volume becomes greater in the next contract. Two charts of "the same" product can therefore show different months near a roll.
Related lesson: How futures symbols and month codes are built
Active vs Deferred Contracts for Speculators and Hedgers
Trading a deferred month is not automatically a mistake. It is a choice, and it has a cost.
For short-term speculators, the active contract is nearly always the right one. The deferred month usually has wider spreads and less depth, so the same strategy pays more to get in and out. On CME settlement reports from October 29 to November 4, 2026, March 2027 ES traded between 3,655 and 6,882 contracts a session, against more than 1.5 million in December every session.
A deferred month makes sense when the trade is about that month. A trader with a view on next spring's crop, for example, may prefer March corn to December corn. Corn's March 2027 contract is also a real market, not a ghost. On CME settlement reports, its share of December plus March volume rose from 35.0% to 38.2% between October 29 and November 4, 2026, as December's first notice day of November 30 came closer.
For hedgers, the rule is different. A hedger usually picks the month that matches the date of the exposure being hedged, then rolls if needed. Liquidity still matters, so a hedger with a date between two contract months often uses the more active of the two and accepts some mismatch.
Related lesson: How a calendar spread between two months is built
Common Mistakes When Choosing the Active Contract
Most wrong-contract trades are not bad reads on direction. You can call the move correctly and still lose to the spread because the order went to the wrong month.
| Mistake | What happens | The check that catches it |
|---|---|---|
| Trading the nearest month by default | On products like gold you land in a month with a few hundred lots or less | Read volume by contract month before the first trade of the cycle |
| Assuming every product rolls on the same day | You stay in an expiring contract after its volume has left | Check each product's own handover, not a single date |
| Trusting a root symbol | The platform's default month may not be the active contract | Confirm the month letter and year on the order ticket |
| Copying levels from a continuous chart | Stops and targets sit at prices from a different month | Use levels from the chart of the contract you trade |
| Holding a deliverable contract into notice | Your broker may close it, or you face delivery rules | Know the first notice day as well as the last trading day |
| Judging a close race on intraday volume | The leader can change once the official figures land | Use the final settlement report or wait one more session |
The quietest of these mistakes is the platform default. A contract that is still quoted, still moving and still tradable feels the same as the one everyone else is in. Its volume, not its price, is the tell.
Active Futures Contract FAQ
How do you read a futures contract symbol?
Read it as product, month, year. ESZ6 is the E-mini S&P 500 (ES), December (Z), 2026 (6). Some platforms show the year as two or four digits, but the month letter means the same thing everywhere.
Is the active contract always the front month?
No. It usually is for products like the E-mini S&P 500, but products that list every month can have a near-empty front month. On November 4, 2026, November gold traded 17 contracts while December traded 232,561.
Can you hold a futures contract until it expires?
On most exchange contracts you can, but at expiry it is settled either in cash or by delivery. Many brokers close or restrict positions in deliverable contracts before first notice day, so check your broker's rules before planning to hold.
What are the month codes for each month?
F January, G February, H March, J April, K May, M June, N July, Q August, U September, V October, X November and Z December. The letter always follows the product code and comes before the year.
What is rollover in futures?
Rollover is closing a position in the expiring contract and opening the same position in a later month. Traders usually roll when volume moves to the next contract, and many do it as a single calendar spread order.
How often does the active contract change?
Once per expiry cycle for each product. For quarterly equity index futures that is four times a year, and for monthly energy contracts it is every month. The change happens on its own schedule for each product, so check each one separately.
Active Contract Choice on Intraday Accounts
Active contract choice gets simpler when no position survives the session. A day trader who is flat every evening never carries a position into the handover, so the only decision is which contract month to trade the next morning, and the volume check answers it.
On our accounts every position is closed by 4:45 PM ET and nothing is held overnight, so a roll simply means switching which contract month you trade in the next session. Our Help Center's rule of thumb is to trade the contract shown as the current Globex code on the CME calendar, and our supported platforms write the year differently: Tradovate, Rithmic, WealthCharts and NinjaTrader use the last digit (ESH7), while TradingView and Tradesea use the full year (ESH2027).
Futures trading involves substantial risk, and leverage means losses can exceed what you expect on a single trade. The volume figures, dates and settlement prices on this page describe exchange-listed contracts as of the sessions named and change every day, so confirm the current contract and its rules with the exchange and your broker before trading. Results on simulated or funded evaluation accounts are simulated and are not the same as live trading results. This page is education, not individual advice.


