




TL;DR: Ichimoku Cloud is a five-line indicator built from 9, 26 and 52-period range midpoints and read for trend, levels and momentum. Its cloud is drawn 26 bars ahead, so the band under today's daily candle was calculated about five weeks earlier. On five years of ES data, an all-bullish Ichimoku reading did no better than the market's own 10-session base rate.
The Ichimoku Cloud looks like it answers every question at once: trend, support, momentum and a signal. That is exactly where traders get caught. Five lines on one chart make it easy to find confirmation for whatever you already wanted to do, and the shaded band drawn to the right of price looks like a forecast. It is not one.
This guide takes the indicator apart so you can decide what it is good for before you build rules on it. You get the formulas, a line-by-line calculation on six real E-mini S&P 500 (ES) sessions, a displacement audit showing which old session each plotted cloud boundary came from, and a five-year count of how the cloud actually behaved on ES and E-mini Nasdaq-100 (NQ) futures.
What the Ichimoku Cloud Is
The Ichimoku Cloud, also called Ichimoku Kinko Hyo, is a chart overlay that tries to show trend direction, support and resistance, momentum and trade signals in one view. The Japanese name translates roughly as "one look equilibrium chart". It was developed by the Japanese journalist Goichi Hosoda and published in his 1969 book.
Strip away the Japanese names and the indicator is a range midpoint drawn several ways. Four of its five lines use the same arithmetic: take the highest high and the lowest low over a window, add them and divide by two. No weighting, no smoothing and no dependence on closing prices.
That one detail separates the Ichimoku Cloud from the moving average family. A moving average averages closes, so every new bar nudges it. A range midpoint only moves when a new high or low is set or an old extreme drops out of the window. Price can drift sideways for days without the Base Line budging, then one session through the 26-period high shifts it in a single step.
Traders use the cloud for four jobs:
- Trend bias, from where price sits against the cloud.
- Dynamic support and resistance, from the cloud edges and the Base Line.
- Momentum, from the relationship between the two fast lines.
- Confirmation, from the Lagging Span compared with older prices.
Those jobs overlap with ordinary level work. If the cloud edge lines up with a level you already marked, good. If it doesn't, the cloud is not automatically the one that's right.
Related lesson: Support and resistance
Ichimoku Cloud Components and Formulas
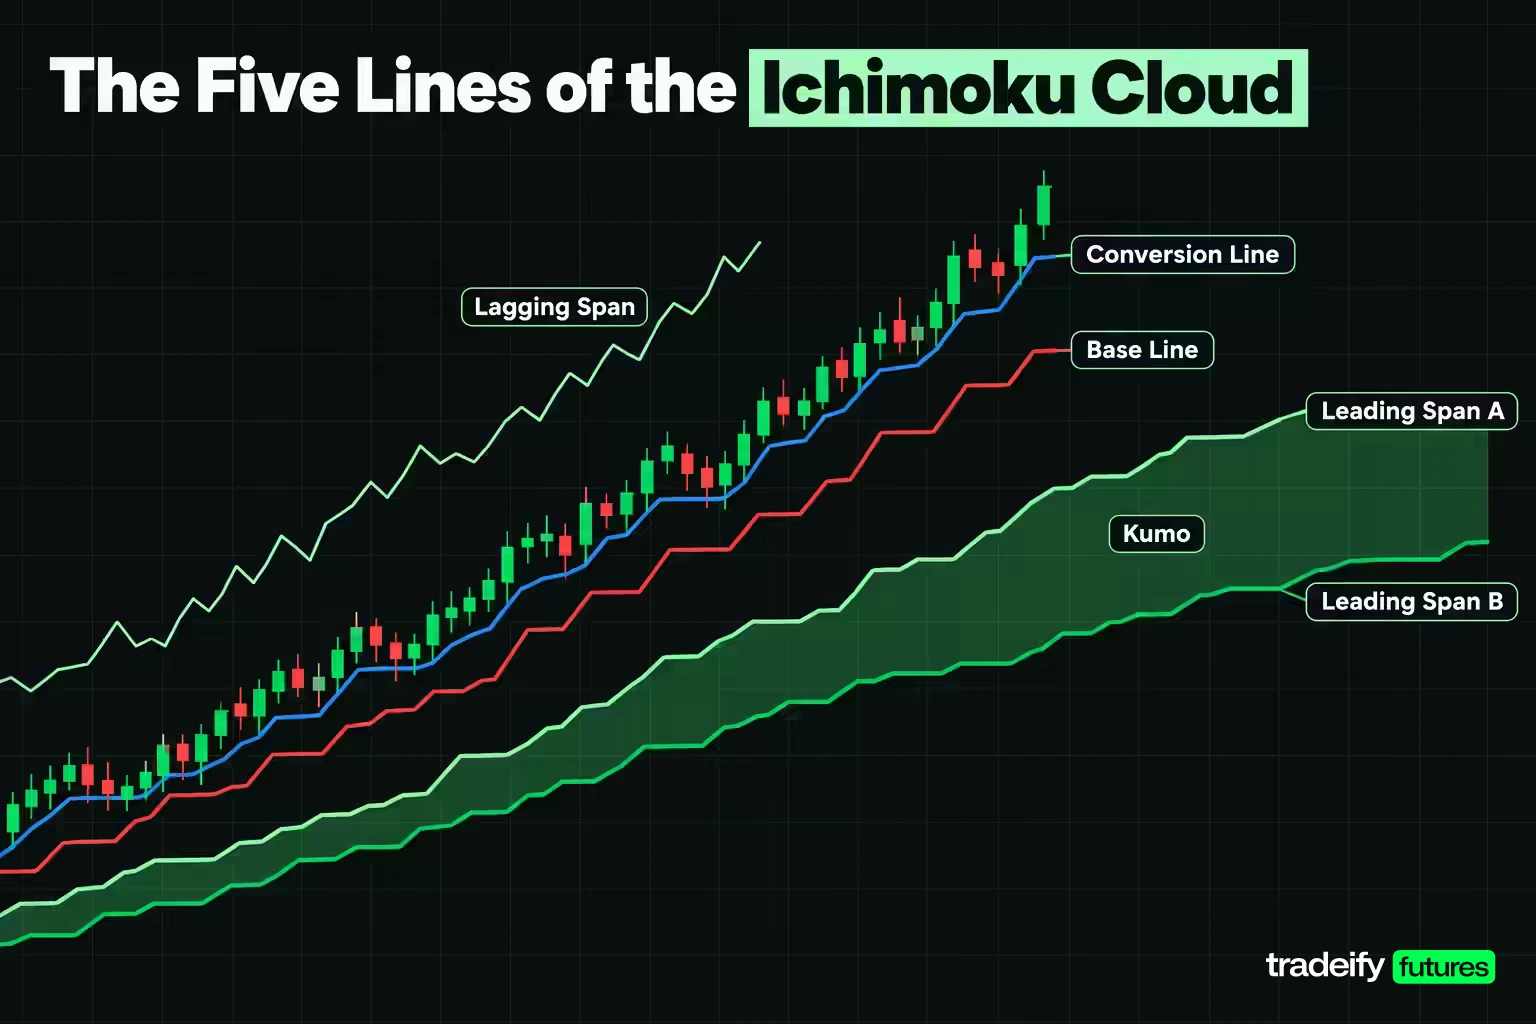
The Ichimoku Cloud has five plotted lines. Two of them form the cloud itself, and the shaded area between those two is called the Kumo.
| Line | Japanese name | Formula | Default setting | Where it is drawn |
|---|---|---|---|---|
| Conversion Line | Tenkan-sen | (9-period high + 9-period low) / 2 | 9 | On the current bar |
| Base Line | Kijun-sen | (26-period high + 26-period low) / 2 | 26 | On the current bar |
| Leading Span A | Senkou Span A | (Conversion Line + Base Line) / 2 | 9 and 26 | 26 periods ahead |
| Leading Span B | Senkou Span B | (52-period high + 52-period low) / 2 | 52 | 26 periods ahead |
| Lagging Span | Chikou Span | Current close | 26 | 26 periods back |
All default settings can be changed on most charting platforms. Some platforms tie the forward shift to the Base Line setting (StockCharts does), so a longer Base Line also pushes the cloud further ahead.
Tenkan-sen, the Conversion Line
The Tenkan-sen is the midpoint of the last 9 periods' high-low range. On a daily chart that is a little under two trading weeks. It is the fastest Ichimoku line and hugs price most closely, so it works as a short-term momentum gauge. A flat Tenkan-sen tells you the 9-period extremes have not changed, which usually means a short pause or a tight range.
Kijun-sen, the Base Line
The Kijun-sen is the midpoint of the 26-period high-low range, roughly a month of daily sessions. It is the trend anchor of the system. Many traders treat it as a fair-value line for the medium term: price far above it is stretched, price back at it is a pullback. The relationship between the Conversion Line and Base Line behaves much like a fast and slow moving average pair, and 9 and 26 are also the periods that appear in MACD.
Senkou Span A and Senkou Span B
Senkou Span A is the average of the Conversion Line and the Base Line, plotted 26 periods into the future. Because it inherits the two faster lines, it is the faster cloud boundary.
Senkou Span B is the midpoint of the 52-period high-low range, a little under three months of daily sessions, also plotted 26 periods ahead. It is the slower boundary and often sits flat for weeks, because a 52-period high or low takes a long time to roll out of the window. On ES it held at 7703.38 for every session from October 27 to November 3, 2026. When Span B finally moves, it usually means a two-to-three-month extreme has been replaced, which is a bigger event than a Conversion Line wiggle.
When Span A is above Span B the cloud is shaded green (bullish). When Span B is above Span A it is shaded red (bearish).
Chikou Span, the Lagging Span
The Chikou Span is simply the current close plotted 26 periods back. Its job is a comparison: is today's close above or below the price of 26 periods ago? A Chikou Span above the old price action supports a bullish read; below it supports a bearish read. It is the line traders hide first, and it is the cheapest confirmation in the system.
One practical consequence of the formulas: a fully formed cloud needs 52 bars for Span B plus 26 bars of forward shift, so 78 bars of history before the first complete cloud appears under price.
Calculating the Ichimoku Cloud on Six ES Sessions
Here is the Ichimoku Cloud arithmetic on six real ES daily sessions, October 27 to November 3, 2026, using Yahoo Finance's continuous ES futures series. Every value in a row comes from the highs and lows printed beside it. Midpoints that land on eighths of a point are rounded to two decimals.
| Session | 9-session high | 9-session low | Conversion Line | 26-session high | 26-session low | Base Line | Span A (live) | Span B (live) |
|---|---|---|---|---|---|---|---|---|
| Oct 27, 2026 | 7812.25 | 7648.50 | 7730.38 | 7897.50 | 7648.50 | 7773.00 | 7751.69 | 7703.38 |
| Oct 28, 2026 | 7819.50 | 7648.50 | 7734.00 | 7897.50 | 7648.50 | 7773.00 | 7753.50 | 7703.38 |
| Oct 29, 2026 | 7819.50 | 7648.50 | 7734.00 | 7897.50 | 7648.50 | 7773.00 | 7753.50 | 7703.38 |
| Oct 30, 2026 | 7819.50 | 7558.25 | 7688.88 | 7897.50 | 7558.25 | 7727.88 | 7708.38 | 7703.38 |
| Nov 2, 2026 | 7819.50 | 7558.25 | 7688.88 | 7897.50 | 7558.25 | 7727.88 | 7708.38 | 7703.38 |
| Nov 3, 2026 | 7819.50 | 7546.00 | 7682.75 | 7897.50 | 7546.00 | 7721.75 | 7702.25 | 7703.38 |
Take November 3. The Conversion Line is (7819.50 + 7546.00) / 2 = 7682.75. The Base Line is (7897.50 + 7546.00) / 2 = 7721.75. Span A is (7682.75 + 7721.75) / 2 = 7702.25. Span B uses the 52-session high of 7897.50 and low of 7509.25, so (7897.50 + 7509.25) / 2 = 7703.38, and it did not change once in these six sessions.
Two things stand out. First, the lines move in steps. ES fell 140.25 points close to close on October 30 and printed a low of 7558.25. That one new low entered both the 9-session and 26-session windows, so the Conversion Line and the Base Line dropped on the same day after sitting flat for three sessions. Second, by November 3 the live Span A had slipped just below the live Span B, by about one point. On a live calculation the cloud had just turned red.
That red reading is not what you would have seen under the November 3 candle. The cloud on screen was still green, because the plotted Ichimoku Cloud is shifted 26 sessions forward and the band under November 3 was computed from September 28 data.
Ichimoku Cloud Displacement and What the Plotted Cloud Reads
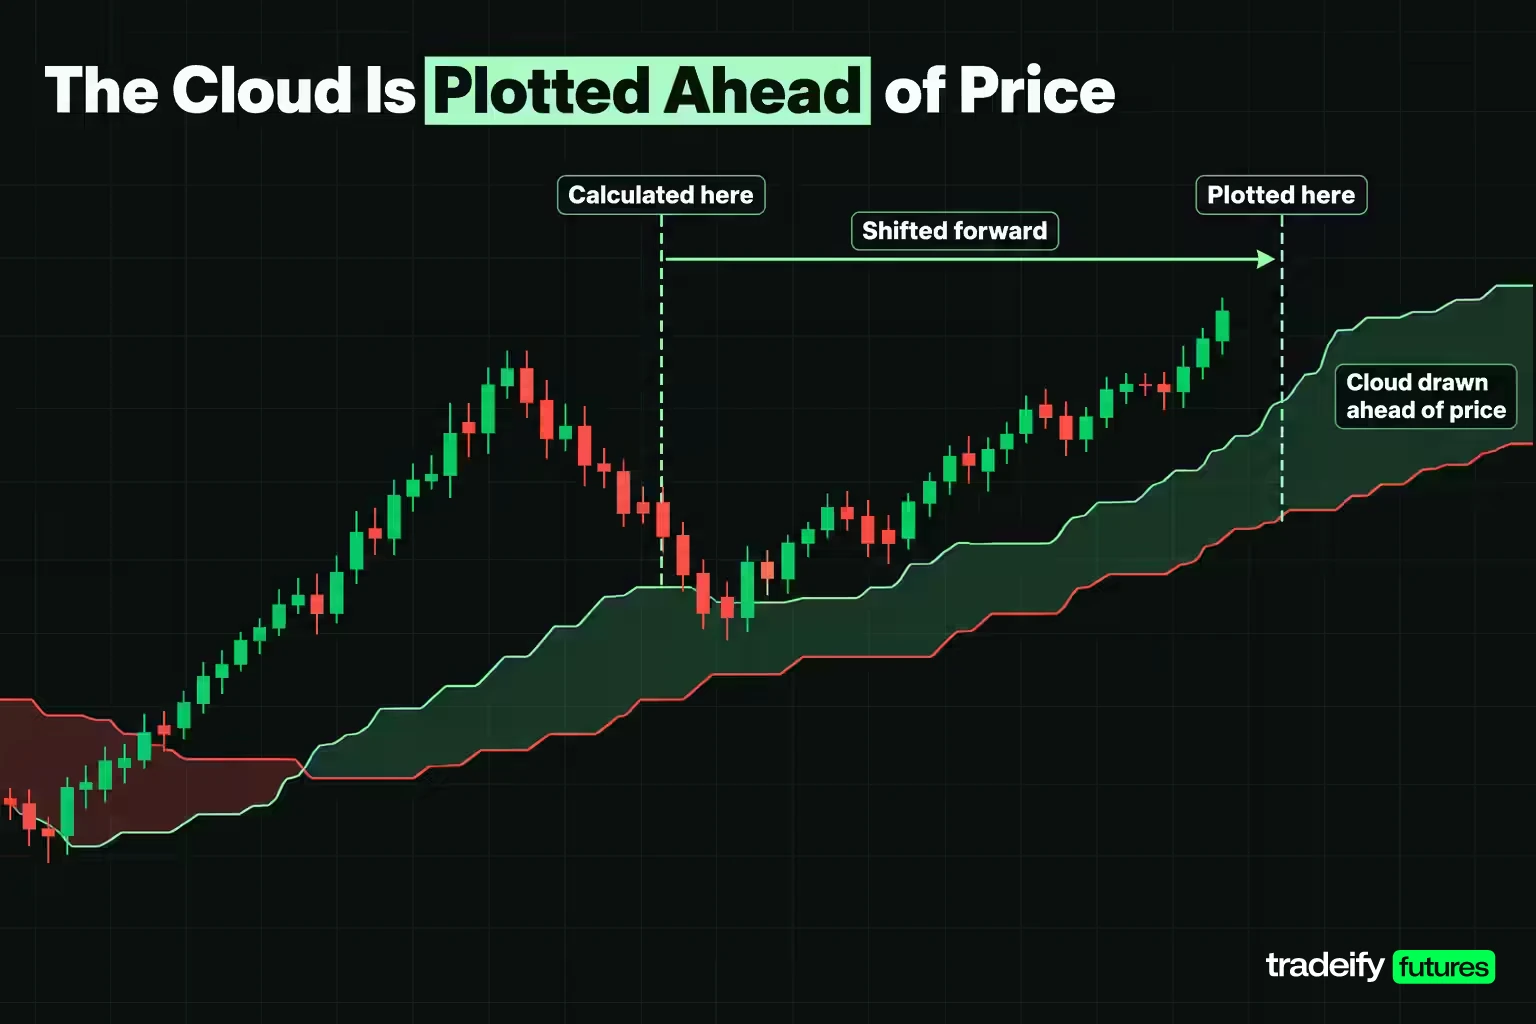
The Ichimoku Cloud is not drawn where it is calculated. Span A and Span B are both shifted 26 periods forward, so the band under any candle was computed 26 bars earlier. On a daily chart that is roughly five calendar weeks. The cloud under November 3, 2026 came from the September 28, 2026 session.
The table pairs the same six ES sessions with the boundaries actually plotted beneath them and names the session each boundary came from.
| Session | ES close | Plotted Span A | Plotted Span B | Computed on | Close vs plotted cloud | Live cloud colour |
|---|---|---|---|---|---|---|
| Oct 27, 2026 | 7758.25 | 7678.25 | 7585.63 | Sep 21, 2026 | Above | Green |
| Oct 28, 2026 | 7783.25 | 7678.88 | 7586.25 | Sep 22, 2026 | Above | Green |
| Oct 29, 2026 | 7754.25 | 7678.88 | 7586.25 | Sep 23, 2026 | Above | Green |
| Oct 30, 2026 | 7614.00 | 7678.88 | 7586.25 | Sep 24, 2026 | Inside | Green |
| Nov 2, 2026 | 7574.50 | 7678.88 | 7586.25 | Sep 25, 2026 | Below | Green |
| Nov 3, 2026 | 7596.75 | 7678.88 | 7586.25 | Sep 28, 2026 | Inside | Red |
Reading the ES cloud break of November 2, 2026
Now read the six ES sessions the way a trader would have lived them, one session at a time. Through October 29, ES closed comfortably above a green cloud. On October 30 it dropped into the band. On November 2 it closed 11.75 points below the plotted cloud bottom of 7586.25, a "breakdown" worth $587.50 per ES contract at $50 per point. On November 3 it closed back inside.
So was that a bearish cloud break? It depends which line you ask. The plotted band said price had fallen out of a green cloud. The live calculation for the same day said the range had already turned red. The Lagging Span said the November 3 close of 7596.75 was 150.00 points below the September 28 close of 7746.75. Three readings, three slightly different stories, and the plotted one is five weeks old.
None of this is a bug. The forward shift is meant to show where the recent range may act as support or resistance in the future. The cost is that every cloud signal quietly asks two questions: where is price against a band from five weeks ago, and does that old band still describe the market?
How often the plotted and live clouds disagree
Across the five-year sample (1,179 ES and 1,179 NQ daily sessions, February 28, 2022 to November 3, 2026), the gap between the plotted cloud and a live calculation for the same day was routine, not occasional.
| Displacement measure | ES | NQ |
|---|---|---|
| Median gap, plotted vs live boundary, in points | 142.31 | 668.75 |
| Median gap as % of price | 2.68% | 3.88% |
| Sessions where plotted colour differs from live colour | 381 | 465 |
| Share of sessions with a colour mismatch | 32.3% | 39.4% |
About one ES session in three showed a cloud colour on screen that the current range no longer supported. On NQ it was closer to two in five. That does not make the cloud wrong. It makes cloud colour a lagging regime filter with a 26-bar delay built in, and it is worth knowing that before you write a rule like "only buy above a green cloud".
Reading the Kumo by Position, Colour and Thickness
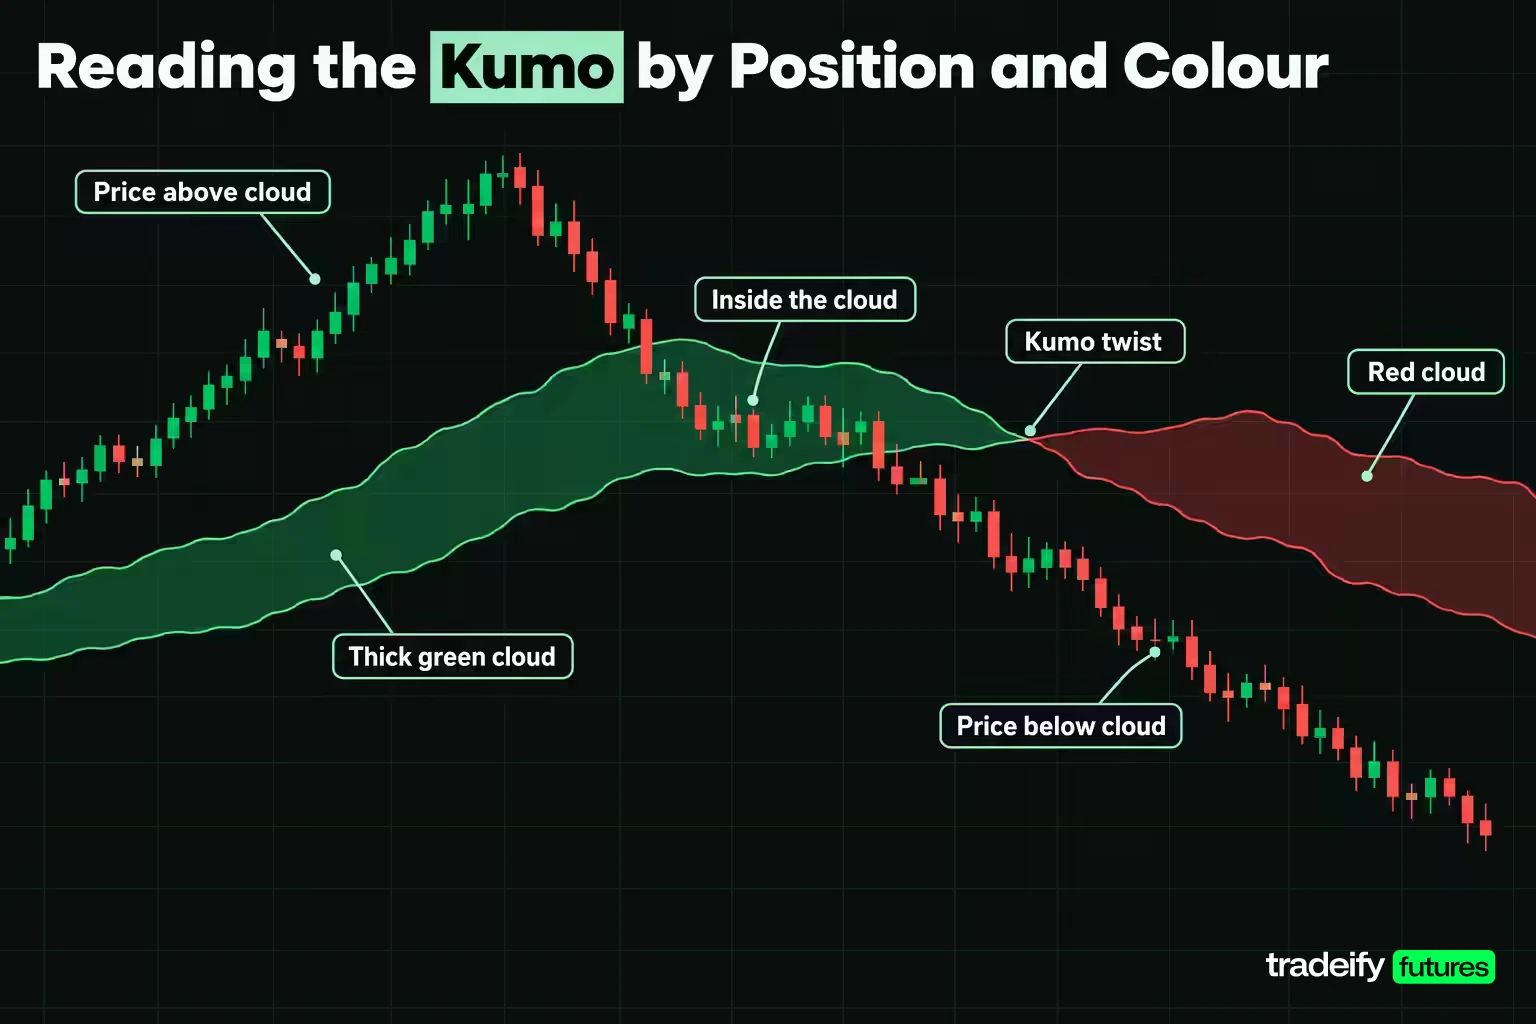
The Kumo is the shaded band between Span A and Span B, and most Ichimoku Cloud analysis starts there. It is read in three ways.
Position. Price above the cloud is read as an uptrend, below it as a downtrend, and inside it as a flat or transitioning market.
Colour. A green cloud (Span A on top) supports a bullish bias; a red cloud (Span B on top) supports a bearish one. A change of colour is called a Kumo twist.
Thickness. A thick cloud is read as stronger support or resistance, because price has to travel further to get through it. The area around a twist, where the two spans cross, is thin and is generally treated as weak support or resistance.
Kumo position and thickness on ES and NQ
Here is how those three Kumo properties behaved on daily ES and NQ futures from February 28, 2022 to November 3, 2026, in this guide's own count from Yahoo Finance daily data (1,179 sessions each).
| Kumo measure | ES | NQ |
|---|---|---|
| Closed above the cloud | 821 sessions (69.6%) | 728 sessions (61.7%) |
| Closed inside the cloud | 113 sessions (9.6%) | 173 sessions (14.7%) |
| Closed below the cloud | 245 sessions (20.8%) | 278 sessions (23.6%) |
| Inside-cloud episodes | 34, median 2 sessions, longest 14 | 48, median 2 sessions, longest 27 |
| Kumo twists | 21 | 27 |
| Median cloud thickness, % of price | 1.86% | 2.51% |
| Thickest cloud in the sample | 7.86% | 9.90% |
| Median thickness within 5 sessions of a twist | 0.65% | 0.75% |
A few practical reads come out of that.
Price rarely lives inside the cloud on a daily index chart. In this guide's five-year count from Yahoo Finance daily data, ES spent 9.6% of sessions there, usually for about two sessions at a time. If your rule is "stand aside while price is inside the cloud", it is a sensible rule, but on daily ES it will not keep you out of many trades.
The twist warning holds up in the same count. Near a twist, ES cloud thickness ran at 0.65% of price, about a third of the 1.86% median. The level a twist creates sits in the thinnest part of the band, so a twist is better read as "the regime may be changing" than as a level to lean on.
Thickness is also relative. A median ES cloud of 1.86% of price is about 100.56 points, while the median ES daily range in the sample was 66.25 points. A normal day does not cross a typical cloud, but two or three bad days can. That is what happened between October 29 and November 2, 2026.
How to Read Ichimoku Cloud Signals
Ichimoku Cloud signals come in four families, plus one confirmation check. The standard reading, as set out in StockCharts' ChartSchool, pairs each bullish signal with a bearish mirror image.
| Signal | Bullish version | Bearish version | What it measures |
|---|---|---|---|
| Cloud breakout | Price closes above the cloud | Price closes below the cloud | Trend |
| Kumo twist | Cloud turns from red to green | Cloud turns from green to red | Change within the trend |
| Price and Base Line | Price crosses above the Base Line | Price crosses below the Base Line | Momentum |
| TK cross | Conversion Line crosses above the Base Line | Conversion Line crosses below the Base Line | Momentum |
| Chikou confirmation | Close above the price of 26 periods ago | Close below the price of 26 periods ago | Confirmation |
The location of a signal matters as much as the signal. A TK cross is usually graded by where it happens:
- Strong: a bullish TK cross with price, the Conversion Line and the Base Line all above the cloud (or the bearish mirror below it). Fidelity describes this as a reinforced buy or sell signal.
- Neutral: the cross happens inside the cloud.
- Weak: the cross runs against the cloud, such as a bullish cross below a red cloud.
The Chikou Span is the tie-breaker many traders skip. If the cloud and the TK cross say "up" but today's close is still below the price of 26 sessions ago, the market has not yet proved it is higher than where it was a month ago.
What TK crosses did on ES and NQ
The grading sounds tidy. This guide counted how many TK crosses each grade produced on daily ES and NQ from February 2022 to November 2026 (Yahoo Finance daily data, own calculation), and how often price closed higher 10 sessions later. In the same data, the base rate for any 10-session window was 60.6% higher on ES and 59.2% on NQ.
| TK cross and location (own count, Yahoo Finance data) | ES events | ES higher after 10 sessions | NQ events | NQ higher after 10 sessions |
|---|---|---|---|---|
| Bullish cross above the cloud (strong) | 16 | 50.0% | 15 | 66.7% |
| Bullish cross inside the cloud (neutral) | 5 | 80.0% | 5 | 40.0% |
| Bullish cross below the cloud (weak) | 4 | 50.0% | 5 | 60.0% |
| Bearish cross below the cloud (strong) | 4 | 50.0% | 7 | 71.4% |
| Bearish cross inside the cloud (neutral) | 4 | 75.0% | 4 | 66.7% |
| Bearish cross above the cloud (weak) | 14 | 61.5% | 12 | 75.0% |
Read the event counts before the percentages. In this count, sixteen strong bullish crosses in five years is about three a year on daily ES, and samples of four or five events say almost nothing. A strong ES cross was followed by a higher close 50.0% of the time, below the 60.6% base rate. Nothing in that table supports treating a strong TK cross as a trigger on its own. It is context: momentum lining up with the trend, which still needs an entry, a stop and a reason the trade is wrong.
Related lesson: Moving average crossovers
Ichimoku Cloud Trading Strategies
Most Ichimoku Cloud trading strategies combine the cloud's standard signals (a close through the cloud, a TK cross between the Conversion Line and Base Line, price crossing the Base Line, and Chikou Span confirmation) with a rule for timing. Three cover nearly every version you will see.
Trend pullback to the Base Line
This Ichimoku strategy is the three-step method set out in StockCharts' ChartSchool, and it is the most disciplined of the common versions.
- Set the bias. Bullish when price is above the lowest line of the cloud; bearish when it is below the highest line.
- Wait for a correction. For longs, price dips below the Base Line; for shorts, it bounces above it.
- Take the signal when price turns back. For longs, price moves back above the Conversion Line; for shorts, back below it.
The order matters, and the three conditions rarely line up on one bar. What invalidates it: price closing through the far side of the cloud, which removes the bias the trade was built on.
Cloud breakout with confirmation
A cloud breakout trade usually needs three conditions together:
- Price closes through the cloud after spending time inside or on the other side of it.
- The Chikou Span is on the same side of the old price action.
- The cloud ahead (the live Span A and Span B) agrees with the breakout's direction.
This is the version that catches new trends. It is also the version that chops you up in a range. On ES, November 2, 2026 closed 11.75 points under the plotted cloud and the next session closed back inside it. That is what a weak breakout looks like. A minimum distance beyond the boundary, or a second close, filters some of these.
TK cross with a cloud filter
- Take only TK crosses in the direction of the cloud: bullish crosses above it, bearish crosses below it.
- Require the Chikou Span to agree.
- Enter on the next bar or on a pullback toward the Base Line rather than chasing the crossing candle.
The catch is frequency. On daily ES the strong bullish cross showed up 16 times in five years, so filtering this hard leaves very few trades. That is why the same logic is often applied to a faster chart, with the daily cloud kept for bias.
ChartSchool also suggests checking volume: a buy signal on expanding volume carries more weight than one on thin volume.
Ichimoku Stop-Loss and Risk Management
An Ichimoku Cloud trade still needs a stop that is decided before entry. The system offers several natural places for one, and each comes with a different distance and a different cost.
- The swing low (or high) before the signal. ChartSchool's suggestion for an initial stop: the low just before a buy signal, or the high just before a sell signal.
- The Base Line. A close back through the Kijun-sen means the medium-term midpoint has been lost. It is a common trailing reference because it moves in steps rather than every bar.
- The far edge of the cloud. The widest option. If price closes through the whole band, the trend read is gone.
- A volatility stop. Some traders place stops two ATRs (Average True Range) from price, and ChartSchool pairs the cloud with Parabolic SAR or ATR for trailing exits.
How far Ichimoku stops sit on ES
Stop distances are where daily-chart Ichimoku and short-term trading collide. On daily ES from February 2022 to November 2026 (this guide's count from Yahoo Finance data), the median distance from the close to the Base Line was 117.75 points. At $50 per point that is $5,887.50 per ES contract, or $588.75 per Micro E-mini (MES) contract at $5 per point. On days price closed above the cloud, the median distance to the cloud bottom was 336.5 points, or $16,825.00 per ES contract.
Two conclusions follow. First, if you use a daily Ichimoku level as your stop, size the position to that distance, not the other way round. The temptation is to keep the daily signal and quietly shrink the stop until the dollars look comfortable. That stop no longer sits anywhere the cloud says you are wrong. Work out the dollar risk to the level, compare it with the most you are willing to lose on one trade, and drop to micros or skip the trade if it does not fit. Second, a stop that is too wide for your account is not a reason to move it closer to an arbitrary number. It is a reason to use the daily cloud for bias and take entries and stops from a faster chart.
For exits, the cloud itself is a reasonable profit target reference when trading back toward it from outside, and the Base Line is the usual trailing line once a trend trade is working.
Related lesson: Average true range atr
Best Ichimoku Cloud Timeframes for Day Trading
The Ichimoku Cloud was built for slower charts. NinjaTrader's guide notes it was developed originally on weekly data, and the default windows only mean "two weeks, one month, two months" on a daily chart. On an intraday chart they mean something much shorter.
| Chart | 9 bars | 26 bars (Base Line and forward shift) | 52 bars (Span B) |
|---|---|---|---|
| Daily | About two trading weeks | About five calendar weeks | A little under three months |
| 1-hour ES | About 9 hours | Just over one 23-hour session | About two and a quarter sessions |
| 5-minute ES | 45 minutes | 2 hours 10 minutes | 4 hours 20 minutes |
ES trades on CME Globex from Sunday 6:00 PM to Friday 5:00 PM ET, with a daily break from 5:00 PM to 6:00 PM ET, so an hourly ES chart prints about 23 bars a session.
Ichimoku cloud crossings per session by timeframe
The meaning of the Ichimoku Cloud changes with the window, and so does the noise. This guide ran the same cloud-crossing count on ES at three timeframes using Yahoo Finance data.
| ES timeframe | Sample | Price closes through the cloud | Kumo twists | Bars inside the cloud |
|---|---|---|---|---|
| Daily | 1,179 sessions, Feb 2022 to Nov 2026 | 43 in total, about one every 27 sessions | 21 in total | 9.6% |
| 1-hour | 252 sessions, Nov 2025 to Nov 2026 | 1.09 per session on average | 0.55 per session | 13.4% |
| 5-minute | 47 sessions, Aug 2026 to Nov 2026 | 14.32 per session on average | 7.3 per session | 15.2% |
On a 5-minute chart, price crossed the cloud about 14 times a session and the cloud changed colour about seven times. That is not a trend filter. It is a band that price oscillates through. On the hourly chart, crossings drop to about one a session, which is closer to how the cloud is meant to be read.
For day traders, the most defensible set-up is to use the cloud on the hourly or daily chart for bias and levels, then take entries from a faster chart with its own trigger. If you do keep a cloud on a fast chart, its levels (the Base Line and the cloud edges) hold up better as reference points than its crosses, which fire many times a session.
Related lesson: Multiple timeframe analysis
Ichimoku Cloud Settings and Variants
The default Ichimoku Cloud settings are 9, 26 and 52, with a 26-period shift. The usual explanation is that Hosoda built them around the Japanese business week of his time, which included Saturdays: 9 as a week and a half, 26 as a month of trading days, 52 as two months. Treat that as the commonly reported rationale rather than a documented rule.
Because those numbers are tied to a calendar, some markets get adapted settings. For crypto, which trades around the clock every day, guides such as Binance Academy describe 10/30/60 as a common adjustment and 20/60/120 as a slower variant for higher timeframes. Other variants keep the defaults but change how the cloud is plotted, add strength tiers to crosses, or hide some lines to reduce clutter.
For futures, there is no single better setting. If you change one:
- Change one parameter at a time and keep the ratios roughly intact, or Span A and Span B stop meaning fast and slow.
- Check whether your platform moves the forward shift with the Base Line or keeps it as a separate input.
- Judge the change on a sample you did not use to pick it. Settings tuned to the last three months are curve fit by definition.
- Prefer a different timeframe over exotic settings. Moving from 5-minute to hourly bars changes the cloud more, and more predictably, than moving from 9/26/52 to 20/60/120.
Ichimoku Cloud Performance on Five Years of ES and NQ
The question behind most Ichimoku Cloud searches is whether it works. That depends on the rule, so here is a plain measurement of the two rules most guides describe, with the event counts left in.
Method. Daily bars for the continuous ES and NQ futures series from Yahoo Finance, read on November 4, 2026. Default settings (9, 26, 52, shift 26). The sample runs from February 28, 2022 (the first session with a full plotted cloud) to November 3, 2026: 1,179 sessions per instrument. Forward results are close-to-close changes 5, 10 and 20 sessions after the signal. A "cloud cross" is the first close above (or below) the plotted cloud after a close that was not. This is a description, not a backtest: no entries, stops, fills, commissions or slippage are modelled, and the continuous series splices contract months together at each roll.
Ichimoku cloud breaks against the base rate
The table compares each cloud break with the base rate for any session in the same ES and NQ data.
| Signal | Instrument | Events | Higher after 5 sessions | Higher after 10 sessions | Higher after 20 sessions | Median 10-session change |
|---|---|---|---|---|---|---|
| Any session (base rate) | ES | 1,179 sessions | 58.0% | 60.6% | 65.2% | +0.84% |
| Close above the cloud | ES | 27 | 63.0% | 70.4% | 70.4% | +1.43% |
| Close below the cloud | ES | 16 | 60.0% | 53.3% | 53.3% | +0.64% |
| Any session (base rate) | NQ | 1,179 sessions | 58.0% | 59.2% | 64.1% | +0.98% |
| Close above the cloud | NQ | 30 | 55.2% | 57.1% | 55.6% | +0.76% |
| Close below the cloud | NQ | 25 | 50.0% | 50.0% | 58.3% | -0.20% |
The most recent ES and NQ breaks (November 2 and October 30, 2026) had no forward data yet, so the measured counts at each horizon are one or two lower than the event column.
In this five-year count, upward ES cloud breaks looked better than the base rate at 10 sessions (70.4% versus 60.6%), from 27 events. Downward breaks did not deliver much downside: on ES more than half were followed by a higher close 10 sessions later, and on NQ it was a coin flip. In an index that rose for most of the sample, a close below the cloud often marked a pullback rather than the start of a downtrend.
The all-aligned Ichimoku reading
The other popular Ichimoku rule is to trade only when everything agrees. This guide measured it on the same Yahoo Finance ES and NQ daily data. The bullish version: price above the cloud, Conversion Line above Base Line, Chikou Span above the price of 26 sessions ago, and the cloud ahead green.
| All-aligned state (own count, Yahoo Finance data) | ES | NQ |
|---|---|---|
| Bullish-aligned sessions | 639 (54.2%) | 586 (49.7%) |
| Higher 10 sessions later | 59.3% | 61.2% |
| Base rate, any session | 60.6% | 59.2% |
| Bearish-aligned sessions | 194 (16.5%) | 205 (17.4%) |
| Higher 10 sessions later | 62.9% | 58.9% |
In that count, on ES, a fully bullish Ichimoku reading was followed by a higher close 10 sessions later 59.3% of the time, slightly below the 60.6% base rate for any session. A fully bearish reading was followed by a higher close 62.9% of the time, with a median 10-session gain of +1.78%. On these two indexes over this window, "everything lines up" described the trend that had already happened. It did not sort the next two weeks into better and worse.
That matches how the cloud compares with moving averages and MACD. All three are built from past prices and describe a trend after it starts; none of them knows the future. The cloud's real advantage is organisational: it puts trend, levels and momentum on one chart in a consistent way. Any edge has to come from the rest of your plan: where you enter, where you are wrong, and how much you risk.
Ichimoku Cloud Advantages and Limitations
The Ichimoku Cloud earns its place on many futures charts, but it carries real costs.
Advantages
- One view of trend, momentum and levels, read the same way on any market or timeframe.
- Dynamic support and resistance from the Base Line and cloud edges, which update as new extremes form.
- Built-in confirmation layers: a signal can be graded by the cloud, the TK relationship and the Chikou Span.
- Range midpoints react to new highs and lows decisively, which can make the Base Line a cleaner trailing reference than a moving average.
Limitations
- Clutter. Five lines plus a shaded band crowd a chart, which TradingView's own help page acknowledges.
- Lag. Everything comes from past data; the forward-plotted cloud predicts nothing, it only displaces old values.
- Mixed signals. The November 2 to 3, 2026 ES sessions showed plotted cloud, live cloud and Chikou Span disagreeing on the same day.
- Distance. When price runs far from the cloud, the cloud stops being useful as a level, and the faster lines carry the read.
- Few clean signals on slow charts and too many noisy ones on fast charts.
As for whether it is the most powerful indicator: no indicator earns that title in general. The right question is which job you need done. For trend bias on a daily or hourly chart, the cloud is a strong, compact choice. For timing entries, it is usually too slow on its own.
Common Ichimoku Cloud Mistakes
Most Ichimoku Cloud mistakes come from treating a descriptive tool as a predictive one.
| Mistake | What it looks like | Why it misleads |
|---|---|---|
| Reading the plotted cloud as current | Buying because price is above a green cloud | The cloud was computed 26 bars earlier; on ES the plotted colour disagreed with a live calculation on 32.3% of sessions |
| Ignoring the Chikou Span | Taking a breakout while today's close is still below the price of 26 bars ago | The market has not yet proved it is above where it was a month ago |
| Trading inside the cloud | Buying the top edge and selling the bottom edge of a thick band | Inside the cloud is the system's own "no trend" zone; signals there are graded neutral at best |
| Treating a twist as a level | Leaning on the point where Span A and Span B cross | Twists sit in the thinnest part of the band, about a third of median thickness on ES |
| Default settings on very short charts | 9/26/52 on 1 or 5-minute bars | On 5-minute ES, price crossed the cloud about 14 times a session, so the band measures noise |
| Counting a marginal close as a break | A close a few points through the cloud | A small close through the edge and a decisive one look identical on a colour rule; the ES close 11.75 points under the cloud reversed the next day |
| Ignoring the contract roll | Reading a 52-bar range across two contract months | A continuous futures chart splices contracts at each roll, so old extremes can come from a different contract price |
The last one is easy to miss on futures. ES rolls quarterly, so for weeks after each roll the 52-session window mixes two contract months. On a continuous chart that is not back-adjusted, the price gap between those contracts becomes part of the range the cloud measures.
Ichimoku Cloud Pre-Trade Check
Run these five questions before acting on an Ichimoku Cloud reading.
- Which session was the cloud under price computed from? On a daily chart, today minus 26 sessions. Does that range still describe this market?
- Where did price close against the cloud top and bottom, and by how much? A close a few points through the edge is a different event from a close 60 points through it.
- How thick is the band, in points and as a percent of price, compared with the instrument's normal daily range?
- Is a twist within the last ten sessions? If so, discount any support or resistance in that spot.
- Does the Chikou Span agree, and does the cloud agree with the level work you already trust? A disagreement is information, not a tie to break by preference.
If the answers conflict, waiting is a valid decision. You can read the direction correctly and still have no trade. A conflict often means the band no longer describes the market in front of you.
On our accounts, every position is closed by 4:45 PM ET and nothing is held overnight, so a daily cloud signal can't become a multi-week hold with us. Use the daily or hourly cloud as context for the direction you trade within one session. If you chart on TradingView, it connects to our accounts through the Tradovate connection only.
Related lesson: Market structure highs lows and trends
Ichimoku Cloud FAQ
What is the success rate of Ichimoku?
There is no single success rate, because Ichimoku is a set of signals rather than one rule. In this guide's own count on five years of Yahoo Finance daily ES data, a fully bullish Ichimoku reading was followed by a higher close 10 sessions later 59.3% of the time, against a 60.6% base rate for any session. Any edge has to come from entries, stops and sizing built around the cloud.
What are the top 3 Ichimoku trading strategies?
The three most common are a trend pullback (bias from the cloud, a dip below the Base Line, then a turn back above the Conversion Line), a cloud breakout confirmed by the Chikou Span, and a TK cross taken only in the cloud's direction. Each needs a predefined stop and a reason the trade is wrong.
Which is the most powerful indicator in trading?
No indicator is the most powerful in general. Each answers a different question: the Ichimoku Cloud describes trend and levels, oscillators describe momentum, and volume tools describe participation. The useful choice is the tool that matches the job and the timeframe you trade.
What is the best time frame for the Ichimoku Cloud for day traders?
For day traders, the hourly chart is usually the fastest timeframe where the cloud still reads as a trend filter. On ES it averaged about one cloud crossing per session hourly, against about 14 per session on 5-minute bars. Many day traders read the cloud on the hourly or daily chart and take entries from a faster one.
Is the Ichimoku Cloud a leading indicator?
Only in appearance. The cloud is drawn 26 periods ahead of price, but every value in it comes from past highs and lows. It leads in position on the chart, not in information.
Does the Ichimoku Cloud work on futures?
Yes. It is a standard study on most futures charting platforms and can be applied to any futures market and timeframe. The usual cautions apply: the cloud reflects a range that already happened, and on continuous futures charts the contract roll can distort the 52-period range.
This article is for education only and is not investment advice or a recommendation to buy or sell any instrument. Futures are leveraged, and losses can build quickly and exceed what you expected to risk. The ES and NQ measurements are historical, cover one fixed window on two index futures, and do not predict future results. Evaluation and funded accounts at prop firms are simulated, and results there do not carry over directly to live trading.


