



TL;DR: The ATR indicator measures how far price travels per bar, not which way, so its real job is sizing stops and positions. Read it as a percent of price against its own past year, not as a raw number. On E-mini S&P 500 futures, a 1.5x daily ATR stop was reached from the open in under 5% of sessions.
The ATR indicator answers one question: how much ground is this market covering right now? It does not tell you whether to buy or sell. It tells you how wide a stop needs to be to sit outside normal noise, and how many contracts you can carry before that stop costs more than you planned to lose.
That sounds modest until volatility changes under you. As of the November 4, 2026 close, the 14-period daily ATR on E-mini S&P 500 futures (ES) was 101.65 points. Five sessions earlier it was 80.38. Same market, same rule, about 26% more travel per day, and every stop and position size built on the old number was quietly wrong.
This guide works through the ATR indicator with real futures data. You get the calculation bar by bar, what the settings actually change, how to read a value against its own history, and what happened when ATR stops were tested on five years of ES sessions.
What the ATR Indicator Measures
The ATR indicator, short for Average True Range, is a volatility measure created by J. Welles Wilder. He published it in his 1978 book New Concepts in Technical Trading Systems, the same book that introduced the RSI, the Parabolic SAR and the directional movement concept behind the ADX.
Wilder designed the ATR with commodities and daily prices in mind. Commodity futures often gap or make limit moves, and a volatility formula built only on each bar's high minus low misses that travel. The "true" in true range is the fix: it counts the distance from the previous close as well as the bar's own range.
The output is in price units. A 14-period ATR of 101.65 on ES means the average session over the last 14 sessions covered roughly 101.65 index points of true range. On a crude oil chart the same indicator reads in dollars per barrel, and on a currency chart in pips. That is why a raw ATR value only means something next to the price and the history of the same market.
Related lesson: What is volatility
ATR Measures Volatility, Not Direction
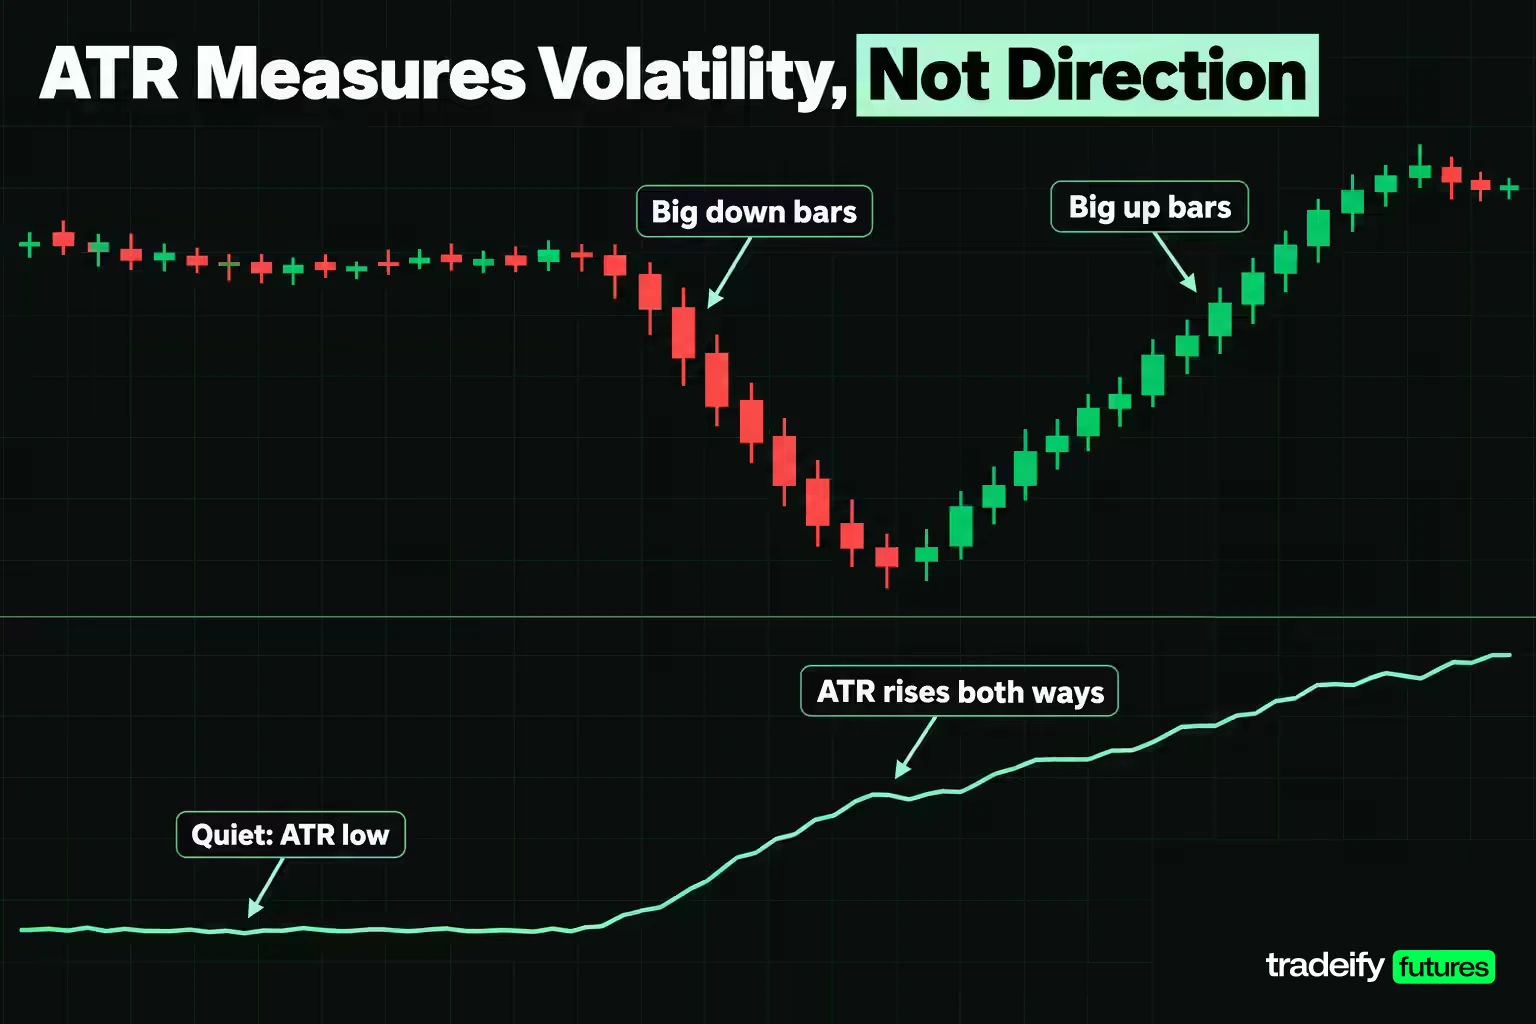
The ATR indicator uses absolute values, so a 100-point drop and a 100-point rally add the same amount to it. A rising ATR line says "bars are getting bigger." It says nothing about which way they are getting bigger.
The last week of the ES sample shows this clearly. On October 30, 2026 ES fell from a 7,754.25 prior close to a 7,558.25 low, a true range of 196.00 points. On November 4, 2026 it traded from 7,490.00 to 7,746.25 and closed up 123.75 points, a true range of 256.25. Both sessions pushed the ATR higher. One was a selloff and one was a rally.
Here is where traders usually get caught. A rising ATR during a breakout feels like confirmation, so it gets read as "the move is real." What it actually confirms is that the market is moving more, which also means a wrong-way trade will cost more.
Direction has to come from somewhere else:
- A trend measure such as a moving average slope or the ADX, which Wilder built to measure trend strength.
- Price structure: higher highs and higher lows, or a break of a defined range.
- A momentum oscillator for timing within a trend.
Then the ATR does the job it is good at, which is setting distance: how far away the stop goes, how far a target is realistic, and how big the position can be.
Related lesson: Average directional index ADX
How the ATR Indicator Is Calculated
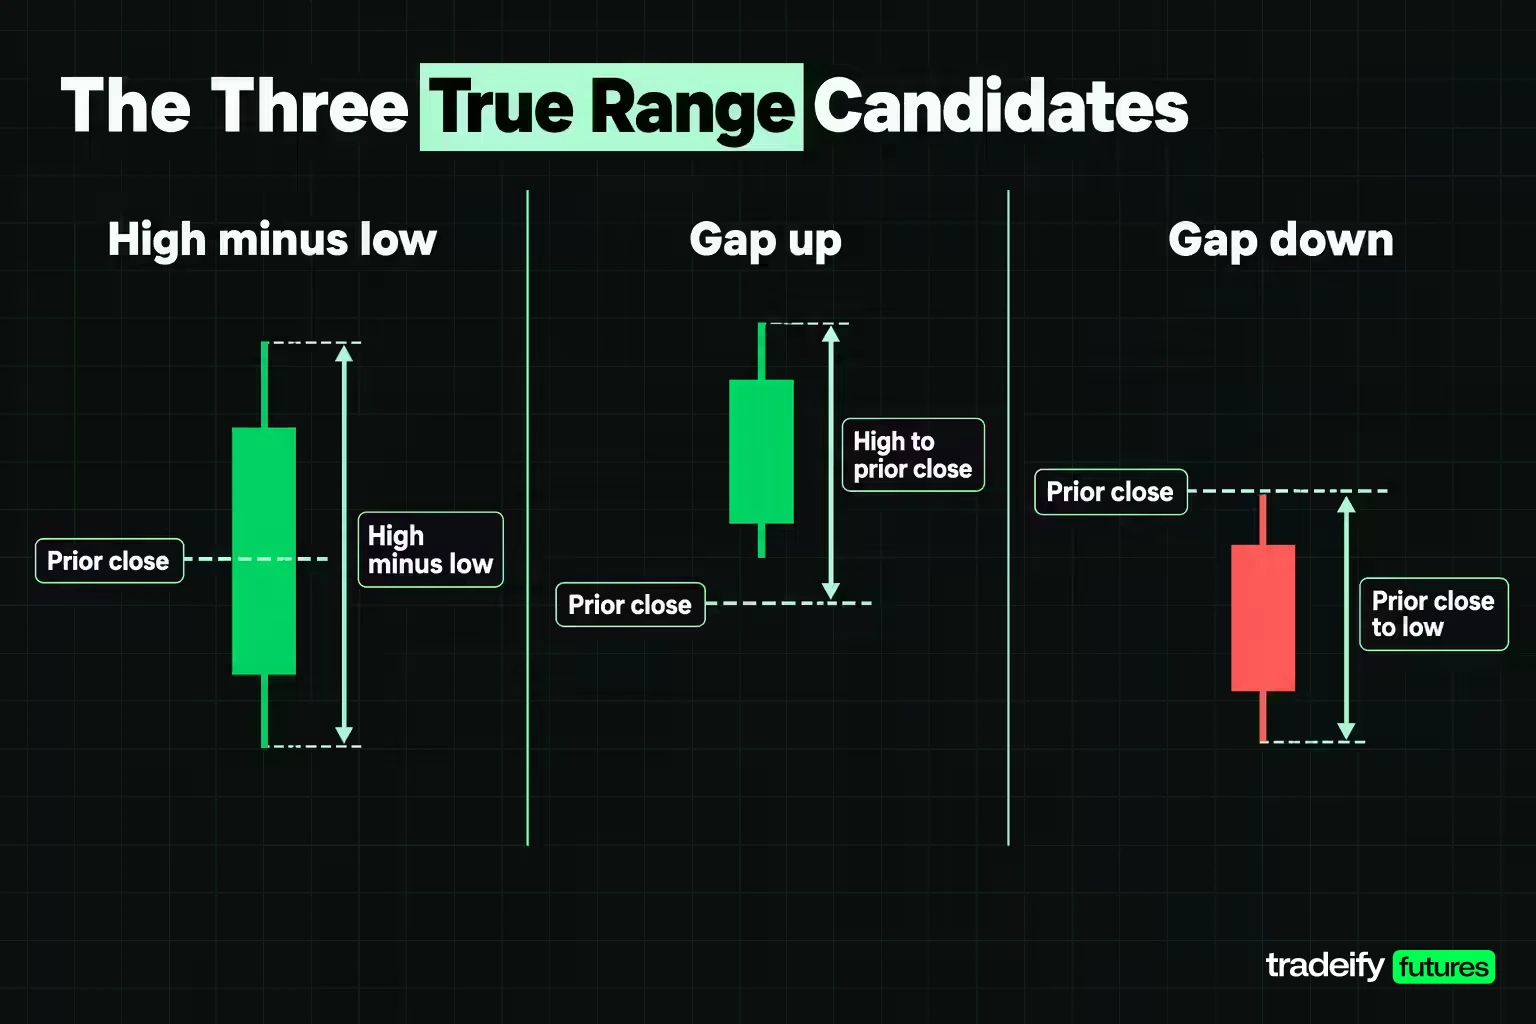
The ATR indicator is built in two steps. First each bar gets a true range. Then those true ranges are smoothed into an average.
True range and its three candidates
True range is the greatest of three values:
- The current high minus the current low.
- The absolute value of the current high minus the previous close.
- The absolute value of the current low minus the previous close.
The first candidate wins on most bars, because the previous close usually sits inside the current bar. The second wins after a gap up, when the previous close sits below the current low. The third wins after a gap down, when the previous close sits above the current high.
ATR true range worked on ten ES sessions
This table shows ten real ES daily sessions, October 22 to November 4, 2026, with all three candidates in points. The values come from Yahoo Finance's continuous front-month ES daily bars.
| Date | High | Low | Previous close | High minus low | High minus previous close | Low minus previous close | True range | Winning candidate |
|---|---|---|---|---|---|---|---|---|
| 2026-10-22 | 7,798.75 | 7,676.75 | 7,800.25 | 122.00 | 1.50 | 123.50 | 123.50 | Low minus previous close |
| 2026-10-23 | 7,714.25 | 7,648.50 | 7,704.50 | 65.75 | 9.75 | 56.00 | 65.75 | High minus low |
| 2026-10-26 | 7,739.50 | 7,651.75 | 7,659.75 | 87.75 | 79.75 | 8.00 | 87.75 | High minus low |
| 2026-10-27 | 7,772.75 | 7,699.75 | 7,714.50 | 73.00 | 58.25 | 14.75 | 73.00 | High minus low |
| 2026-10-28 | 7,819.50 | 7,750.25 | 7,758.25 | 69.25 | 61.25 | 8.00 | 69.25 | High minus low |
| 2026-10-29 | 7,773.75 | 7,709.50 | 7,783.25 | 64.25 | 9.50 | 73.75 | 73.75 | Low minus previous close |
| 2026-10-30 | 7,713.00 | 7,558.25 | 7,754.25 | 154.75 | 41.25 | 196.00 | 196.00 | Low minus previous close |
| 2026-11-02 | 7,693.75 | 7,570.75 | 7,614.00 | 123.00 | 79.75 | 43.25 | 123.00 | High minus low |
| 2026-11-03 | 7,623.75 | 7,546.00 | 7,574.50 | 77.75 | 49.25 | 28.50 | 77.75 | High minus low |
| 2026-11-04 | 7,746.25 | 7,490.00 | 7,596.75 | 256.25 | 149.50 | 106.75 | 256.25 | High minus low |
On October 30, 2026 the ES bar itself spanned 154.75 points, but the previous close was 41.25 points above the session high. True range counts that gap, so the session's travel was 196.00 points. A range-only measure would have understated it by about a fifth.
Wilder's smoothing, worked through five sessions
Wilder smoothed true range with a carried-forward average. For a 14-period ATR:
ATR today = (previous ATR x 13 + true range today) / 14
The very first ATR value is a plain average of the first 14 true ranges, because there is no previous ATR to carry. After that, each new bar gets a weight of one fourteenth and the old reading keeps the rest.
| Session | True range | Previous ATR | New ATR | Close |
|---|---|---|---|---|
| 2026-10-29 | 73.75 | 80.38 | 79.91 | 7,754.25 |
| 2026-10-30 | 196.00 | 79.91 | 88.20 | 7,614.00 |
| 2026-11-02 | 123.00 | 88.20 | 90.69 | 7,574.50 |
| 2026-11-03 | 77.75 | 90.69 | 89.76 | 7,596.75 |
| 2026-11-04 | 256.25 | 89.76 | 101.65 | 7,720.50 |
Check the October 30 row by hand: 79.91 x 13 is 1,038.83, plus 196.00 is 1,234.83, divided by 14 is 88.20. The table is computed from unrounded values, so a hand check with two decimals can land one cent off on some rows.
The design choice is visible in that row. A 196-point session, more than twice the ATR, lifted the reading by only 8.29 points. The ATR is built to drift, not jump.
Related lesson: Relative strength index RSI
How often the gap rule changes the ATR on futures
On Yahoo Finance's continuous ES daily bars from November 5, 2021 to November 4, 2026, calculated for this guide, true range exceeded the plain high minus low on 139 of 1,236 sessions, about 11.2%. The median extra distance on those sessions was 4.50 points, about 5.6% of the ATR at the time.
That is lower than many stock-market examples suggest, and the reason is the trading hours. ES trades nearly around the clock, so most "gaps" are absorbed overnight inside the daily bar. The big exceptions are real: on April 3, 2025 the ES session range was 149.50 points but the true range was 297.00, because the open sat far below the prior close.
ATR Indicator Settings and Platform Setup
The default ATR setting is 14 periods. TradingView and StockCharts both default to 14, and NinjaTrader describes the average as generally 14 days. StockCharts notes that Wilder often used an 8-period ATR in his own work. The period is the main choice the ATR indicator gives you, so it helps to see what it actually changes.
What the ATR period changes on ES
This table runs five ATR indicator periods through Yahoo Finance's continuous ES daily data, calculated for this guide. The percent figures divide ATR by the close and use the last 252 sessions, November 4, 2025 to November 4, 2026.
| ATR period | ATR on Nov 4, 2026 | ATR five sessions earlier | ATR percent on Nov 4, 2026 | Median ATR percent | 10th to 90th percentile | Average daily change |
|---|---|---|---|---|---|---|
| 7 | 120.09 | 81.56 | 1.56% | 1.17% | 0.88% to 1.76% | 4.7% |
| 10 | 109.65 | 81.19 | 1.42% | 1.20% | 0.90% to 1.72% | 3.3% |
| 14 | 101.65 | 80.38 | 1.32% | 1.22% | 0.94% to 1.65% | 2.4% |
| 21 | 94.45 | 79.71 | 1.22% | 1.24% | 0.99% to 1.56% | 1.7% |
| 28 | 91.14 | 79.97 | 1.18% | 1.25% | 1.02% to 1.51% | 1.3% |
The typical level barely changes with the period. The median runs from 1.17% at 7 periods to 1.25% at 28. What changes is reaction speed. After two large sessions, the 7-period ATR jumped about 47% in five sessions while the 28-period version rose about 14%.
So the choice is really about how fast you want the number to react:
- Short periods such as 7 or 10 react within days. Useful when you want stops to widen quickly after a shock, at the cost of more jumpy sizing.
- 14 is the common middle ground and what most published examples assume.
- Longer periods such as 21 or 28 hold steadier. One violent day will not double your stop overnight, but they lag when conditions really change.
The one thing not to do is cycle through periods until the ATR gives you the stop you already wanted. That turns a measurement into a justification.
Why two platforms can show different ATR values
Platforms agree on true range but not always on how the ATR indicator smooths it. TradingView's ATR uses a relative moving average (RMA, the same carried-forward method as Wilder) by default, with SMA, EMA or WMA selectable in the settings. NinjaTrader documents Wilder's formula with a smoothing constant of 1 divided by the period. MetaTrader 5 describes the ATR simply as a moving average of true range.
The difference is not trivial. On ES over the last 252 sessions, a 14-period Wilder ATR and a 14-period simple average of true range differed by 6.86 points on average, and by 26.45 points at the widest on June 25, 2026. As of November 4, 2026 the Wilder version read 101.65, the simple version 108.86 and a standard 14-period EMA 117.91.
Warm-up also matters. Because Wilder's average carries the past forward, the reading depends on where the calculation started. StockCharts calculates back at least 250 periods for that reason. On ES the difference was small once enough history was loaded: a version seeded only 40 sessions back read 102.24 against 101.65 from five years of history.
Adding the ATR indicator on common platforms
- TradingView: open the Indicators menu above the chart, search "Average True Range," and add it. The settings hold Length (14 by default) and the smoothing type.
- NinjaTrader 8: ATR ships as a built-in system indicator using Wilder's formula with a period input; add it to a chart from the indicators dialog.
- MetaTrader 5: Average True Range is listed under the oscillators in the indicator list; attach it to the chart and set the period.
Whatever the platform, match the ATR indicator's period and smoothing before you compare your reading with anyone else's.
Reading High, Low, Rising and Falling ATR Values
A raw ATR indicator value is hard to judge alone. ES at 101.65 points and crude oil at $4.96 per barrel tell you nothing until each is compared with its own price and its own history. The fix is ATR percent: ATR divided by the close, times 100.
ATR percent bands on ES over the past year
This table shows the distribution of the 14-period ATR percent on ES for the last 252 sessions, November 4, 2025 to November 4, 2026, next to the same figures for five years.
| Percentile | Last 252 sessions | Five years to Nov 4, 2026 |
|---|---|---|
| 5th | 0.92% | 0.89% |
| 25th | 1.03% | 1.03% |
| 50th | 1.22% | 1.29% |
| 75th | 1.42% | 1.81% |
| 95th | 1.76% | 2.67% |
| Highest | 1.97% | 4.19% |
As of November 4, 2026, ES's ATR percent was 1.32%, at about the 62nd percentile of the past year. That is busier than a typical session this year, but well short of a stress reading. The five-year high of 4.19% came on April 10, 2025, more than three times the current level.
What each reading means for a trader
- High ATR: bigger bars, more travel per session. Stops need more room and each contract carries more risk, so size usually has to come down.
- Low ATR: smaller bars. Tight stops can work, but targets also need to be closer, because the market is not traveling far.
- Rising ATR: conditions are getting more active, often around news, breakouts or selloffs. The stop you set last week may now sit inside normal noise.
- Falling ATR: conditions are calming. Size can come back toward normal only if your rules say so, not because a quiet week feels safe.
A reading only tells you where you are against recent history. It is not a forecast, and a market at the 95th percentile can stay there.
Low ATR in Flat or Ranging Markets
A low or falling ATR indicator reading usually shows a quiet market: small bars, tight ranges and often sideways price. MetaTrader 5's documentation describes low ATR values as typical of long sideways periods and consolidation, and TradingView notes that sustained sideways movement usually comes with low volatility, which can help spot trading ranges.
The popular extension is that compressed ATR "loads the spring" for a breakout. That claim is testable, so it was tested on ES.
A measured compression test on ES
Method: ES daily bars from Yahoo Finance's continuous futures series, November 2021 to November 2026, with a 14-period Wilder ATR calculated for this guide. A compression reading is any session where the ATR closed at its lowest level of the previous 50 sessions. The test compared the ATR ten sessions later with the ATR on the compression day.
- There were 160 compression readings.
- Ten sessions later the ATR was higher on 48.1% of them.
- Across all sessions in the same Yahoo Finance ES series, the ATR was higher ten sessions later 44.5% of the time.
- The median ten-session change was about flat in both cases: 0.99 times the starting level after compression, 0.98 times across all sessions.
So on this sample, a 50-session ATR low gave only a slight tilt toward expansion within two weeks. That is not nothing. It is also not a timing signal, and a quiet tape can stay quiet longer than a waiting trader's patience.
The practical reading: a low ATR tells you the market is quiet now, which suits range tactics and tighter stops. It does not tell you when the quiet ends. If you trade breakouts from compression, the trigger has to come from price breaking the range, and the ATR's job is sizing the trade once it does.
Related lesson: Range trading
Using the ATR to Time Entries and Exits
Timing with the ATR indicator is less about predicting a move and more about knowing when the market tends to travel. Intraday, that pattern is strong and repeatable.
ES intraday ATR by time of day
ES 5-minute bars from Yahoo Finance, August 27 to November 4, 2026, calculated for this guide, show how much travel changes across the day. This table gives the median true range of a 5-minute bar in each window, in index points (Eastern Time).
| Window (ET) | Median 5-minute true range |
|---|---|
| 11:30 PM | 1.75 |
| 3:00 AM | 3.50 |
| 9:00 AM | 4.00 |
| 9:30 AM | 8.38 |
| 10:00 AM | 7.75 |
| 11:00 AM | 6.00 |
| 2:00 PM | 4.25 |
| 3:30 PM | 5.25 |
| 4:30 PM | 2.00 |
The 9:30 AM cash open roughly doubles the size of a typical 5-minute bar compared with the half hour before it. A 14-period ATR on 5-minute bars captured that every time: its median reading was 4.15 points just before the 9:30 AM open and 6.57 points an hour later, higher on all 49 weekday sessions measured.
ATR timing rules for entries and exits
- Set intraday stops after the open has settled, or base them on an ATR that already includes open-hour bars. A stop sized on the quiet pre-open ATR can sit inside the first few minutes of normal noise.
- Expect smaller targets in the late overnight and lunch windows, where the ATR shrinks.
- Treat a sudden jump in the intraday ATR around a scheduled release as a reason to slow down, not as an entry signal.
- On exits, a target that was realistic at 1 ATR in the morning may be unrealistic by mid-afternoon if the ATR has faded.
On intraday charts, the ATR indicator is a clock as much as a ruler. Missing the open does not make the next bar a good entry. It makes it a different trade, at a different volatility.
Related lesson: Opening range breakout
ATR Stop-Loss Placement
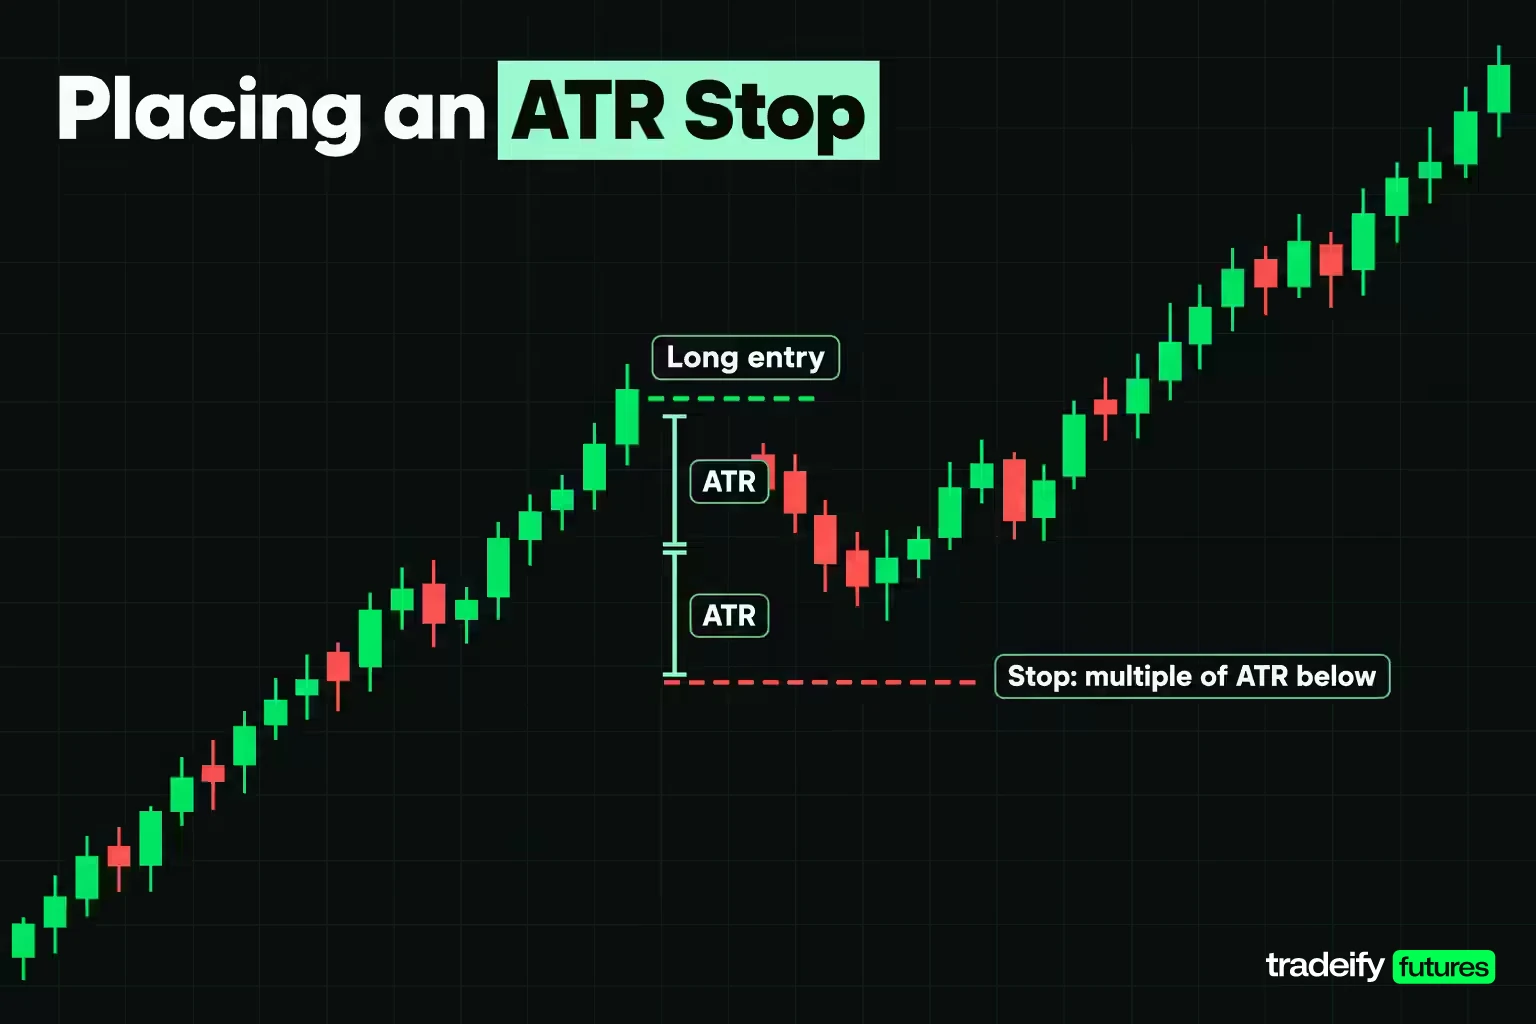
An ATR stop-loss uses the ATR indicator to place the stop a multiple of the ATR away from the entry, instead of a fixed number of points. The method is simple:
- Read the ATR on the timeframe you are trading.
- Choose a multiple before you look at the dollar risk, commonly between 1 and 3.
- Place the stop that many ATRs from the entry, below for a long and above for a short.
As of November 4, 2026, a 1.5x daily ATR stop on ES was 1.5 x 101.65 = 152.48 points, or $762.38 on one Micro E-mini S&P 500 (MES, $5 per point) and $7,623.75 on one ES ($50 per point). The same rule five sessions earlier would have been about 21% tighter.
How often ATR multiples were reached on ES
To see what the multiples mean in practice, every ES session from December 21, 2021 to November 4, 2026 (1,207 sessions, roll days excluded) was measured for this guide on Yahoo Finance's continuous daily futures data. Using the prior close's 14-period daily ATR, the test asked how often price traded at least that far from the session's opening price at some point in the same session.
| Distance from the session open | Reached below the open | Reached above the open |
|---|---|---|
| 0.5x ATR | 39.9% | 39.4% |
| 1x ATR | 14.5% | 9.9% |
| 1.5x ATR | 4.4% | 2.0% |
| 2x ATR | 1.0% | 0.4% |
| 3x ATR | 0.2% | 0.0% |
The median ES session's own range was 0.90 times the prior ATR, and only 40.3% of sessions had a range larger than 1 ATR. Downside excursions reached each multiple more often than upside ones over this period.
Two lessons come from that table. First, a 0.5x daily ATR stop sits inside a normal session's noise and was reached about four times in ten. Second, a 1.5x or 2x daily ATR stop was rarely reached inside one session, which sounds comfortable until you price it: 152.48 points on ES is a very large intraday loss for one setup.
That is the tradeoff. For a day trader, a daily-bar ATR stop is often too wide to be a real plan, so the ATR on the chart you actually trade (5-minute, 15-minute) usually makes more sense. The 5-minute ES ATR of 6.57 points an hour after the open makes a 1.5x stop 9.85 points, about $49.27 per MES.
One more trap: after a stop-out, the temptation is to widen the next stop so it "won't happen again." If the ATR has not changed, the stop should not either. Widening it only raises the dollar risk on the next trade.
An ATR stop is still a reference level, not a guaranteed fill. In a fast market or a gap, a stop order becomes a market order and can fill well beyond the level.
Related lesson: Stop-loss orders and placement
Position Sizing With the ATR Indicator
Position sizing with the ATR indicator flips the usual question. Instead of "how many contracts do I want," you ask "how many contracts can this stop afford?" The steps:
- Fix a dollar risk budget per trade before looking at the chart.
- Convert the ATR stop into points, then into dollars with the contract's point value.
- Divide the budget by the dollar risk per contract and round down.
An ATR sizing ladder on MES
This ladder applies ES's ATR percent bands from the last 252 sessions to the November 4, 2026 close of 7,720.50, with a 1.5x ATR stop and an illustrative $2,000 risk budget. Figures use MES at $5 per point and are computed from unrounded percentages. Commissions and slippage are excluded.
| ATR band | ATR percent | ATR in points | Stop at 1.5x ATR | Risk per MES | MES contracts for $2,000 |
|---|---|---|---|---|---|
| 5th percentile | 0.92% | 71.11 | 106.67 | $533.33 | 3 |
| 25th percentile | 1.03% | 79.51 | 119.27 | $596.33 | 3 |
| Median | 1.22% | 94.56 | 141.84 | $709.20 | 2 |
| 75th percentile | 1.42% | 109.56 | 164.34 | $821.70 | 2 |
| 95th percentile | 1.76% | 135.87 | 203.81 | $1,019.03 | 1 |
| Year's high | 1.97% | 152.17 | 228.26 | $1,141.28 | 1 |
Same budget, same rule, same market. Three contracts in a quiet band, one in a busy one. That is the point of ATR sizing. The dollar loss on a stopped trade stays roughly constant while the contract count absorbs the change in volatility.
The common failure runs the other way. A trader keeps the usual size when the ATR rises, and the dollar risk on every trade grows without anyone deciding it should. Recompute the size whenever the ATR band changes, not once a month.
Related lesson: Volatility based position sizing
ATR Indicator Trading Strategies
The ATR indicator rarely makes a strategy on its own. It shows up as the volatility engine inside other methods. Three common uses follow.
ATR trailing stops and the Chandelier Exit
The Chandelier Exit, developed by Charles Le Beau, uses the ATR indicator to hang a trailing stop a multiple of the ATR below the highest high (for longs) or above the lowest low (for shorts). StockCharts uses 22 periods and a 3.0 multiplier as the default, 22 being roughly a month of trading days.
Worked on ES as of November 4, 2026: the highest high of the last 22 sessions was 7,897.50, and the 22-period ATR was 93.81. The long exit sat at 7,897.50 minus 3 x 93.81, which is 7,616.07. ES closed at 7,720.50, about 104.43 points above it.
The exit rises as new highs print and widens or tightens as the ATR changes. It is designed to keep a position in a trend until a decline larger than normal volatility arrives. It is a swing-length tool on daily bars; an intraday trader would apply the same logic to intraday bars.
ATR volatility channels and breakout filters
Keltner Channels place bands a multiple of ATR around an exponential moving average, often 2 ATRs. A close outside the channel shows a move larger than recent volatility would normally produce. Some breakout traders use the ATR more simply as a filter: a breakout bar must travel more than 1 ATR, or price must clear the range by a fraction of the ATR, before it counts. That reduces entries on breaks that barely poke through a level.
ATR-based profit targets
Targets can be set in ATR units too, for example 1 or 2 ATRs from the entry. The ES stop test is a reality check here: the median ES session covered only 0.90 ATR of range, so a 2 ATR intraday target on daily ATR asks for an unusually large day. Targets built from the ATR on your trading timeframe tend to be more honest.
Each of these needs its own test on your market and timeframe. The ATR sets the distances. It does not supply the edge.
Related lesson: Keltner Channels
ATR Spikes and Potential Reversal Points
Some sources treat ATR indicator extremes as reversal warnings. MetaTrader 5's documentation, for example, says high ATR values often appear at market bottoms after panic selling and frames higher values as a higher probability of trend change. The idea is that a burst of volatility marks exhaustion.
Testing ATR spikes on ES
Two checks were run for this guide on Yahoo Finance's continuous ES daily data, November 2021 to November 2026.
- Spike bars: sessions with a true range at least 2.5 times the prior ATR. There were 14. In 9 of them, the close five sessions later was on the opposite side of the spike bar's close from the spike's own direction, so the move reversed more often than it continued.
- ATR highs: sessions where the 14-period ATR closed at its highest of the last 50 sessions. There were 102. Ten sessions later the ATR was lower on exactly 50.0% of them, with a median change of about zero.
The spike result leans toward reversal, but 14 events is a very small sample, and several clustered in the same few weeks of April 2025. The ATR-high result shows no reliable tendency for volatility to calm down within two weeks.
The honest takeaway is narrower than the folklore. An ATR spike flags that the market is stretched and that risk per contract just jumped. It is a reason to look for a reversal setup with tight risk control, not a reversal signal by itself.
Using the ATR Indicator Across Futures Markets
The ATR indicator works the same way in every market, but the numbers differ a lot, which is why ATR percent and dollars per contract matter more than points. This table uses 14-period daily ATR as of November 4, 2026, calculated for this guide from Yahoo Finance continuous futures data.
| Market | Close | ATR | ATR percent | Median ATR percent, last 252 sessions | ATR per standard contract | ATR per micro contract |
|---|---|---|---|---|---|---|
| E-mini S&P 500 (ES, MES) | 7,720.50 | 101.65 points | 1.32% | 1.22% | $5,083 | $508 |
| E-mini Nasdaq-100 (NQ, MNQ) | 28,566.75 | 667.57 points | 2.34% | 1.83% | $13,351 | $1,335 |
| WTI crude oil (CL, MCL) | $88.12 | $4.96 | 5.63% | 4.67% | $4,965 | $496 |
| Gold (GC, MGC) | $4,073.00 | $86.88 | 2.13% | 2.51% | $8,688 | $869 |
Point values: ES $50 and MES $5 per index point; NQ $20 and MNQ $2 per index point; CL 1,000 barrels and MCL 100 barrels; GC 100 troy ounces and MGC 10 troy ounces.
Three things stand out. Crude oil's ATR percent is far higher than the equity indexes'. Nasdaq futures sat near the top of their own year, at about the 86th percentile, while gold sat near the bottom, at about the 23rd. And one day of average travel on a single NQ contract was worth more than $13,000, which is why micro contracts exist.
How ATR gaps differ by market and session hours
The true range gap rule (counting distance from the previous close) mattered more in some markets than others. On five years of Yahoo Finance daily futures bars, calculated for this guide, true range exceeded the bar's own range on 11.2% of ES sessions, 11.6% of NQ, 15.8% of CL and 19.1% of GC. On an S&P 500 exchange-traded fund that trades regular stock-market hours, an earlier education study found the gap rule changed the true range on 200 of 500 daily bars (September 16, 2024 to September 15, 2026), roughly four bars in ten.
The pattern follows trading hours. Markets that trade nearly around the clock absorb most news inside the bar, while stocks gap between sessions. Spot forex and crypto trade almost continuously, so their daily ATR is mostly bar range, and the gap rule matters mainly around weekends.
Limitations of the ATR Indicator
The ATR indicator is reliable arithmetic. Its limits come from what it leaves out, and each one has caught traders who leaned on it too hard.
- It lags. On October 30, 2026 ES had a 196-point true range, but the 14-period ATR only moved from 79.91 to 88.20. The ATR tells you about the last few weeks, not the next hour.
- It has no direction. A rising ATR fits a crash and a melt-up equally well.
- It is absolute. Values cannot be compared across markets, or across very different price levels in the same market, without dividing by price.
- It depends on settings. Period, smoothing type and warm-up all change the reading, sometimes by more than 20 points on ES.
- Continuous charts can distort it. Continuous futures series switch from the expiring contract to the next one, and on a chart that does not adjust for the price difference between months, the roll day can show a "gap" that is not market travel. The ES data in this guide had 20 such roll sessions over five years; their true range was set to the bar's own range.
- It says nothing about where stops cluster or where liquidity sits. An ATR stop can still land just beyond an obvious level that everyone else is watching.
Common ATR Mistakes
| Mistake | What it looks like | The guard |
|---|---|---|
| Reading ATR as a direction signal | Taking a rising ATR as proof that a long is working | Use a trend or structure tool for direction; use ATR only for distance |
| Comparing raw ATR values | Judging ES's 101.65 against crude's $4.96 | Divide by price and compare ATR percent |
| Keeping size fixed as ATR changes | Same contract count in a quiet week and a wild week | Recompute size from the current ATR band before each session |
| Using a daily ATR stop for a day trade | A 152.48-point ES stop on a trade meant to last an hour | Use the ATR of the timeframe you trade |
| Tuning the period to get a wanted stop | Switching from 14 to 7 because the stop "looks better" | Pick period and multiple before looking at the dollar risk |
| Trusting the stop level as a guaranteed exit | Expecting a fill at the stop through a gap or fast market | Treat the level as a trigger and expect slippage |
| Ignoring the roll on continuous charts | A sudden ATR jump on an expiry week with no real move | Check whether the chart is back-adjusted and verify the jump on the contract you trade |
The guard behind all of these ATR indicator mistakes is a journal. Record the ATR percent and the stop distance on every trade, then check after a month whether your worst losses came from bad setups or from trades taken when volatility was outside your usual band.
Related lesson: How to keep a trading journal
Fitting ATR Stops Into a Single Trading Session
An ATR indicator stop only works if you can hold the position long enough for the stop to matter. A swing trader can give a trade a 1.5x daily ATR and several days. A day trader who must be flat by the close has one session. In this guide's ES test on Yahoo Finance daily data from 2021 to 2026, a 1.5x daily ATR distance was reached inside one session in under 5% of cases. In practice the session close, not the stop, ends most of those trades.
That is why intraday traders usually size from intraday ATR, and then check the result against any daily loss rule they trade under. If one stopped trade at the planned ATR distance would use most of a daily limit, the size is too big, whatever the chart looks like.
On our accounts, all positions are closed by 4:45 PM ET and nothing is held overnight, so an ATR stop has to fit inside one session. Our 50K Growth evaluation has a $1,250 daily loss limit and a maximum of 4 minis or 40 micros. As of November 4, 2026, one ES at a 1.5x daily ATR stop carried $7,623.75 of risk, about six times that limit, while one MES at a 1.5x 5-minute ATR stop carried about $49.27. You can chart the ATR on our supported platforms, including Tradovate, NinjaTrader, TradingView through Tradovate and WealthCharts.
ATR Indicator FAQ
What does ATR stand for in trading and what does it measure?
ATR stands for Average True Range. It measures how far price travels per bar, including gaps from the previous close, averaged over a set number of bars (14 by default). It measures volatility, not direction, in forex, futures, stocks and crypto alike.
What does ATR mean in government or outside trading?
Outside trading, ATR is an unrelated acronym whose meaning depends on the government agency, aviation body or field using it. On a trading chart or platform indicator list, ATR always means Average True Range, Wilder's volatility measure.
How do you see ATR in TradingView?
Open the Indicators menu at the top of the chart, search "Average True Range" and click it to add it in a pane under price. Open its settings to change Length (14 by default) and the smoothing type, which defaults to RMA.
How do you use ATR for a stop-loss?
Read the ATR on the timeframe you trade, multiply it by a multiple chosen in advance (often 1 to 3), and place the stop that distance from your entry. Then convert the distance to dollars with the contract's point value and size the position so the stopped loss fits your risk budget.
What is the best ATR setting for day trading?
For day trading, 14 periods on the chart you actually trade is a sensible default, since no single setting is best. On ES daily data, shorter periods reacted far faster while the typical level barely changed. Pick a period and multiple, then keep them long enough to judge them on real results.
Is a higher ATR good or bad?
Neither by itself. A higher ATR means more travel per bar, so more room for targets and more risk per contract. It is only "good" if your stop, target and size all adjust to it.
How is ATR different from average daily range?
Average daily range uses only each bar's high minus low. ATR also counts gaps from the previous close, so it always equals or exceeds the plain range. On nearly 24-hour futures the two are close most days, but on gap days ATR captures travel that the plain range misses.
These examples are for education only and are not a recommendation to trade any market. Futures are leveraged, and losses can build quickly and exceed what you expected to risk; stop orders can fill beyond their price in fast markets or gaps. The figures in this article come from historical data and mechanical calculations, exclude commissions, fees and slippage, and do not predict future results. Evaluation and funded accounts are simulated accounts. Nothing here is investment advice.


