



TL;DR: A moving average crossover is when a faster average crosses a slower one, and it confirms a trend rather than predicting one. Every average lags: a 50-period SMA or EMA averages 24.5 bars behind, a 200-period one 99.5 bars. Investtech found 50/200 buy signals beat the market by 5.8 points a year, rising-trend ones by 10.1. Death crosses and price crossing the 200-day showed no edge, and fast pairs whipsaw in ranges. Treat the cross as a trigger, then price the stop, size and cost before you trade it.
What a Moving Average Crossover Is
You see two lines cross on the chart and the urge is to act right now. Before you do, know exactly what the crossing measures.
A moving average crossover happens when two moving averages of different lengths swap places on a chart. The shorter average is the fast line, because it reacts sooner to new prices. The longer average is the slow line.
When the fast line crosses above the slow line, it is called a bullish crossover. When it crosses below, it is a bearish crossover. Price crossing above or below a single average is also read as a crossover, and that variant gets its own section in this guide.
The logic is simple. If recent prices have risen faster than older prices, the short average climbs above the long one. The crossing tells you the recent average has overtaken the older average. It does not tell you the move will continue.
That distinction matters more than any length setting you pick. A moving average does not predict direction, it describes the direction that already exists, and it lags because it is built from past prices. A crossover is two lagging lines agreeing that something has changed. Treat it as confirmation that arrives late, not as an early warning.
Charting platforms reduce the idea to a handful of inputs. The thinkorswim Moving Average Crossover study, for example, asks for two lengths, two average types (simple, exponential, weighted, Wilder's or Hull) and the crossing direction. Everything else in this guide is about choosing those inputs and deciding what to do when the lines cross.
Related lesson: Moving averages SMA vs EMA
Choosing SMA, EMA or WMA Lines
The average type changes how each bar inside the window is weighted, which changes how quickly the line reacts to a fresh move.
- Simple moving average (SMA). Every bar in the window gets equal weight, 1 divided by the length. On a 20-period SMA each bar counts 5.00%.
- Exponential moving average (EMA). The newest bar gets a weight of 2 divided by the length plus 1, and older bars fade gradually. A 20-period EMA puts 9.52% on the newest bar, nearly double the SMA. A 10-period EMA puts 18.18% on it.
- Weighted moving average (WMA). Each bar is weighted by its position, newest highest. A 5-period WMA multiplies the bars by 5, 4, 3, 2 and 1 and divides by 15.
How Much Lag Each Average Type Carries
Lag can be measured as the average age of the data inside the line. For an SMA of length n, that average age is (n minus 1) divided by 2 bars. For an EMA with the standard 2 divided by (n plus 1) multiplier, the algebra lands on the same (n minus 1) divided by 2 bars. A WMA comes in shorter, at (n minus 1) divided by 3 bars.
| Length | Average lag in bars, SMA or EMA | Average lag in bars, WMA | Newest-bar weight, SMA | Newest-bar weight, EMA |
|---|---|---|---|---|
| 9 | 4 | 2.67 | 11.11% | 20% |
| 20 | 9.5 | 6.33 | 5.00% | 9.52% |
| 50 | 24.5 | 16.33 | 2.00% | 3.92% |
| 200 | 99.5 | 66.33 | 0.50% | 1.00% |
So why does an EMA feel faster if its average lag matches the SMA? Because it puts much more weight on the latest bar. After a sharp move it turns sooner, while its long tail of older data keeps the average age the same. The WMA cuts the average age itself, at the cost of a jumpier line.
Which Average Type to Use for a Crossover
There is no correct type, only a tradeoff. Faster lines catch turns sooner and produce more false crosses. Slower lines filter noise and arrive later.
Start by keeping the type consistent across both lines while you test, so you know what changed when results change. Mixing an EMA fast line with an SMA slow line is allowed on most platforms, but it adds a variable you then have to account for in your testing.
The Double Crossover Method
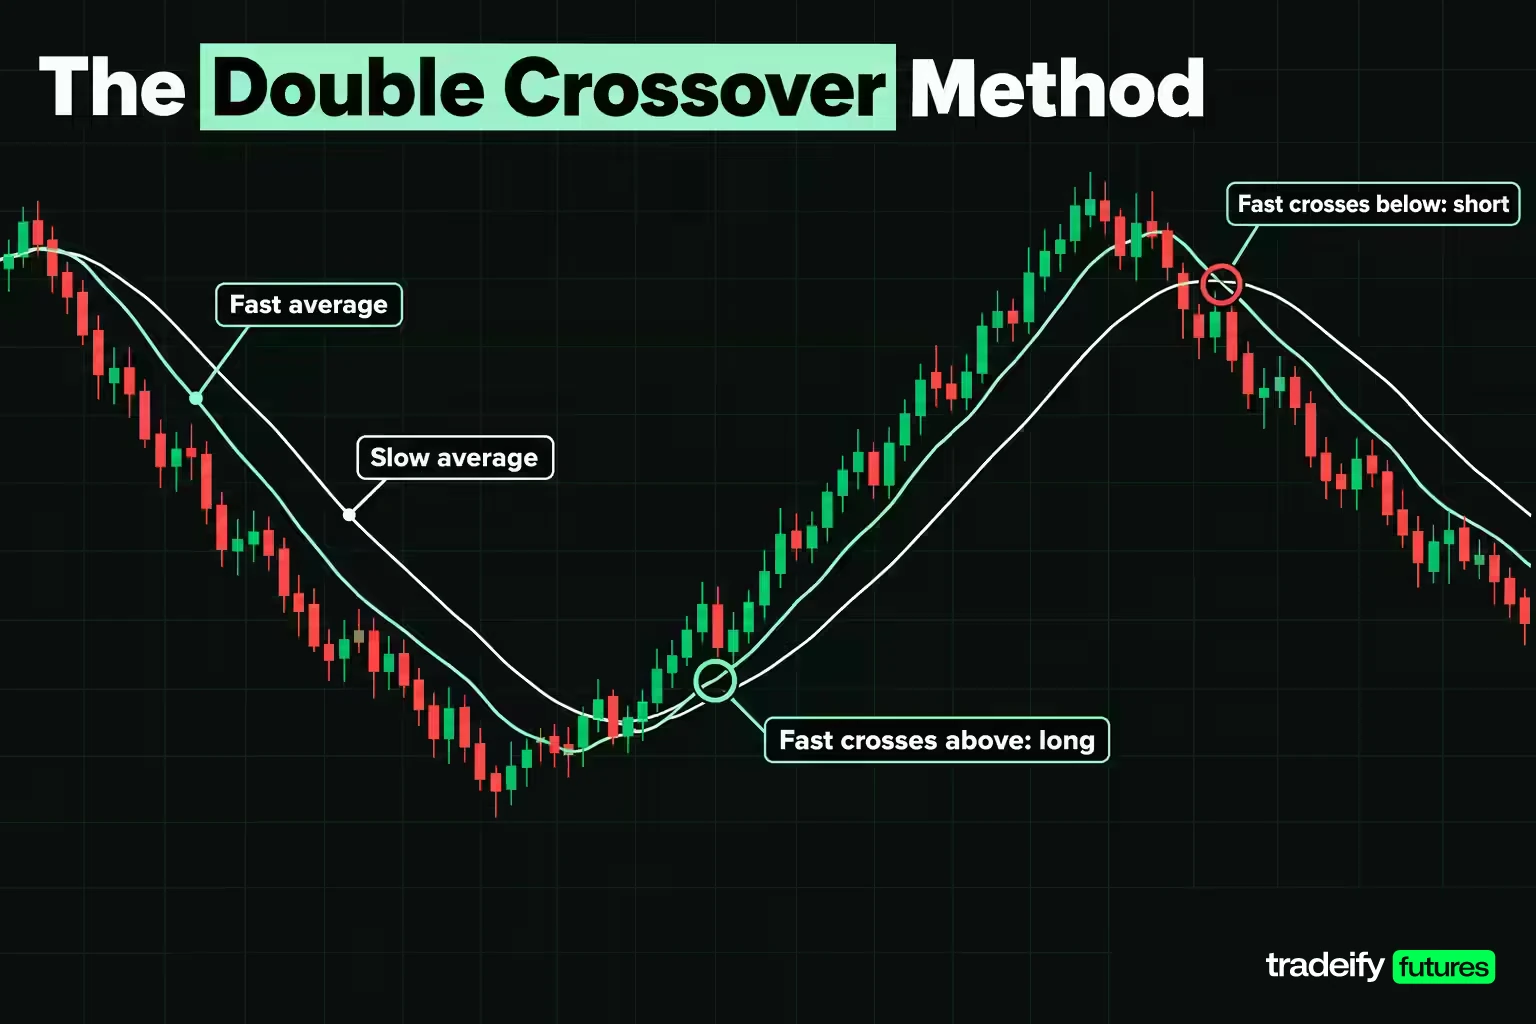
The double crossover method uses one relatively short average and one relatively long average, and the signal is the crossing between them. The general length of the pair sets the timeframe of the system. A 5-day EMA and 35-day EMA system is short-term. A 50-day SMA and 200-day SMA system is medium-term, perhaps long-term.
Here is how to set one up on any chart:
- Pick the timeframe you actually trade, then the fast and slow lengths for it.
- Plot both averages on closing prices, same type.
- Mark a long signal when the fast line closes above the slow line, and a short signal when it closes below.
- Decide in advance what you do with a signal, because the cross alone is not an entry plan.
Common Crossover Pairs and What They Measure
| Pair | Slow-line lag in bars | Typical use | What to expect |
|---|---|---|---|
| 9 and 21 EMA | 10 | Intraday momentum | Frequent signals, many reversals in quiet sessions |
| 12 and 26 EMA | 12.5 | The pair inside MACD | Same crossing as the MACD zero line |
| 20 and 50 | 24.5 | Short swing or intraday trend | Fewer signals, still prone to ranges |
| 50 and 200 | 99.5 | Long-term trend, golden cross | Rare, late, mostly a regime filter |
The 12 and 26 pair deserves a note. The MACD line is the 12-period EMA minus the 26-period EMA, so when MACD crosses its zero line, the 12 and 26 EMAs have just crossed. If you already run MACD, you already run an EMA crossover.
Shorter pairs are faster, generate more signals and give earlier entries, and they also generate more false signals than longer pairs. That is not a flaw to fix with a clever setting. It is the price of speed.
Related lesson: MACD indicator
Price Crossovers on a Single Moving Average
The simplest crossover uses one average and price itself. A close above the average is a bullish signal and a close below is bearish.
It reacts faster than a two-line crossover because price has no lag at all. That speed is also its weakness. Price wanders across a single average many times in a range, and each wander is a signal.
A cleaner way to use price crossovers is to split the jobs:
- The longer average sets the direction you are allowed to trade. If price is above a 200-period average, you only take long signals.
- The shorter average generates the signal. With price above the 200, you wait for a pullback below the 50 and act only when price closes back above it.
- Bearish crosses of the 50 inside that uptrend are treated as pullbacks, not as short signals.
Be careful with the 200-period line used alone. In Investtech's 2008 to 2020 study of Nordic stocks, price crossing above or below the 200-day average had no signal value, in either direction. The 200 earns its place as a direction filter more than as a trigger.
Golden Cross and Death Cross Crossovers
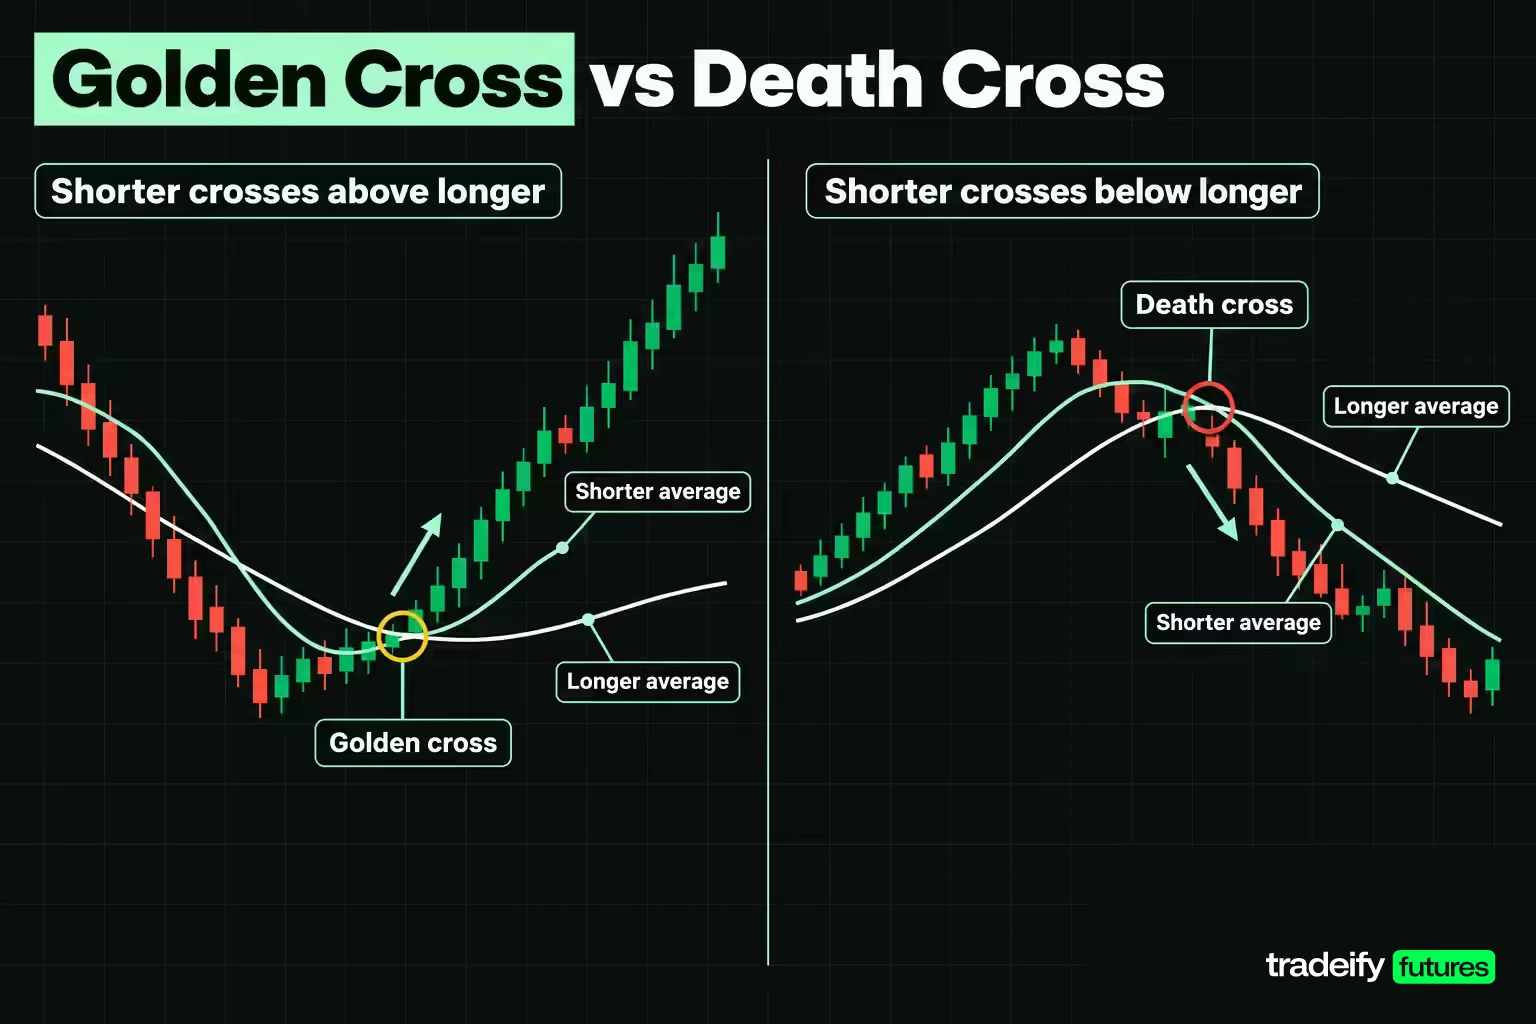
The golden cross is the 50-period average crossing above the 200-period average. The death cross is the 50 crossing below the 200. They are the most quoted crossovers because they show up in financial news on daily index charts.
Both are slow. The 200-period line carries about 99.5 bars of average lag, so by the time the cross prints on a daily chart, the move behind it is usually months old.
What a Large Golden Cross Study Found
Investtech, a Norwegian technical analysis research firm, with support from the Norwegian Research Council, tested 50-day and 200-day crossings on every listed stock in the Nordic countries from 1 January 2008 to 31 December 2020. That window included long uptrends, downtrends and sideways stretches. It measured returns over the 66 trading days after each signal against the market over the same period.
| Signal | Count | Finding after 66 days |
|---|---|---|
| Golden cross, all | 5235 buy signals | 4.56% return vs 3.06% benchmark, annualised excess of 5.8 percentage points |
| Golden cross, long average rising | Subset of the buy signals | Annualised excess of 10.1 percentage points |
| Golden cross, long average falling | Subset of the buy signals | No signal value |
| Death cross | 4451 sell signals | Low signal value; a separate write-up measured excess of -0.05 percentage points |
| Price crossing the 200-day | Both directions | No signal value |
Three readings follow from the Investtech results:
- The buy side carried measured value, but the T-value of 3.6 came with strongly correlated data, which the authors described as moderate significance.
- The value concentrated where the 200 was already rising. That makes the golden cross a trend-continuation filter, not a reversal call.
- The death cross did not predict weakness in Investtech's sample. Stocks with death crosses performed in line with the market.
This is one market, one period and stocks rather than futures. It is evidence about a signal, not a promise about the next one.
Triple Averages and Moving Average Ribbons
Moving average systems with more than two lines try to filter the weak signals a single pair produces. Two versions are common.
The Triple Crossover Method
A triple crossover uses three averages, such as 5, 10 and 20 periods. The signal comes when the shortest average crosses both longer ones. The middle line works as a confirmation step: the fast line crossing the middle line is an early warning, and the trade waits until the fast line clears the slow line too.
In exchange, you get fewer signals than a single pair of the same speed, and each signal arrives a little later.
Moving Average Ribbons
A ribbon plots several averages of steadily increasing length at once. You read the shape of the whole ribbon rather than any single cross:
- Lines fanned out and stacked in order (fastest on top in an uptrend) suggest a clean trend.
- Lines compressing together suggest the trend is losing momentum or a range is forming.
- Lines twisting through each other are a crossover cluster, and a cluster usually means a range.
Ribbons are good at showing regime, trend or no trend, at a glance. They do not remove lag. Every line in the ribbon is still an average of past prices.
Crossover Entry and Exit Rules
A crossover is a trigger. An entry plan also needs a stop, a target and a size, decided before the cross happens.
Entry Triggers for a Crossover Trade
- Act on a close, not a touch. Lines can cross intrabar and uncross by the close. Most platforms recalculate the current bar live, so wait for the bar to finish.
- Enter on the close of the signal bar or a small pullback after it. Missed it? Chasing three bars later adds lag on top of lag, and your stop is now further away for the same idea. Let it go and wait for the next one.
- Skip the trade if the slow line is flat. A flat slow average means a range, and ranges produce repeated crosses.
Stop Placement for a Crossover Trade
Three placements are common, and they answer different questions:
- Beyond the slow average. Exits if price moves back through the trend line.
- Beyond the swing point before the cross. Exits only if the structure that produced the cross fails. It is the stop that says the reading was wrong rather than early.
- A volatility stop, such as one ATR from entry. Sizes the stop to current noise rather than to a chart level.
Exit Rules for a Crossover Trade
You can exit at a fixed target, at the opposite crossover, or with a trailing stop. The opposite crossover is the classic system exit, and it gives back part of every trend because it arrives with the same lag as the entry. Fixed targets pay more often and cap the winners. Trailing stops sit between the two.
A Worked Crossover Trade on the Micro E-mini S&P 500
The Micro E-mini S&P 500 (MES) moves $5 per index point, with a minimum tick of 0.25 points worth $1.25. The prices below are round illustrative levels, not a market record.
On a 5-minute chart, the 20-period EMA closes above the 50-period EMA at 6000.00. Both averages are rising. The defensible targets are 6020.00 (20 points) and 6030.00 (30 points). Assume the ATR is 6.50 points.
| Stop placement | Stop price | Risk in points and ticks | Risk per MES contract | Reward to risk at 6020.00 | Reward to risk at 6030.00 | Break-even win rate at 6020.00 | Break-even win rate at 6030.00 |
|---|---|---|---|---|---|---|---|
| Below the 50 EMA | 5992.00 | 8.00 points, 32 ticks | $40.00 | 2.50 | 3.75 | 28.57% | 21.05% |
| Below the swing low | 5986.00 | 14.00 points, 56 ticks | $70.00 | 1.43 | 2.14 | 41.18% | 31.82% |
| One ATR below entry | 5993.50 | 6.50 points, 26 ticks | $32.50 | 3.08 | 4.62 | 24.53% | 17.81% |
Risk is the entry minus the stop. Reward is the target minus the entry. The break-even win rate is risk divided by risk plus reward, the share of trades you must win just to stay flat before costs.
Notice the tradeoff. The tightest stop has the best ratio, and it also sits closest to ordinary noise right after a turn, so it gets hit more often. The swing-low stop has the worst ratio and is the only one whose hit tells you the crossover reading failed.
Adding Slippage to the Crossover Example
In the same MES example (20 and 50 EMA cross at 6000.00, target 6020.00), now assume one tick of slippage on entry and one on the stop fill.
| Stop placement | Net risk in points | Net risk per contract | Net reward to 6020.00 | Net reward to risk | Net break-even win rate | Two ticks as share of risk |
|---|---|---|---|---|---|---|
| Below the 50 EMA | 8.50 | $42.50 | 19.75 | 2.32 | 30.09% | 6.25% |
| Below the swing low | 14.50 | $72.50 | 19.75 | 1.36 | 42.34% | 3.57% |
| One ATR below entry | 7.00 | $35.00 | 19.75 | 2.82 | 26.17% | 7.69% |
Two ticks is $2.50 on MES. The share it takes is 2 divided by the stop in ticks: 10% on a 20-tick stop, 8% on a 25-tick stop and 5% on a 40-tick stop. Commissions add to that. Tight stops on fast charts carry a structural cost before any edge shows up.
Related lesson: Risk-reward ratio
Risk Management and Position Sizing for Crossover Trades
Position size is where a stop distance becomes a number of contracts. Size from the stop, not from the signal.
A common starting point is the 2% rule: never put more than 2% of account equity at risk on one trade. CME Group's education lesson uses a $50,000 account, which can risk up to $1,000 per trade under that rule, and calls the 2% threshold completely arbitrary. Many traders use less, and the right figure is one you will actually follow through a losing streak.
Contracts That Fit a $1,000 Risk Budget
| Stop placement | Risk per MES contract | MES contracts | MES dollars at risk | ES contracts | ES dollars at risk |
|---|---|---|---|---|---|
| Below the 50 EMA, 8.00 points | $40.00 | 25 | $1,000.00 | 2 | $800.00 |
| Below the swing low, 14.00 points | $70.00 | 14 | $980.00 | 1 | $700.00 |
| One ATR below, 6.50 points | $32.50 | 30 | $975.00 | 3 | $975.00 |
The E-mini S&P 500 (ES) moves $50 per point, ten times MES. Two things stand out:
- A wider stop is a smaller position, not a riskier trade, as long as you size from the stop.
- The bigger contract rounds harder. Behind the 50 EMA stop, two ES contracts risk $800.00 while 25 MES contracts use the full $1,000.00. Micros let you match the risk budget more closely.
A crossover system also needs rules above the trade level: a daily loss stop, a maximum number of signals per session, and a plan for a losing streak. Trend systems lose often in ranges, so the streak will come. The dangerous moment is the fourth loss in a row, when doubling size to win it back feels reasonable. Decide in advance what you do when it does, and write it down.
Related lesson: Position sizing
False Crossover Signals and Whipsaws
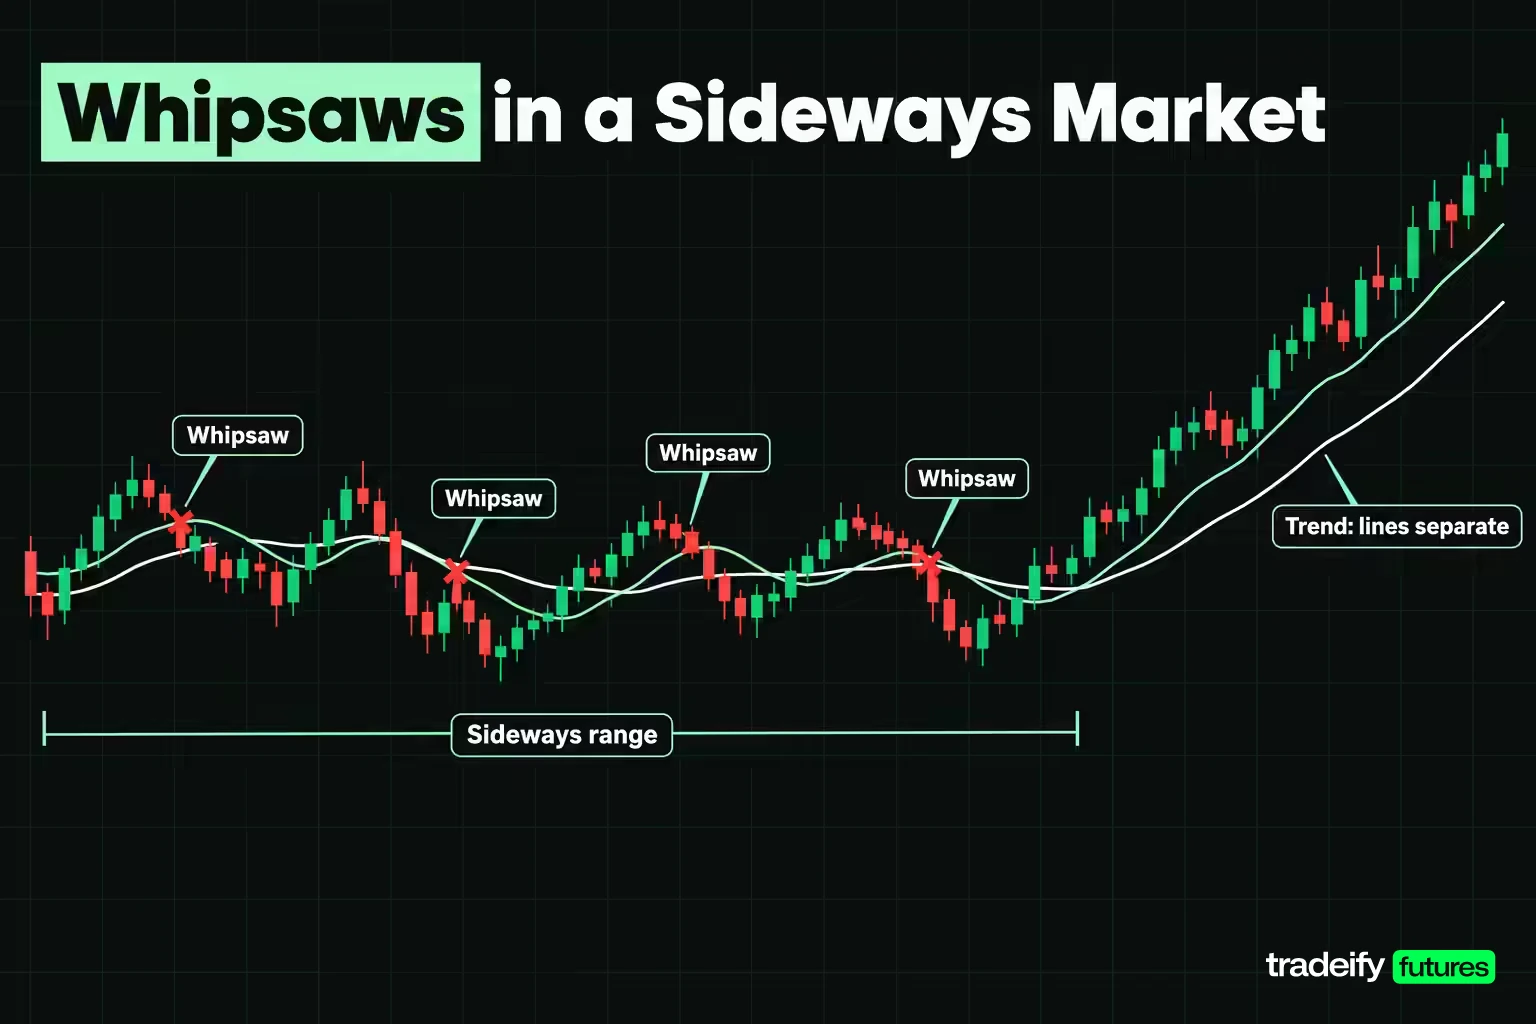
A whipsaw is a crossover that reverses soon after it fires, often near the same price. You pay to enter, pay to exit, and the trend never shows up.
Whipsaws come from the same place as the signal. A crossover measures the relationship between two averages of past prices. In a sideways market that relationship keeps flipping while price goes nowhere. StockCharts walks through a 10-day and 50-day EMA example where three whipsaws came before the crossover that finally caught a strong trend.
Faster pairs whipsaw more. Research on trend-following speed from Graham Capital Management describes reactive signals as better at catching short trends but prone to whipsawing, while slower models may be late to recognise a reversal. You cannot escape both problems with one setting.
What Whipsaws Cost by Crossover Speed
The table uses assumed signal counts, not measurements, to show what the same two-tick MES round trip ($2.50) costs at different speeds.
| Pair and chart | Assumed round trips per session | Slippage cost per session | Cost over 20 sessions | Share of a $70.00 risk unit |
|---|---|---|---|---|
| 9 and 21 EMA, 5-minute chart | 6 | $15.00 | $300.00 | 21.43% |
| 20 and 50 EMA, 5-minute chart | 2 | $5.00 | $100.00 | 7.14% |
That cost is paid whether the signals work or not, and it comes before commissions. A fast pair has to earn enough on its good signals to cover a steady drain from its bad ones.
Related lesson: Range trading
Filters That Confirm a Crossover
Filters cut the number of crossovers you act on. Each filter removes some whipsaws and some good trades, so add them one at a time and test each.
- Close beyond the cross. Ignore crossings that do not survive the bar close.
- Slope of the slow average. In the Nordic golden cross study, the signal carried value when the long average was rising and none when it was falling. Requiring the slow line to slope in your direction is the most directly evidenced filter on this list.
- Time filter. StockCharts suggests requiring the crossover to last a set number of bars, such as three days, before acting.
- Percentage band. Require the fast line to clear the slow line by a margin. In one StockCharts example, a 20 and 60 EMA system only signalled long when the 20-day EMA was more than 2% above the 60-day, because zero-line crossings gave too many false signals.
- Volume. StockCharts' sample bullish cross scan requires a rising 150-day SMA plus a 5-day EMA crossing above a 35-day EMA on above-average volume.
- Higher timeframe direction. A buy cross on a 5-minute chart inside a daily downtrend is often just a bounce. Check the chart above yours before acting.
- Trend strength or momentum. ADX readings or the MACD histogram can show whether there is a trend worth following.
How to Stack Crossover Filters Without Overfitting
Pick filters that answer different questions: direction (slope or higher timeframe), persistence (close, time or band) and participation (volume). Two filters that both measure trend strength mostly duplicate each other. Every extra condition is another parameter that can fit the past rather than the market.
Related lesson: Multiple-timeframe analysis
Choosing a Crossover Timeframe
The chart timeframe does not decide whether a crossover works. The relationship between the lag and the size of the move you want does.
Lag in bars stays the same on every chart. What changes is how much clock time and price movement those bars represent.
| Average | Lag in bars | Lag on a 5-minute chart | Lag on a daily chart |
|---|---|---|---|
| 9 | 4 | 20 minutes | 4 sessions |
| 21 | 10 | 50 minutes | 10 sessions |
| 50 | 24.5 | 122.5 minutes | About 5 weeks of sessions |
| 200 | 99.5 | 497.5 minutes, about 8 hours 18 minutes | About 20 weeks of sessions |
Read the 200 row slowly. On a 5-minute chart, a 200-period line reports a trend that started most of a trading day earlier.
Matching Crossover Speed to the Move You Trade
- Estimate the typical move you want to capture on your instrument and chart.
- Work out how far price typically travels in the slow line's lag in bars.
- If that distance is most of the move, the pair is too slow for your target.
- If the pair crosses several times a session in quiet conditions, it is too fast for your costs.
Markets also change character. A pair that tracked a strong trending month can chop through a quiet one. That is a reason to pair the crossover with a regime check, such as the slope filter, rather than to retune the lengths every few weeks.
Related lesson: Strategy timeframes
Backtesting a Moving Average Crossover Strategy
Crossovers are easy to backtest, which is exactly why backtests of them mislead so often. You can test hundreds of length pairs in minutes, and one of them will look great.
What Long-Run Crossover Studies Show
- Brock, Lakonishok and LeBaron (Journal of Finance, 1992) tested 26 simple rules, including moving average rules, on the Dow Jones Index from 1897 to 1986. Buy signals consistently produced higher returns than sell signals, and returns after sell signals were negative.
- Sullivan, Timmermann and White (Journal of Finance, 1999) widened the universe to 7,846 rule settings on 100 years of Dow data and corrected for data snooping. The original results held up inside 1897 to 1986. In the 10 years after, 1987 to 1996, the best rule did not repeat its performance, and on S&P 500 futures from 1984 to 1996 they found no evidence that any rule beat the benchmark.
- In that same paper, a rule with a p-value of 0.04 when tested alone had a data-snooping adjusted p-value of 0.90 once the full set of rules searched was counted. That is how much a grid search can flatter a winner.
- A Graham Capital research note found crossover strategies of different speeds highly correlated across 50+ futures markets since 2000: a 20x60 and 30x90 system had a 90% actual PnL correlation. Even the most different pair tested, 10x30 against 40x120, still showed 49%.
Rules for an Honest Crossover Backtest
- Hold out data. Choose settings on one period and judge them only on a later period you never touched.
- Count every setting you tried. If you tested 200 pairs, the best one is partly luck.
- Model costs and slippage. The best full-sample Dow rule in the 1999 paper traded 63.1 times a year and broke even at 0.27% per trade in costs. Fast systems live or die on this line.
- Look beyond total return. Check drawdown, longest losing streak, win rate against break-even rate, and how many trades the result rests on.
- Prefer a flat region over a sharp peak. If 20 and 50 works but 18 and 50 or 22 and 55 fail, you found noise.
What Is the Success Rate of a Crossover Strategy
There is no single success rate. It depends on the pair, the market, the period and the exit. A win rate on its own also means little. A crossover system that wins 35% of trades can be sound if winners are large, and one that wins 60% can lose money if a few losses are large. Compare the win rate with the break-even rate your stop and target imply.
Related lesson: Backtesting a trading strategy
Strengths and Limitations of Crossover Systems
Crossovers are popular for good reasons, and they fail for predictable ones.
| Strengths | Limitations |
|---|---|
| Objective rule, easy to test and automate | Always late, by a lag you can calculate |
| Keeps you in the direction of a strong trend | Whipsaws in ranges, often in clusters |
| Works on any market and timeframe with a chart | Slippage and commissions compound on fast pairs |
| Removes some in-the-moment judgment | Easy to overfit by tuning lengths |
| Doubles as a regime filter for other setups | Opposite-cross exits give back part of each trend |
The fair summary: a crossover is a trend filter with a cost. It does well when a trend takes hold and poorly when one does not, and you rarely know in advance which you are in. Used alongside structure, momentum and volume, it can be a useful input. Used alone, it is closer to a coin flip with costs attached.
Related lesson: Trend following
Charting Platforms and Code for Moving Average Signals
Almost every charting platform can plot two averages and mark where they cross. The differences are in alerts and automation.
- Built-in crossover studies. thinkorswim's Moving Average Crossover study takes two lengths, two average types and the crossing direction, and plots the signal on the chart.
- Scans and alerts. StockCharts publishes sample scans for bullish and bearish moving average crosses that also check the slope of a 150-day average and volume. Most charting platforms let you set an alert when one plotted line crosses another.
- Code conditions. NinjaTrader 8's NinjaScript has a CrossAbove method that checks whether one series crossed above another within a set look-back. Its documentation notes that equal values on the current or previous bar do not count as a cross with a look-back of 1, which is the kind of detail that changes backtest results.
When you code or automate a crossover, settle two things first. Does the signal evaluate on the closed bar or the live bar? And what happens if the lines are exactly equal? Live-bar signals can appear and vanish within a single bar, which makes a backtest look cleaner than live trading.
Crossover Trading on an Intraday Futures Account
On our accounts, you can chart and trade crossovers through Tradovate, NinjaTrader and TradingView (via the Tradovate connection), the Rithmic platforms Tradesea, Quantower, Sierra Chart and R Trader Pro, or WealthCharts, whose Chart Replay lets you practise on historical data. Positions must be closed by 4:45 PM ET with no overnight holds, so a daily golden cross works as a context filter for intraday trades, not a position you can carry, and funded accounts are simulated.
Moving Average Crossover FAQ
What is a bullish crossover?
A bullish crossover happens when a shorter moving average crosses above a longer one, or when price crosses above a moving average. It shows that recent prices have risen faster than older ones. It confirms upward momentum after the fact and does not guarantee the move continues.
How do you use an EMA crossover indicator?
Plot a fast and a slow EMA, such as 9 and 21 or 20 and 50, on the timeframe you trade. Treat a close of the fast EMA above the slow one as a long signal only if the slow EMA is rising, then set your stop and size before entering. Exit at a target, a trailing stop or the opposite cross.
What is the 2% rule in swing trading?
The 2% rule means never risking more than 2% of account equity on a single trade. On a $50,000 account that is $1,000, and the stop distance then decides how many contracts or shares you can take. CME Group's lesson calls the 2% figure arbitrary, so many traders use less.
What is the success rate of a moving average crossover strategy?
No single success rate exists, because results depend on the pair, market, period, exit and costs. In Investtech's 13-year study of Nordic stocks, 50-day and 200-day buy signals returned 4.56% over 66 days against a 3.06% benchmark. A win rate only matters next to the break-even rate implied by your stop and target.
Which EMA crossover is best?
None is best in general. Fast pairs like 9 and 21 signal often and whipsaw often, while slow pairs like 50 and 200 signal rarely and late. Pick the pair whose lag fits the size of the move you trade and whose signal count your costs can absorb.
Is the death cross a reliable sell signal?
Evidence says not very. In Investtech's Nordic stock study, stocks after a death cross performed in line with the market, with excess return of -0.05 percentage points over 66 days. It works better as a warning to tighten risk than as a short entry on its own.
Crossover Trading Risk
Trading futures and other leveraged products carries a substantial risk of loss, and losses can exceed what you expect when markets move fast or gap through a stop. Crossovers are lagging signals and can produce long runs of losing trades. Price levels, signal counts and sizes in this article are illustrative, and the studies cited cover specific markets and periods that may not repeat. Evaluation and funded prop accounts are simulated, and simulated results do not represent live trading. This article is education, not investment advice.


