



TL;DR: Level 2 market data shows resting size at several prices beyond the best bid and ask, so you can estimate a fill before you trade. CME's price-level futures book carries 10 levels, while Level 3 data shows every individual order. As of November 2026, CME non-professional depth costs $12.10 per exchange per month. Displayed size can be cancelled or hidden, so treat it as a hint and the tape as the fact.
You open a depth ladder for the first time and the numbers never sit still. Sizes jump, rows flash, and nothing tells you which of it matters. That is not a reading problem on your end. It is what level 2 market data is: a live list of orders that can trade, change or vanish.
A basic quote tells you the price right now. Depth tells you how much is waiting at that price and the next few prices, which is what sets your average fill when you trade more than the front of the book holds. It also tempts you to read intent into size that may be gone a second later.
This guide covers what the data contains, how it differs from level 1 and level 3, how the order book behind it works, a worked futures ladder, who posts the quotes, how traders use it, where it misleads, where to get it and what it costs.
What Is Level 2 Market Data
Level 2 market data is a feed of aggregated resting orders at a fixed number of price levels on each side of the market, plus the trades that change those levels. Databento defines it as market data that includes all trades and updates to aggregated book depth for a fixed number of price levels. The same data is called market by price (MBP), market depth or depth of market (DOM).
The key word is aggregated. A level 2 feed publishes one number per price, and that number is the total of every resting limit order at that price. If the ladder shows 32 contracts offered at one price, that could be one order for 32 or sixteen orders for 2. Those are very different markets, and the feed shows them the same way.
Robinhood's support page describes the display side well. Its Level II chart is a current snapshot of resting limit orders, and when one of those orders executes, it drops off the Level II view and appears as a trade on the price chart. Depth is what could trade. The chart is what did trade.
TradingView's support page frames the use case the same way. Depth shows bid and ask prices at multiple levels and the number of contracts available, so you can study supply and demand and potential support and resistance zones.
Related lesson: The Order Book
Level 1 vs Level 2 vs Level 3 Data
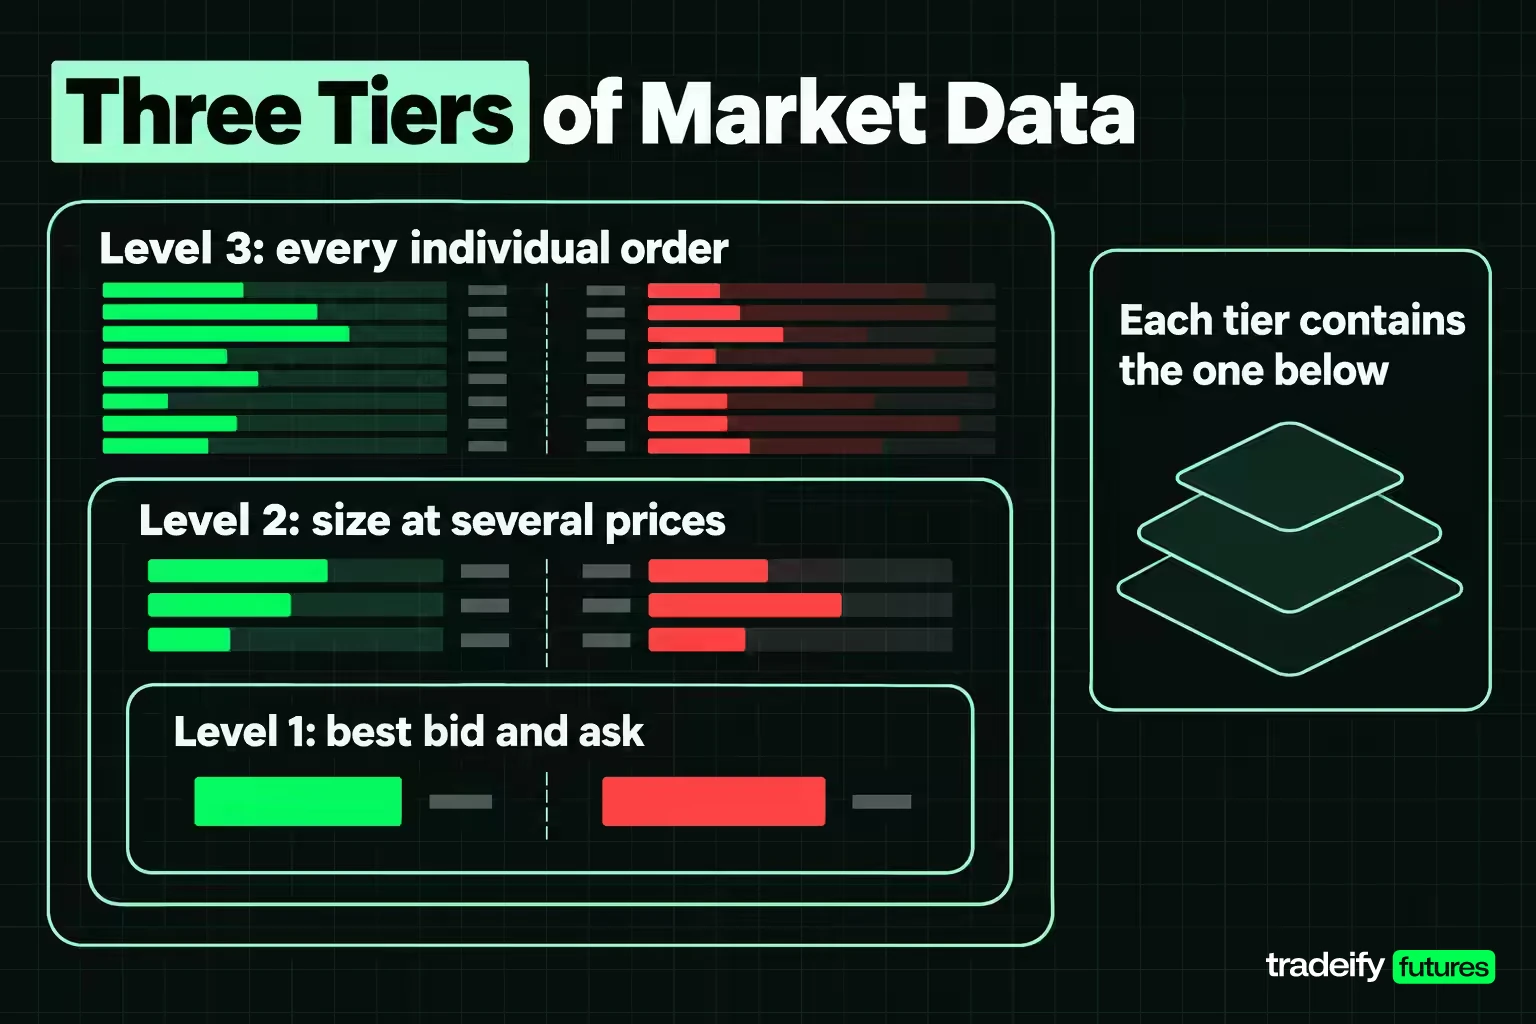
Market data tiers describe how much of the order book a feed exposes. Each tier contains everything in the tier below it.
| Data tier | What it shows | Common names | Typical use |
|---|---|---|---|
| Level 1 | Best bid, best ask, their sizes, last trade | Top of book, quotes | Knowing the current price and spread |
| Level 2 | Aggregated size at several price levels per side | Market by price, depth of market, DOM | Estimating fills and seeing where size rests |
| Level 3 | Every individual order with an order ID | Market by order, full order book | Queue modelling, backtesting passive fills |
Databento states the relationships directly. Level 2 is a superset of level 1, so level 1 can always be derived from level 2, and level 3 is a superset of level 2, so a full limit order book can be rebuilt from it. Level 3 events are keyed by a unique order ID and include adds, cancels, modifies and fills.
The labels are less tidy than the table suggests. The term Level 3 originally named a Nasdaq service that let registered market makers enter and cancel quotes, and vendors later reused it for order-by-order data. Nasdaq itself sells Nasdaq Basic as a top-of-book product and TotalView as a full order book. When you compare two platforms, compare what the feed contains rather than the label on the window.
How the Order Book Behind Market Depth Works
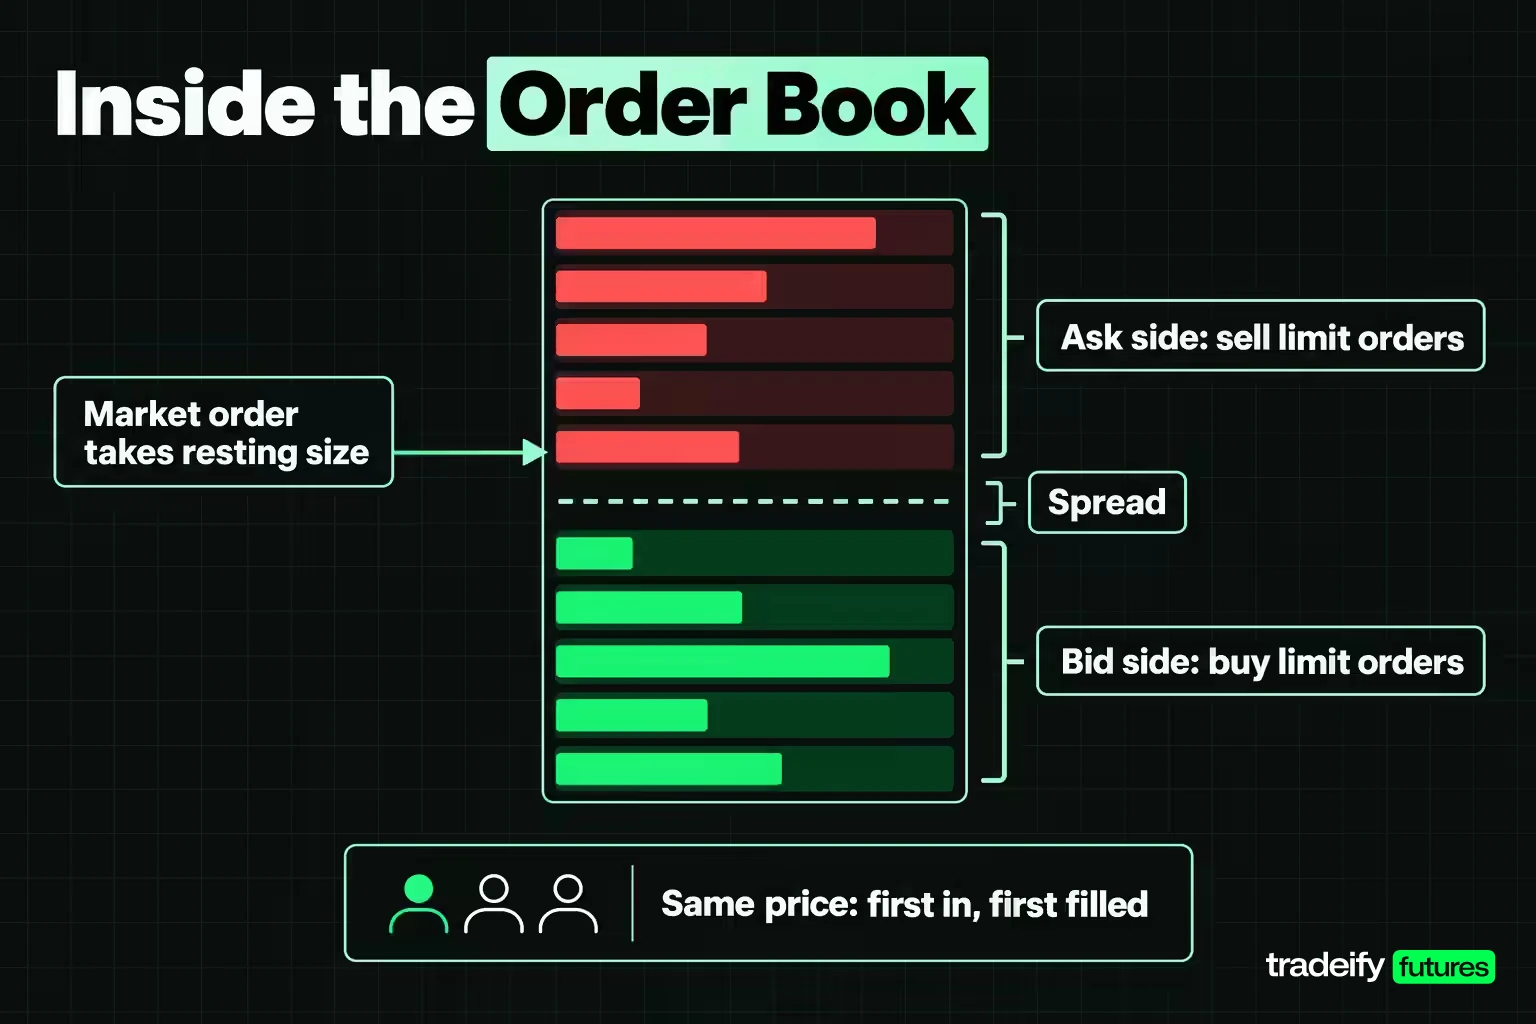
The order book is the exchange's list of resting limit orders, sorted by price. Buy limit orders sit on the bid side, sell limit orders on the ask side, and the gap between the highest bid and lowest ask is the spread. A market order, or any order priced to cross the spread, trades against those resting orders and removes them from the book.
Within one price, orders wait in line. Under CME's FIFO matching, outright orders at the same price are filled by time priority, so the order that arrived first fills first. CME also runs other algorithms, including pro-rata allocation and versions with a Lead Market Maker allocation, depending on the product.
What a CME futures depth feed carries
CME's market data documentation lists a 10-deep Market by Price book for most products and a Market by Order Full Depth feed that disseminates individual orders and quotes at every price level. Databento notes that CME moved to the order-by-order feed as its primary feed in 2017, while some features such as implied depth are still sent on a price-level basis. Eurex's EMDI feed carries up to 50 levels of aggregated depth.
Futures add one wrinkle stock traders rarely see. CME publishes a 2-deep implied book for each implied-eligible contract, built from spread orders that can be combined into an outright price. That size is real interest, but it comes from spreads, and under FIFO the aggregated implied order sits at the lowest priority in its price level.
How a depth ladder displays the book
A DOM or price ladder stacks prices vertically, with bids in one column and asks in another. Each row shows the resting size at that price, and the best bid and best ask meet in the middle. Most platforms also mark your own working orders on the ladder and let you click a price to place or move an order.
The ladder is only a display. A platform can draw it from a full depth feed or from top-of-book data with empty rows above and below.
Reading a Level 2 Ladder With a Worked Example
The fastest way to see what depth adds is to run an order through it. The ladder below is constructed for illustration on E-mini S&P 500 (ES) futures. Prices sit on the real 0.25-point tick grid, each tick is worth $12.50 on one contract, and one index point is $50. The sizes are invented to keep the arithmetic checkable.
| Bid size | Bid price | Ask price | Ask size |
|---|---|---|---|
| 22 | 7,000.00 | 7,000.25 | 18 |
| 35 | 6,999.75 | 7,000.50 | 32 |
| 29 | 6,999.50 | 7,000.75 | 41 |
| 48 | 6,999.25 | 7,001.00 | 27 |
| 60 | 6,999.00 | 7,001.25 | 55 |
A level 1 screen would show one line of this, a bid of 7,000.00 for 22 and an ask of 7,000.25 for 18. The spread is one tick, or $12.50 on ES.
Depth shows the rest. Across five levels there are 194 contracts bid and 173 offered, and 155 of the 173 offered contracts (89.6%) sit above the best ask. Most of the visible size is not at the price you can trade right now.
What a market buy costs at different sizes
A market buy fills against the ask column from the best price upward. Here is what that does at four order sizes.
| Order size | Ask levels used | Average fill | Slippage vs best ask | Extra cost vs best ask |
|---|---|---|---|---|
| 4 contracts | 1 | 7,000.25 | 0 ticks | $0 |
| 18 contracts | 1 | 7,000.25 | 0 ticks | $0 |
| 40 contracts | 2 | 7,000.3875 | 0.55 ticks | $275.00 |
| 100 contracts | 4 | 7,000.6025 | 1.41 ticks | $1,762.50 |
Check the 40-lot by hand. It takes all 18 at 7,000.25 and 22 of the 32 at 7,000.50, leaving 10 contracts resting there. The average fill is 7,000.3875, which is 0.1375 points or 0.55 ticks above the best ask. At $50 a point that is about $6.88 per contract and $275.00 across 40 contracts.
The 100-lot takes 18 at 7,000.25, 32 at 7,000.50, 41 at 7,000.75 and 9 at 7,001.00. The average fill is 7,000.6025, or 1.41 ticks worse than the quote, which works out to $1,762.50.
The small orders are the honest part of this example. A 4-lot fills entirely at the best ask in this book, and so does an 18-lot. If you trade one to a few contracts in a liquid front-month contract, depth rarely changes your fill. What it changes is what you know about the market around that fill, and whether that knowledge changes a decision is the real question.
The book is also a snapshot. By the time a 100-lot arrives, the sizes may have shifted in either direction, so treat the estimate as a range, not a quote.
Related lesson: Slippage Explained
Who Posts the Quotes in Level 2 Data
The size on a ladder comes from anyone with a resting limit order. That includes professional liquidity providers, institutions working large orders, algorithmic traders and individual traders. What you can learn about who they are depends on the market.
Market makers and ECNs in stock Level II
In US stocks, the classic Level II screen is the Nasdaq order book. Investopedia describes three groups of participants: market makers, who supply liquidity by quoting both sides; electronic communication networks (ECNs), which are computerized order systems open to many traders; and wholesalers, who execute retail order flow bought from online brokers. Each participant appears with a four-letter ID, such as CDRG for Citadel Securities or GSCO for Goldman Sachs.
A stock Level II view is usually limited to one venue's book. Robinhood's Level II, powered by Nasdaq TotalView, includes only orders from Nasdaq participants and not orders on other stock exchanges or trading venues. US stocks trade across many venues, so one exchange's depth is a partial view of total interest.
Anonymous depth in futures
Futures books work differently. An E-mini contract trades on one exchange, so the CME book is the whole book for that contract. The depth is anonymous: the price-level feed shows prices and sizes, and even the order-by-order feed identifies orders by ID rather than by firm name.
Market makers still matter in futures. CME Rule 195 sets the terms for the exchanges' market maker and incentive programs, and some products use matching algorithms with a Lead Market Maker allocation. You will not see their names on the ladder, but their quotes are part of the size.
What market makers do to the depth you see
Market makers quote both a bid and an ask and earn the spread when both sides trade. Optiver, a market-making firm, explains that market makers are generally contractually required to keep providing quotes, and that their market-making contracts often cap how wide a spread they may quote. That obligation is a big reason liquid contracts show steady size at the best prices.
The same firms manage risk by changing their quotes. Optiver notes that uncertainty pushes market makers to widen spreads, while busy trading and competition between market makers narrow them. On a ladder, that shows up as thinner size and wider gaps around scheduled news, then refilled levels once the uncertainty passes. If the book thins out right before a release, that is a cost signal, not a direction signal.
Related lesson: Market Makers Explained
How Traders Use Level 2 Market Data
Depth is useful when a decision depends on resting size at a specific price. If no rule in your plan points at the ladder, it is just moving numbers. These are the common uses, from most to least concrete.
- Estimating execution cost. Before a larger order, add up the size between the current price and the worst price you will accept. If your order is bigger than that, it will either move the price or leave a partial fill.
- Choosing between crossing and posting. If the offer is thin and the bid is thick, posting a limit order and waiting may cost less than paying the spread, at the risk of not getting filled.
- Spotting where size rests. Unusually large resting size near a level can act as short-term support or resistance while it stays there.
- Timing scalps. Short-horizon traders watch whether size at the best price is being consumed or replenished.
- Reading imbalance. Comparing bid size with ask size gives a rough read of resting interest on each side.
Imbalance changes with the number of levels you count
Imbalance is the use most likely to be overread, and the worked ES ladder shows why. The share of visible size on the bid side depends on how many levels you include.
| Levels counted | Bid size | Ask size | Bid share |
|---|---|---|---|
| Best bid and ask only | 22 | 18 | 55.0% |
| Two levels | 57 | 50 | 53.3% |
| Three levels | 86 | 91 | 48.6% |
| Five levels | 194 | 173 | 52.9% |
At the touch, buyers look stronger. At three levels, sellers have more size. At five levels it tilts back to the bid. Nothing in the market changed between those readings, only the window.
That is where traders get caught. A 55% reading at the touch feels like buy pressure, and it invites an entry the rest of the book does not support. If you use imbalance, fix the window, write it in your trading plan and check whether it relates to what happens next in your own sample. A short edge that is smaller than the spread you pay to act on it is not an edge.
Pairing depth with time and sales
Depth shows interest in trading, and the time and sales tape shows what actually traded. Read them together. Resting size that is being hit and holding tells a different story from resting size that sits untouched, and from size that vanishes just before price reaches it. A bid you watched but never saw trade is an observation. Prints at that price with the bid still there are closer to confirmation.
Related lesson: Time and Sales
Where Level 2 Depth Misleads You
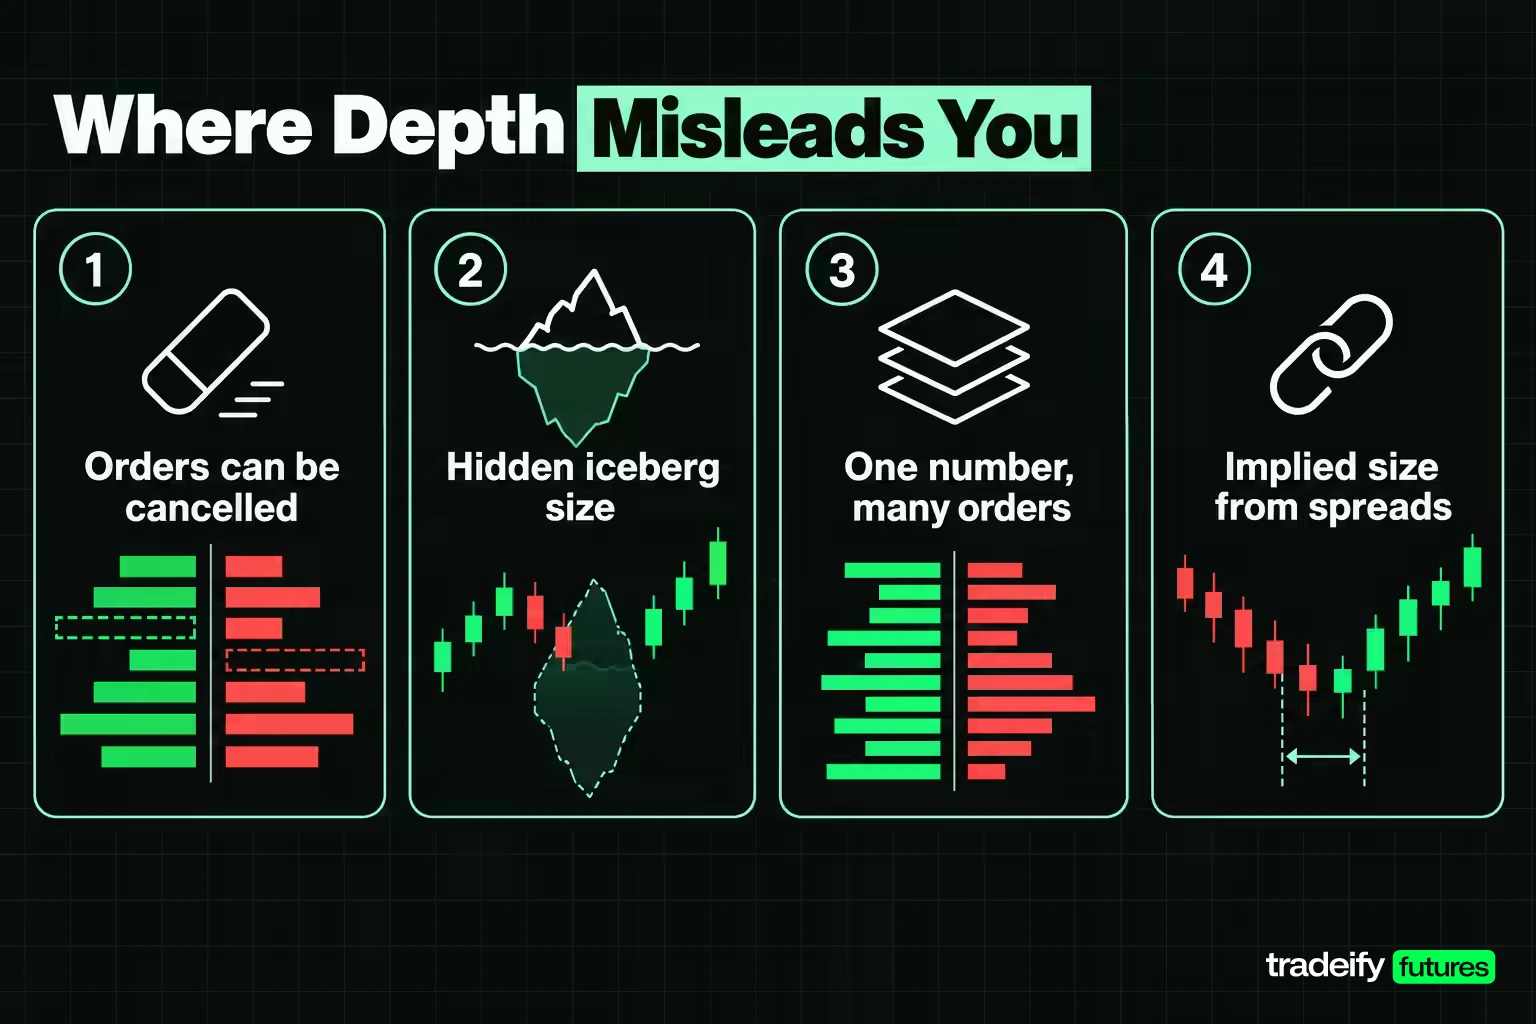
Depth is information about resting orders, not about intentions. Several mechanisms widen that gap.
- Orders can be cancelled at any time. A large bid can disappear before price reaches it. The CFTC's interpretive guidance treats spoofing (bidding or offering with the intent to cancel before execution) as prohibited, including orders placed to create an appearance of false market depth. That rule targets intent. It does not mean every cancelled order was fake.
- Displayed size can be smaller than real size. CME's display quantity feature lets a trader place a buy order for 100 with a display quantity of 10. No more than 10 shows at a time, the rest is booked but not displayed, and each refill enters as a new order at the bottom of the book. These are often called iceberg orders.
- One number hides many orders. Level 2 aggregates every order at a price, so you cannot tell one large order from many small ones, or estimate your place in line without a model. Databento notes that with only level 2 data, queue position has to be estimated.
- Some size comes from spreads. Implied depth in futures is generated from spread orders, so it is real but it fills last in its price level under FIFO.
- The ladder may not be depth at all. Databento warns that some charting platforms draw top-of-book data in a depth-style ladder, which can make users think they have a level 2 feed when they do not. A working DOM is not proof of a depth subscription.
The practical rule follows from the list. Treat displayed size as a hint that can change, and treat executed volume on the tape as the fact. If a big order is the only reason you are in a trade, ask what you will do when it disappears, because it can.
Where to Find Level 2 Market Data and What It Costs
Level 2 market data comes from the exchange, through licensed vendors and through brokers and trading platforms that pass the exchange's feed to you. For an individual trader, the usual route is a depth add-on inside the broker or platform you already use. Databento suggests checking a venue's list of approved data providers to find licensed sources.
Why consolidated stock quotes are level 1 data
US stock quotes from the securities information processors (CTA and UTP for stocks, OPRA for options) are consolidated feeds. Databento describes them as level 1: top of book and last sale across all venues, reflecting the national best bid and offer. They are usually cheaper than direct exchange feeds but lack level 2 and level 3 detail. Stock depth comes from exchange products such as Nasdaq TotalView, which Nasdaq offers by direct feed, through its Data Link APIs, through web products or through market data vendors.
What CME depth costs as of November 2026
For CME Group futures, fees are set per exchange across CME, CBOT, NYMEX and COMEX. On CME's fee list effective June 1, 2026, non-professional depth of market costs $12.10 per device per month per exchange, or $36.50 for all four exchanges. Non-professional top of book is $1.55 per exchange, or $4.65 for all four. A professional real-time display device is $134.50, and a delayed display device is $0. CME's list effective January 1, 2027 raises those to $12.50, $37.75, $1.60, $4.80 and $139.20.
Those are exchange fees. Your broker or platform may bill them through its own subscription menu and may add its own charges, so check its fee schedule before you subscribe. Stock venues can be far pricier: Databento reported that as of October 2024, IEX listed its level 1 feed at $500 per month and its level 2 feed at $2,500 per month for its direct data products.
Free, delayed and historical depth
Free depth usually means delayed depth, or depth bundled into a broker's platform. Delayed data costs nothing per device on CME's list, but delayed depth describes a book that has already changed, so it is useful for learning the display and useless for timing an order.
Historical depth is a separate product used for backtesting and research. Vendors deliver it as files or through APIs, typically in price-level formats such as 10-level MBP or as full order-by-order data. Databento notes that level 3 data lets you simulate passive fills more precisely, because level 2 alone forces you to estimate queue position.
Is Level 2 Data Worth Paying For
Depth earns its cost only when a rule in your plan uses it. If no decision changes when the ladder is on screen, the subscription is a cost with nothing attached.
| Your trading | Depth is a working input | Level 1 is usually enough |
|---|---|---|
| Entry trigger | Resting size at a specific price | Price level, pattern or indicator |
| Holding time | Seconds to minutes | Hours or a full session |
| Order size | Large relative to the size at the best price | One to a few contracts in a liquid contract |
| What you review afterwards | Fill quality against the quote | Whether the setup worked |
A sensible test is to use depth on a simulated or trial feed for a defined sample, log every decision where the ladder changed what you did, and compare those trades with your normal ones. If the log is empty after a few weeks, level 1 plus a chart covers your decisions. If it is full, check whether those trades were better or just busier.
Some traders keep depth on screen as reassurance rather than an input. That is a cost with no mechanism behind it.
On our accounts, every account includes free Level 1 CME Group data with real-time best bid, best ask and last price. Level 2 depth is an optional add-on on Tradovate-based accounts only (including NinjaTrader and TradingView through Tradovate), bought and billed directly by Tradovate. On Rithmic accounts (Tradesea, Quantower, Sierra Chart, R Trader) and WealthCharts accounts, Level 2 is not yet available, and the DOM runs on Level 1 data. Sign the Non-Professional Data Agreement on your first login, or your data will be delayed.
Level 2 Market Data FAQ
Where can I find free Level 2 market data?
Most free Level 2 market data is delayed or bundled into a broker or platform account. On CME's fee list, a delayed display device costs $0, while real-time non-professional depth is $12.10 per exchange per month as of November 2026, so someone pays for live depth. Some brokers include it and others sell it as an add-on. Delayed depth helps you learn how a ladder works but is no use for timing trades.
Is Level 2 the same as the order book?
Level 2 is a summary of the order book. It shows total size at each price for a fixed number of levels. The full order book, with every individual order and its place in line, needs level 3 or market by order data.
Does Level 2 show hidden or iceberg orders?
No. Level 2 shows only the displayed portion of an order. A display quantity order shows a slice at a time, so the real size only becomes visible through repeated fills at the same price on the tape.
Can Level 2 data predict where price goes next?
Not reliably on its own. Resting orders can be cancelled, added or hidden, so depth describes current interest rather than a forecast. Many traders use it for execution and context, alongside price action and the tape.
Do futures show market maker names on Level 2?
No. CME futures depth is anonymous and shows prices and sizes only. Stock Level II on Nasdaq can show participant IDs for market makers and other firms.
Trading futures involves substantial risk, and losses can exceed what you expect, especially when you trade size into a thin book. Market depth is displayed interest that can change or disappear and does not predict price. Funded and evaluation accounts are simulated. All ladder sizes, prices and costs here are illustrative examples, data fees change, and nothing here is financial advice.


