



TL;DR: Time and sales lists every executed trade with its time, price, size and the side that crossed the spread. On CME futures the exchange flags the aggressor and timestamps each trade to the nanosecond. The tape shows completed trades, not resting orders, so it reveals aggression but never intent. Fix your size filter and aggregation first, count volume delta and pace, then check depth before acting.
Time and sales is the record of every trade that actually executed in one market, printed row by row as it happens. Traders call it the tape. A chart tells you where price went over a minute or an hour, while time and sales shows the individual trades that moved it there, in the order they happened.
That is why the tape feels so convincing when it scrolls fast. It is precise about what traded and silent about everything else, and most tape-reading mistakes come from asking it a question it cannot answer, usually "who is going to win from here?"
What Time and Sales Shows
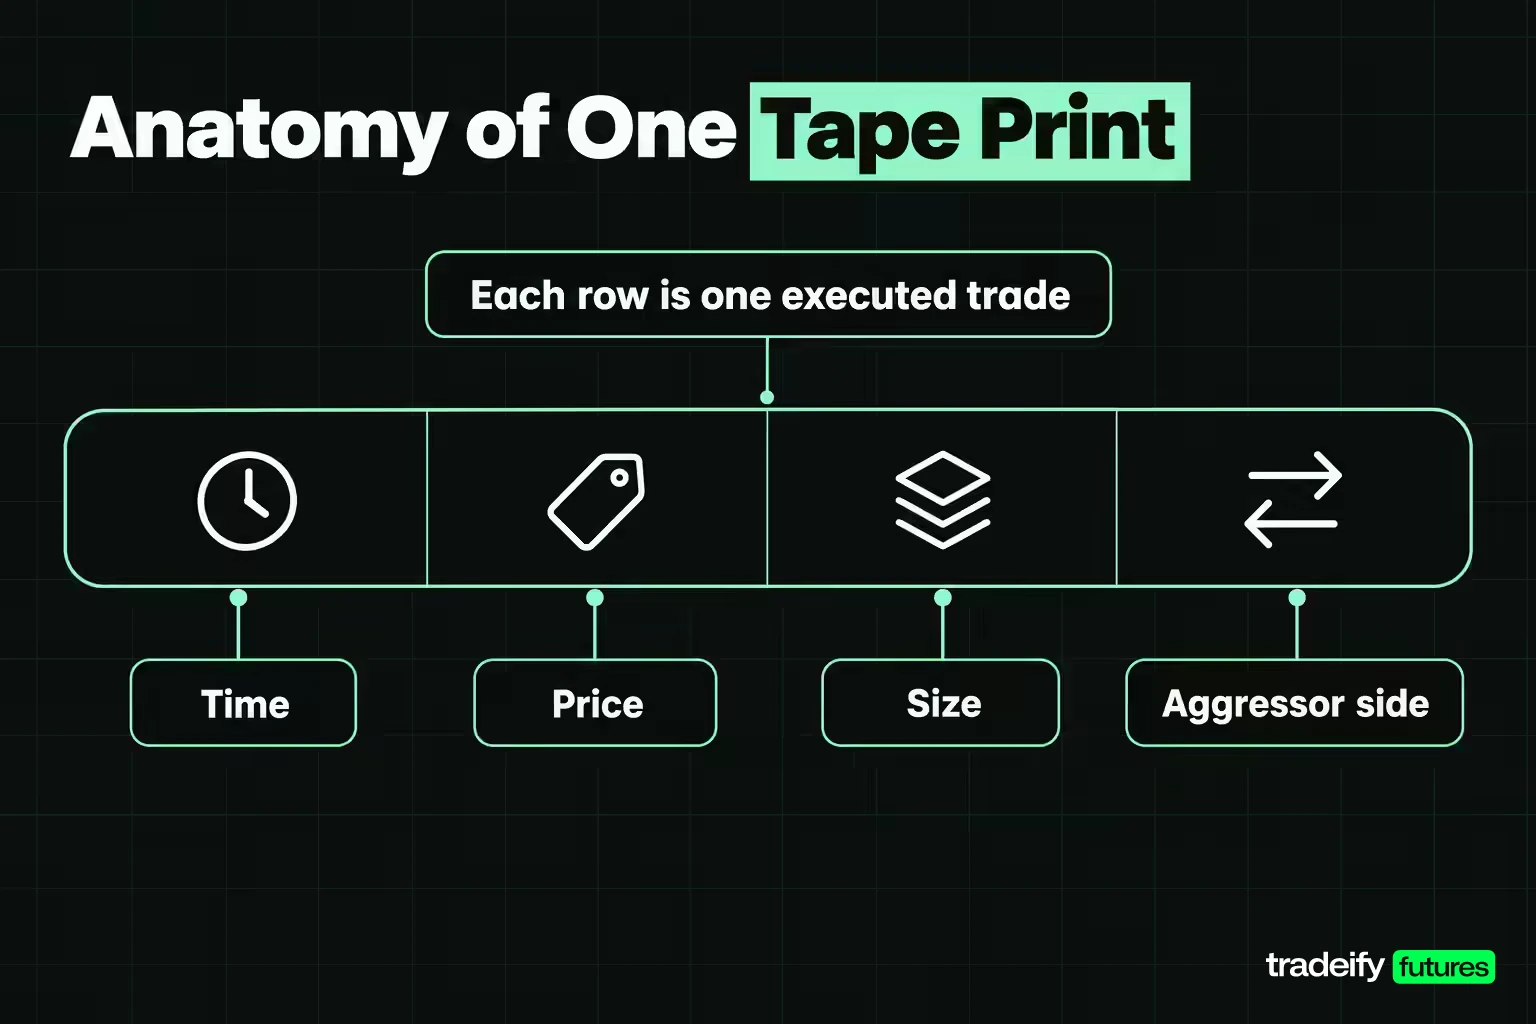
Time and sales (T&S) is a table of executed trades for one instrument. Each row is a print, meaning one trade or one exchange-reported match, and a new row appears every time a buyer and a seller meet.
A basic time and sales window has three columns. NinjaTrader's default layout shows the time of the trade, the price, and the number of contracts traded, with each row a single trade. Most platforms add a fourth piece of information through color: whether the trade happened at the bid, at the ask, or between them.
What the exchange publishes in time and sales data
The window on your screen is built from exchange data, and the exchange record holds more than most windows display. CME Group's Time and Sales data layout lists, for each record:
- A transaction timestamp to the nanosecond, in UTC.
- A sequence number for each product, which is the official order of events.
- The contract symbol and the trade price.
- The trade quantity and the cumulative volume for the day.
- A trade aggressor field marked B for a buyer or A for a seller, which can be null when no aggressor applies.
- A report type that separates trade entries (TRD) from volume records generated by implied orders (VOL), which carry no trade price and no quantity.
CME also notes that trades inside the same second are ordered by sequence number, and that a user should sort by sequence number rather than timestamp. If a platform shows two prints with identical times, the sequence is what tells you which came first.
Time and sales versus the order book
The order book (often called depth of market or Level 2) shows resting limit orders waiting at each price. Those orders can be cancelled or moved at any moment. Time and sales shows only trades that already happened, and a trade cannot be cancelled by the trader who made it.
So the two answer different questions. The book shows where liquidity is offered. The tape shows whether anyone is taking it.
Related lesson: The Order Book
Why Traders Read the Time and Sales Tape
Tape reading is the practice of interpreting time and sales to judge who is in control right now. The name goes back to the paper ticker tape that printed stock trades on a strip, and Investopedia describes the modern window as the digital version of reading that old ticker tape.
The reason traders still do it is sequence. A one-minute candle compresses sixty seconds into four prices and a volume number. Two minutes can produce identical candles while one was forty buyers paying the offer and the other was a single seller dumping into the bid at the end. The candle cannot tell them apart. The tape can.
What the tape reveals about pressure and momentum
Read over a few minutes, time and sales shows three things about short-term market dynamics:
- Pressure. NinjaTrader's guide puts it plainly: a stream of red (bid-side) prints suggests more trades are hitting the bid and downward pressure, while green suggests more trades are lifting the offer.
- Urgency. The pace of prints shows how badly someone wants in or out. A market that prints twice a second near a level is behaving differently from one that prints twice a minute.
- Reaction. The most useful read is often what price does after a burst. Heavy selling that fails to push price lower says something different from heavy selling that drops it three ticks.
What the tape cannot reveal is intent. A print at the bid says a seller accepted the bid. It does not say whether that seller is opening a short, closing a long, hedging something elsewhere, or an algorithm rebalancing. Sentiment read from the tape is a guess about behavior, and it stays a guess until price confirms it.
Bid and Ask Prints in Time and Sales
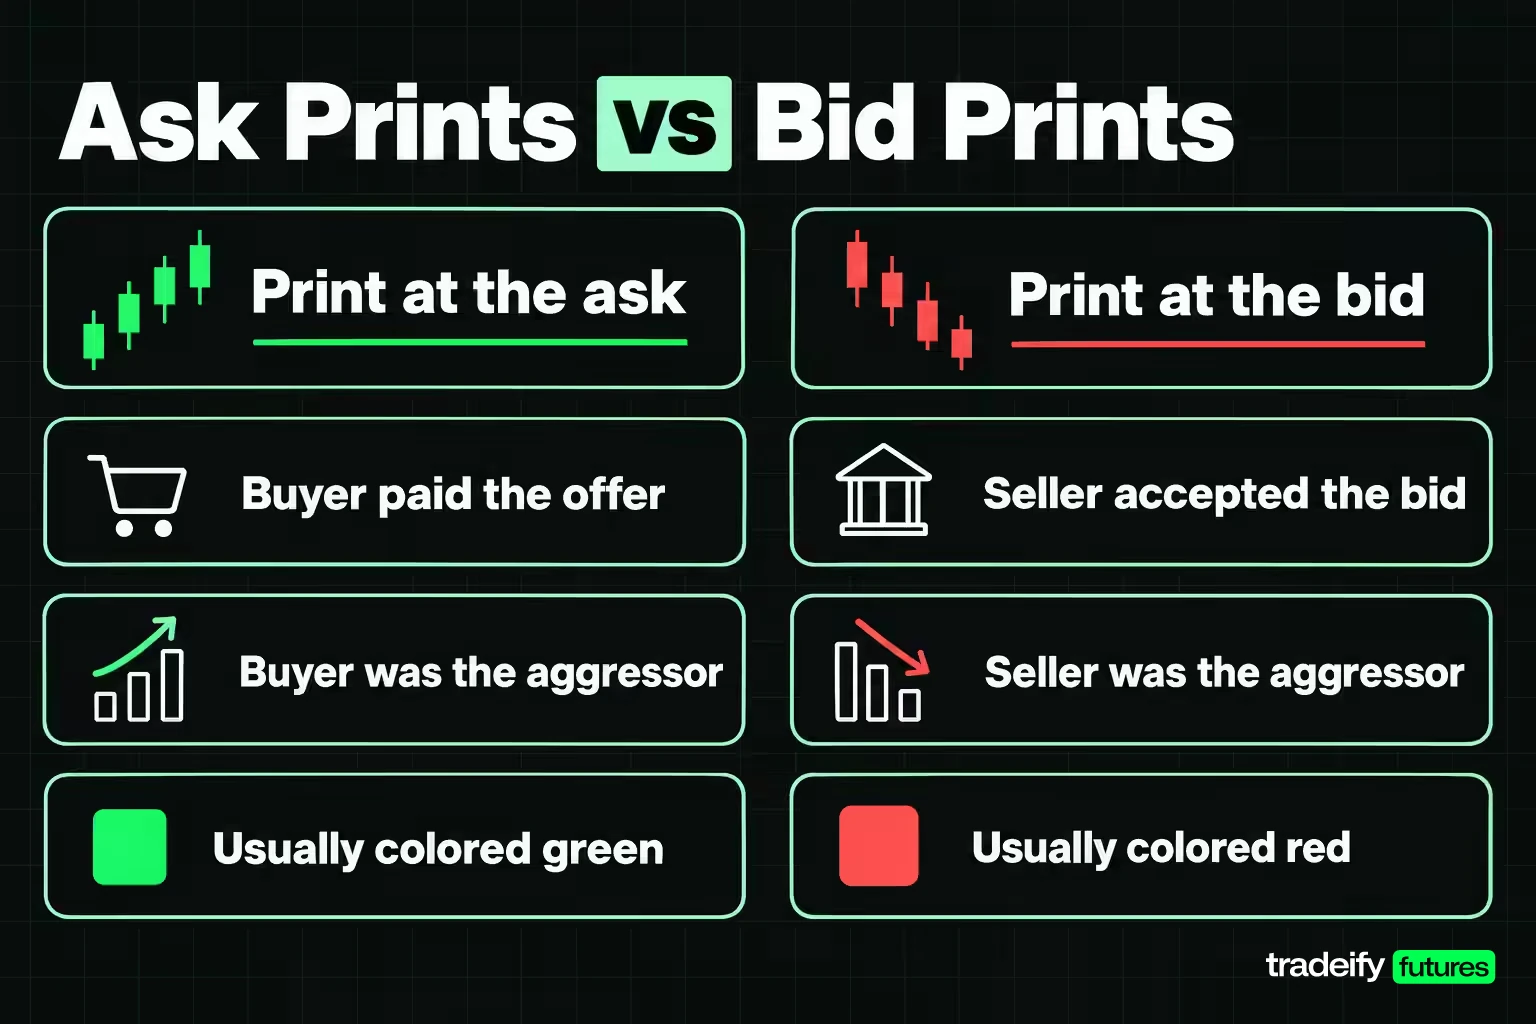
Every trade has two sides. One order was resting in the book at a quoted price, and the other order arrived and crossed the spread to reach it. The arriving order is the aggressor, and its side is what the tape labels.
- A print at the ask means a buyer paid the offer. Platforms usually color it green.
- A print at the bid means a seller accepted the bid. Platforms usually color it red.
- A print between the bid and ask can appear in markets where the spread is wider than one tick or where trades match away from the displayed quote. Investopedia notes that rows are often colored by whether the trade occurred on, in or outside the bid or ask.
A print at the ask does not mean "more buyers than sellers." Every contract bought was also sold. It means the buyer was the one in a hurry, willing to pay the spread instead of waiting.
Related lesson: Bid-Ask Spread
Exchange-reported side versus inferred side
On CME Globex the exchange tells you the aggressor directly. CME's market data Trade Summary message carries an AggressorSide field (1 for a buying aggressor, 2 for a selling aggressor), and its historical time and sales files carry the same B or A flag.
Not every platform uses that field. Some classify a print by comparing its price with the bid and ask at that moment. Sierra Chart, for example, defines a Bid Trade alert as a trade at the bid price or lower and an Ask Trade alert as a trade at the ask price or higher. When the quote changes between the trade and the update reaching your screen, a price-based label can be wrong. Check your platform's documentation so you know whether a color is an exchange fact or an estimate.
Trade Size and Volume in Time and Sales
The size column in time and sales shows how many contracts traded in that print. It does not show the size of the resting order on the other side, and it does not show how much is still waiting at that price.
That distinction is where most overconfidence starts. A 40-lot printing at the bid tells you 40 contracts changed hands. The buyer resting there may have had 40, or 400, or may have been ten separate traders with four each.
One aggressor can create several prints
On CME, a Trade Summary message represents all the orders that traded together because of a single aggressing order, an elected stop order or a similar market event. CME's own sample message shows one match that traded 30, 77, 61 and 82 contracts at four descending prices, 250 contracts against 106 resting orders. On a raw tape that one decision by one trader looks like four separate prints.
Some platforms can combine those rows back into the original summary trade. Others show every piece. Either way, a cluster of prints with the same timestamp across several prices is usually one order sweeping the book, not four traders agreeing.
Block alerts versus exchange block trades
Platforms let you highlight "block" prints above a size you choose. NinjaTrader's example sets the block size at 5 contracts and marks qualifying rows with a "B" and an optional sound.
That is a display setting, not an exchange category. On CME, a block trade is a privately negotiated futures or options transaction executed apart from the public market under Rule 526, restricted to eligible contract participants and subject to minimum sizes that vary by product. A large print on your screen is simply a large trade on the public order book.
Related lesson: What Is Volume?
Time and Sales Window Settings
Two traders can watch the same market at the same moment, describe opposite tapes and both be right, because time and sales windows are configurable. Settings decide which trades you see, how they are grouped and whether non-trade rows appear at all. Decide them before the session and leave them alone, or your reads stop being comparable from one day to the next.
Time and sales size filters and block alerts
A size filter hides prints below a threshold. NinjaTrader's filter defaults to zero, so every trade shows, and its example setting of 3 hides anything under three contracts. Sierra Chart offers minimum and maximum filters on volume, price, ask size and bid size.
Filters change the story, not just the clutter. Here is one illustrative 12-print MES window (174 contracts in total, built for the worked read on this page) with different filters applied:
| Size filter | Prints shown | Volume delta |
|---|---|---|
| None | 12 | minus 48 |
| 3 or more | 11 | minus 46 |
| 10 or more | 6 | minus 40 |
| 20 or more | 4 | minus 66 |
The same 39 seconds reads as mildly bid-heavy with a 10-lot filter and strongly bid-heavy with a 20-lot filter. Neither is wrong. They are different questions, so write the filter next to any conclusion you record.
Highlights and alerts sit on top of filters. Sierra Chart can color a row when a field meets a condition (for example, price equals a level you care about) and play separate alert sounds for bid-side and ask-side trades.
Aggregation and combined records
Aggregation merges several trades into one row. NinjaTrader can aggregate trades into time segments, with an example of 10 seconds, so the size column shows larger numbers. Sierra Chart offers several combine modes:
- Same price and type (bid trade or ask trade).
- Same time and price, with time compared to the second.
- Same time and type.
- Combine into the exchange-reported original summary trade, available for CME Group, EUREX and CFE symbols on Sierra Chart's Denali feed.
Aggregation makes a fast market readable. It also manufactures large rows that never appeared on the raw tape. A "200-lot at the offer" on an aggregated window may be fifty small trades, so a large-print alert on an aggregated feed means something different from one on a raw feed.
Quote rows, timestamps and stored records
Sierra Chart's window lists both trades and quotes from the feed, and it only shows bid and ask changes when Show Bid and Ask Records is turned on. With quote rows on, the table mixes price updates with executions, which is useful and also the quickest way to count a quote as a trade.
Two other settings matter in fast markets:
- Timestamp precision. Sierra Chart can show milliseconds and microseconds in the time column. With whole seconds only, a burst of twenty prints looks like one moment.
- Stored records. Sierra Chart keeps a set number of records per symbol in memory (its example is 1000) and warns that setting this too high slows the window.
A Worked Time and Sales Read on MES
The fastest way to learn the tape is to slow one down and do the arithmetic by hand, because the eye remembers the loudest row and forgets the total. This window is a constructed example on the Micro E-mini S&P 500 future (MES). Its prices are round and illustrative, not market data. MES is $5 times the S&P 500 Index with a minimum tick of 0.25 points, so one tick is $1.25 per contract.
The market is quoted 7,000.00 bid and 7,000.25 ask, a one-tick spread. Here is every print over 39 seconds.
| Time | Price | Size | Side | |
|---|---|---|---|---|
| 1 | 10:31:02 | 7,000.25 | 12 | Ask |
| 2 | 10:31:05 | 7,000.00 | 3 | Bid |
| 3 | 10:31:09 | 7,000.25 | 8 | Ask |
| 4 | 10:31:13 | 7,000.00 | 2 | Bid |
| 5 | 10:31:17 | 7,000.25 | 25 | Ask |
| 6 | 10:31:21 | 7,000.00 | 6 | Bid |
| 7 | 10:31:24 | 7,000.00 | 40 | Bid |
| 8 | 10:31:28 | 7,000.25 | 4 | Ask |
| 9 | 10:31:32 | 7,000.00 | 20 | Bid |
| 10 | 10:31:35 | 7,000.00 | 9 | Bid |
| 11 | 10:31:38 | 7,000.00 | 31 | Bid |
| 12 | 10:31:41 | 7,000.25 | 14 | Ask |
Counting volume, delta and pace in the MES window
- Volume. 174 contracts traded. 63 printed at the ask and 111 at the bid.
- Volume delta. Ask volume minus bid volume is minus 48 contracts. The bid side took 63.8% of the activity.
- Large prints. Four prints were 20 contracts or more (25, 40, 20 and 31). Together they are 116 contracts, or 66.7% of the window, and 91 of those 116 printed on the bid. The single 40-lot is 23.0% of the window on its own.
- Pace. 12 prints in 39 seconds is 18.5 prints per minute, or about 4.5 contracts per second. The average print is 14.5 contracts and the median is 10.5.
- The half-window flip. The first six prints were 45 at the ask against 11 at the bid, a delta of plus 34, with 80.4% at the ask. The last six were 18 at the ask against 100 at the bid, a delta of minus 82, with 84.7% at the bid.
Price started the window at 7,000.25 and finished at 7,000.25. Sellers did most of the crossing, crossed in size and accelerated in the second half, and the market still did not trade a single tick below 7,000.00.
What the MES tape cannot prove about absorption
In the illustrative MES window, sellers hit the 7,000.00 bid for 111 contracts and price never traded below it. That is the interesting fact, and it is also where the temptation to jump in long is strongest. Something at 7,000.00 bought 111 contracts from aggressive sellers without letting price drop. That could be one large passive buyer absorbing the selling. It could be several unrelated buyers who happened to sit at a round number. It could be a resting order that refilled a few times and is about to be pulled.
The executed record does not separate those. A depth check does: whether the bid at 7,000.00 kept refreshing after each sell burst, and whether it was still there a minute later. Until then, "absorption at 7,000.00" is a hypothesis, and the obvious invalidation is price trading 6,999.75 and holding there.
Related lesson: Cumulative Delta
Tape Patterns and What They Suggest
Tape patterns are recurring sequences in time and sales that traders learn to recognize. None of them is a signal on its own. Each one is a description of behavior that needs price to confirm it.
| Tape pattern | What it looks like | What it may mean | What would argue against it |
|---|---|---|---|
| Pace burst | Prints jump from a few per second to a steady stream | Urgency has arrived, often at a level or on news | The burst fades and price returns to where it started |
| Sweep | Several prints with the same timestamp at consecutive prices | One aggressive order took out more than one price level | Price snaps straight back through the swept levels |
| Absorption | Heavy prints into one price that does not break | A large passive order or a crowd of them is taking the other side | The level breaks and holds beyond it |
| Refill or iceberg | Similar-sized prints at one price, again and again, while displayed size barely changes | A hidden order showing only part of its size | The displayed size disappears after the burst |
| Exhaustion | Large aggressive prints keep coming but price stops advancing | The aggressive side is running out of fuel | Price breaks to a new extreme on rising pace |
| Drying up | Prints shrink and slow near a level | Neither side is in a hurry, so the level is not being tested hard | Pace returns with size |
Sweeps on the tape
A sweep is what one large aggressive order looks like when it is bigger than the size resting at the best price. Take an illustrative sell sweep on MES: 15 contracts print at 7,000.00, then 22 at 6,999.75, 18 at 6,999.50 and 25 at 6,999.25, all with the same timestamp. That is 80 contracts in one match and three ticks of movement, or $3.75 per MES contract ($37.50 per ES contract).
The CME Trade Summary documentation describes exactly this structure: one aggressing order matched at several prices is reported as one match event with an entry for each price. A trader willing to pay three ticks of slippage to get filled now is telling you something about urgency. What it does not tell you is whether that trader is right.
Refills and iceberg orders
CME supports a display quantity order, often called an iceberg. In CME's example, a buy order for 100 contracts with a display quantity of 10 never shows more than 10, and each time 10 fills, the next 10 joins the book as a new order at the back of the queue. On the tape that looks like repeated fills at one price that never seem to exhaust the bid.
The same pattern can come from many independent traders stacking at a round number. Treat an "iceberg" read as probable, not certain.
Upticks, downticks and print sequences
Price action inside the tape is about the order of prices, not just the side. An uptick is a print above the previous print, a downtick is a print below it. A run of ask prints that keeps printing higher prices is momentum. A run of ask prints at the same price, while the offer keeps refilling, is the buyer failing to move the market. Both show green on screen, and they mean opposite things.
Condition Codes and Odd Prints in Time and Sales
Some rows in time and sales look broken until you know the notation. CME's Time and Sales report includes an indicator column, and its data FAQ explains a few rows that confuse new readers.
| Mark | What CME says it means | What to do with it |
|---|---|---|
| Zero size or Indicative | An indicative price, not an executed trade, often shown before regular session hours | Leave it out of volume and delta |
| A or B after the price | An offer at or below the previous last (A) or a bid at or above it (B) | Treat it as a quote row, not a trade |
| Fast | The trade occurred during a fast market period | Treat the exact price and order as approximate |
| Cancel or Correction | The trade was reported erroneously, or its price or volume was amended | Expect the historical tape to differ from what you saw live |
| Insertion | The trade was inserted later in the day, often to fill a sequence gap | Trust the sequence number, not the display order |
| Open, Close or Both | The price is designated as the open, the close, or both | Use it for session context, not order flow |
CME also notes that end-of-day volume and time and sales volume can differ because of the venues and trade types included. If your tape total does not match the daily volume on a quote page, that is usually why.
A Repeatable Tape Reading Routine
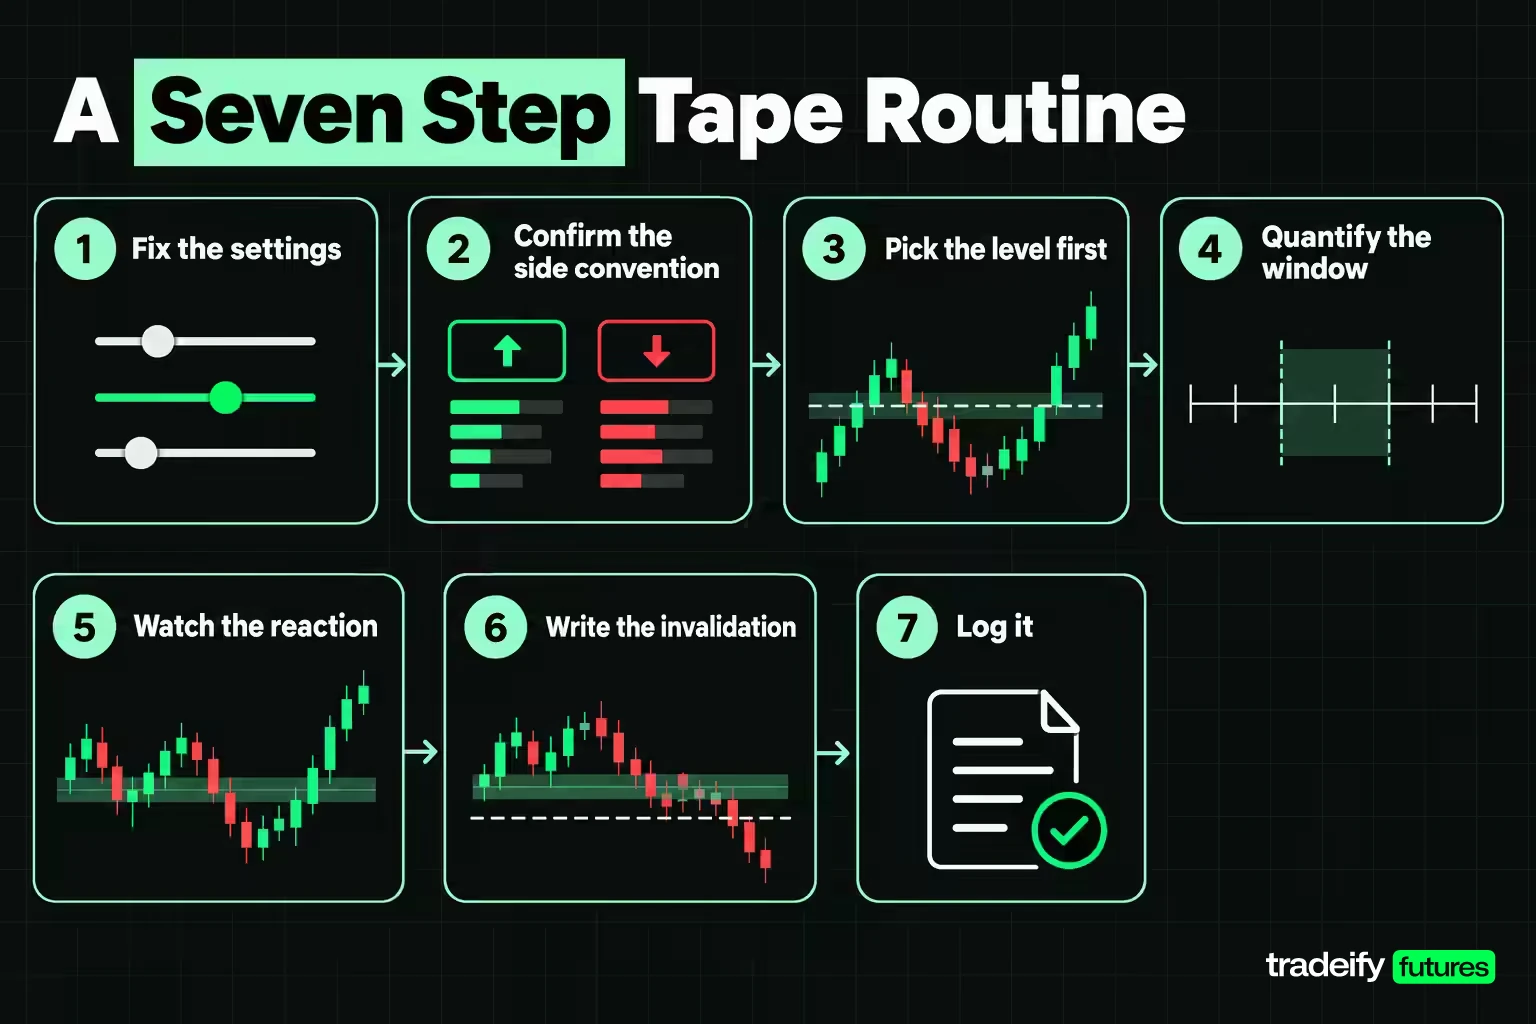
Tape reading improves fastest when every read follows the same steps, because then you can compare one session with another. This routine works on any platform.
- Fix the settings. Choose the size filter, aggregation and quote-row setting before the session, and write them down.
- Confirm the side convention. Find out whether your colors come from the exchange aggressor field or from a price comparison, and what the in-between color means.
- Pick the level first. Decide which price you are watching (a prior high, the session open, VWAP, a round number) before the tape starts moving there.
- Quantify the window. Count prints, total each side, note the two or three largest prints and estimate the pace. A quick tally beats eyeballing the color of the fastest rows.
- Watch the reaction. Note what price did in the 30 to 60 seconds after the burst, because that is where the read gets confirmed or broken.
- Write the invalidation. State in advance what would make the read wrong, usually price trading through the level and holding.
- Log it. Record the time, level, settings, your read and the outcome. Twenty logged reads teach more than a week of watching.
The sixth step is the one most traders skip, and it is the one that protects you. A tape read without a written invalidation turns into a story you keep rewriting to fit the next print, and that is how a scalp becomes a hold you never planned.
Combining the Tape With Charts and the Order Book
Time and sales works best as the last layer of a read, not the first. The chart tells you where to pay attention. The tape tells you what is happening when price gets there.
- Chart levels. Prior highs and lows, the opening range, VWAP and volume profile nodes give the tape a place to matter. A sell burst in the middle of nowhere is noise more often than a sell burst into yesterday's low.
- The order book and Level 2. Depth shows the resting side the tape cannot see. Absorption needs both: heavy prints on the tape and a bid that keeps refreshing in the book.
- Footprint charts and cumulative delta. These tools aggregate the same bid and ask volume into bars or a running total. They are easier to read after the fact. The raw tape is better for the exact moment.
One caution about depth. Resting orders can be cancelled before they trade, and the CFTC treats bidding or offering with the intent to cancel before execution as spoofing, including orders placed to create a false appearance of depth. That is one more reason to trust what traded over what was displayed.
Related lesson: Market Depth and Level II Data
Using Time and Sales for Day Trading Entries and Exits
Time and sales matters most to short-term traders, especially scalpers and day traders holding positions for seconds to minutes. For a swing trader, one print is irrelevant. For someone aiming for four ticks, the tape can be the difference between a clean entry and chasing.
Best times of day to watch time and sales
The tape is most informative when activity jumps. For US index futures that usually means:
- Scheduled data releases. The BLS Consumer Price Index, for example, is released at 8:30 AM ET, and the tape can go from quiet to frantic in a second.
- The US stock market open. The NYSE core session opens at 9:30 AM ET, and index futures often see a burst of activity around it.
- Tests of key levels. Any time price reaches a level you marked in advance.
In quiet midday trading or thin overnight hours, there are fewer prints and each one carries less information. A 10-lot at 3:00 AM ET may be a large share of the activity, while the same 10-lot at 9:31 AM ET is background.
Setting entries, stops and exits from tape prints
An illustrative MES plan built on the worked window: price holds 7,000.00 through the bid-side selling, the next ask print comes in at 7,000.25 with pace picking up, and a trader goes long 2 MES at 7,000.25.
- Stop. 6,999.50, below the level the tape says was absorbing. That is 0.75 points, $3.75 per contract or $7.50 for 2 contracts.
- Target. 7,001.75, 1.50 points away, which is $7.50 per contract or $15.00 for 2 contracts, a 2 to 1 reward-to-risk ratio.
- Exit early if the bid at 7,000.00 disappears and sell prints start trading 6,999.75, because the reason for the trade is gone even before the stop is hit.
These are illustrative numbers for the arithmetic, not a recommended setup. The point is that the tape gives you a specific invalidation level, which is what makes a short stop reasonable.
How time and sales informs order execution
The tape also helps with how you get filled, not just when.
- Pace and limit orders. If prints are slow and mostly at the bid, a buy limit at the bid may fill without paying the spread. If the tape is racing at the ask, a resting limit may never fill and a market order costs at least one tick.
- Sweeps and slippage. A tape full of same-timestamp sweeps tells you the book is thin. A market order in that market can slip several ticks, which on ES costs $12.50 per tick per contract.
- Size against the tape. If your order is large relative to typical prints, splitting it or working a limit avoids becoming the sweep everyone else is watching.
Related lesson: Scalping Futures
Time and Sales in Futures Versus Stocks
Time and sales reads differently in futures than in stocks, and most tape-reading material online is written for stocks.
- One venue. A CME futures contract trades on CME Globex, so the tape you see is the whole electronic market for that contract. Stock time and sales usually carries an exchange column for each trade, as Investopedia describes, because the same stock prints on more than one venue.
- An exchange aggressor field. CME publishes which side initiated each match, so futures traders often get the bid or ask side directly instead of an estimate.
- Contracts, not shares. One ES contract is $50 times the S&P 500 Index and one MES is $5 times it, so a 50-lot in ES carries ten times the exposure of a 50-lot in MES. Read size relative to the contract you are watching.
- Commodities and thinner contracts. Energy, metals and grain futures print less often than the index contracts and are more affected by scheduled reports. Trading volume in back-month contracts can be thin enough that a single print moves the last price.
Investopedia makes the same point for stocks: time and sales works better in high-volume markets. A thin tape produces prints, but each one says less about the broader market.
Algorithms and automated tape reading
Much of what prints on a modern tape is generated or read by algorithms. CME timestamps its time and sales data to the nanosecond, and automated systems react to each match in a fraction of the time it takes a human to see the row change color. Algorithms also split large orders into small pieces, which is one reason a big participant rarely shows up as one huge print.
That changes what a human can realistically do with the tape. You will not win on reaction speed. The useful human read is slower and contextual: did the selling at a level you chose in advance push price through it, or did it fail? Automated tools can count delta and flag sweeps for you. The judgment about whether a level matters is still yours.
How to Practice Reading Time and Sales
Tape reading is a pattern-recognition skill, and the only way to build it is exposure plus feedback. You can get both without risking money.
- Replay. Several platforms replay historical sessions with the time and sales window running. Sierra Chart's documentation describes how its time and sales window behaves during chart replay, including which combining settings apply.
- Simulation. A simulated account lets you place orders against a live feed. Remember that simulated fills come from the simulation engine, not from the tape, so a fill you got may not reflect what the real queue would have given you.
- One level, one session. Pick a single level each day, watch the tape every time price reaches it, and log the read and the outcome using the routine of fixed settings, quantified windows and a written invalidation.
Expect it to take weeks of logged reads before patterns feel familiar, and expect your first reads to be wrong often. That is normal, and it is not a sign you lack the instinct for it. The log is what turns a wrong read into a lesson instead of a reason to revenge-trade the next burst.
On our accounts, the Tradovate web app includes a time and sales module that shows each executed trade with a timestamp to the thousandth of a second, price, size and accumulated volume at that price, colored green for buys and red for sells, with a volume filter and no other settings. Accounts on Rithmic platforms get Level 1 CME data only, so you see the tape but not order book depth, while Level 2 is a paid Tradovate add-on. If you scalp off the tape on a simulated funded account, note that payout requests need over 50% of trades held longer than 10 seconds and over 50% of profit from those trades.
Time and Sales FAQ
How do you read time and sales?
Watch four things: the side of each print, its size, the pace of prints and the price that keeps trading. Count and total the prints over a short window rather than reacting to colors. Then check what price does next, because that confirms or breaks the read.
What do green and red mean in time and sales?
Green usually marks trades at the ask, where a buyer paid the offer. Red usually marks trades at the bid, where a seller accepted the bid. A third color often marks prints between the two or repeat fills, and conventions vary, so check your platform's settings.
Is time and sales the same as Level 2?
No. Level 2 shows resting orders waiting at each price, which can be cancelled at any time. Time and sales shows trades that already executed. Most tape readers use both, because depth shows the offered liquidity and the tape shows whether anyone takes it.
Why does time and sales show prices with zero volume?
A zero-size row is an indicative price or a quote, not a trade. CME states that a zero volume represents an indicative price, often shown before regular session hours. Leave those rows out of any volume or delta count.
Is time and sales useful for futures?
Yes, and futures have an advantage over stocks here. CME futures trade on a single matching engine and CME publishes the aggressor side of each match. That makes the futures tape a complete record of the contract rather than a blend of venues.
Time and Sales Risk Note
Trading futures involves substantial risk of loss, and a fast tape can move against a position faster than a stop can protect it. Futures use leverage, so a small price move can cost more than you expect. Prop-firm evaluation and funded accounts are simulated and do not reproduce live execution. The worked examples here are constructed for the arithmetic, and nothing on this page is trading advice.


