



TL;DR: Standard deviation indicator readings show how far recent closes sit from their average, which measures volatility, not direction. Convert the reading to a percent of price and compare it with the same market's own history before acting on it. On November 3, 2026, the E-mini S&P 500 reading was ordinary while the Nasdaq-100 reading sat near the top tenth of its year. Use it to size stops and positions, and pair it with a trend or momentum tool for direction.
If a 10-point stop worked all last week and keeps getting tagged this week, the market may not have changed direction at all. It changed volatility. The standard deviation indicator puts a number on that: how far price has been wandering from its own average lately.
That number decides whether your stop is sensible or a coin flip, whether a "big" candle is actually unusual, and whether the setup you like is happening in a quiet tape or a violent one.
This guide works through the statistic, the indicator built on it, the formula by hand, and how to read it on real E-mini S&P 500 (ES) and E-mini Nasdaq-100 (NQ) charts. Every market figure comes from daily and 5-minute futures bars measured for this guide, with the method stated next to each result.
What Is Standard Deviation
Standard deviation is a statistic that measures how widely a set of values spreads around its average. When the values cluster tightly, the standard deviation is small. When they spread out, it is large. StockCharts' ChartSchool describes it as a measure of dispersion around an average and, applied to prices, a measure of volatility.
The value is always zero or positive and is expressed in the same units as the data. If the data are prices in index points, the standard deviation is in index points too. That is why a standard deviation value tells you the typical distance between a value and the average, not the direction of anything.
Standard Deviation Symbols
Statisticians write the population standard deviation as the Greek letter sigma (σ), with the mean written as mu (μ). The standard deviation of a sample is usually written as a lowercase s. The difference matters on charts because platforms compute one or the other, and the two give slightly different numbers.
The 68-95-99.7 Rule of Standard Deviation
When data follow a normal (bell-shaped) distribution, the U.S. National Institute of Standards and Technology's engineering statistics handbook gives the coverage of each band: 68.27% of values fall within one standard deviation of the mean, 95.45% within two, and 99.73% within three.
So 95% is roughly two standard deviations, not three. Three standard deviations cover about 99.7%. Prices do not follow a clean normal distribution, though. John Bollinger's published rules warn against making statistical assumptions from the bands and note that, in practice, about 90%, not 95%, of data sit inside default two-deviation Bollinger Bands. On the ES and NQ daily data measured for this guide, closes landed outside a 20-day, two-deviation band on 26 of 252 sessions (10.3%) and 27 of 252 sessions (10.7%), more than double the 4.55% a normal curve would predict.
How the Standard Deviation Indicator Works
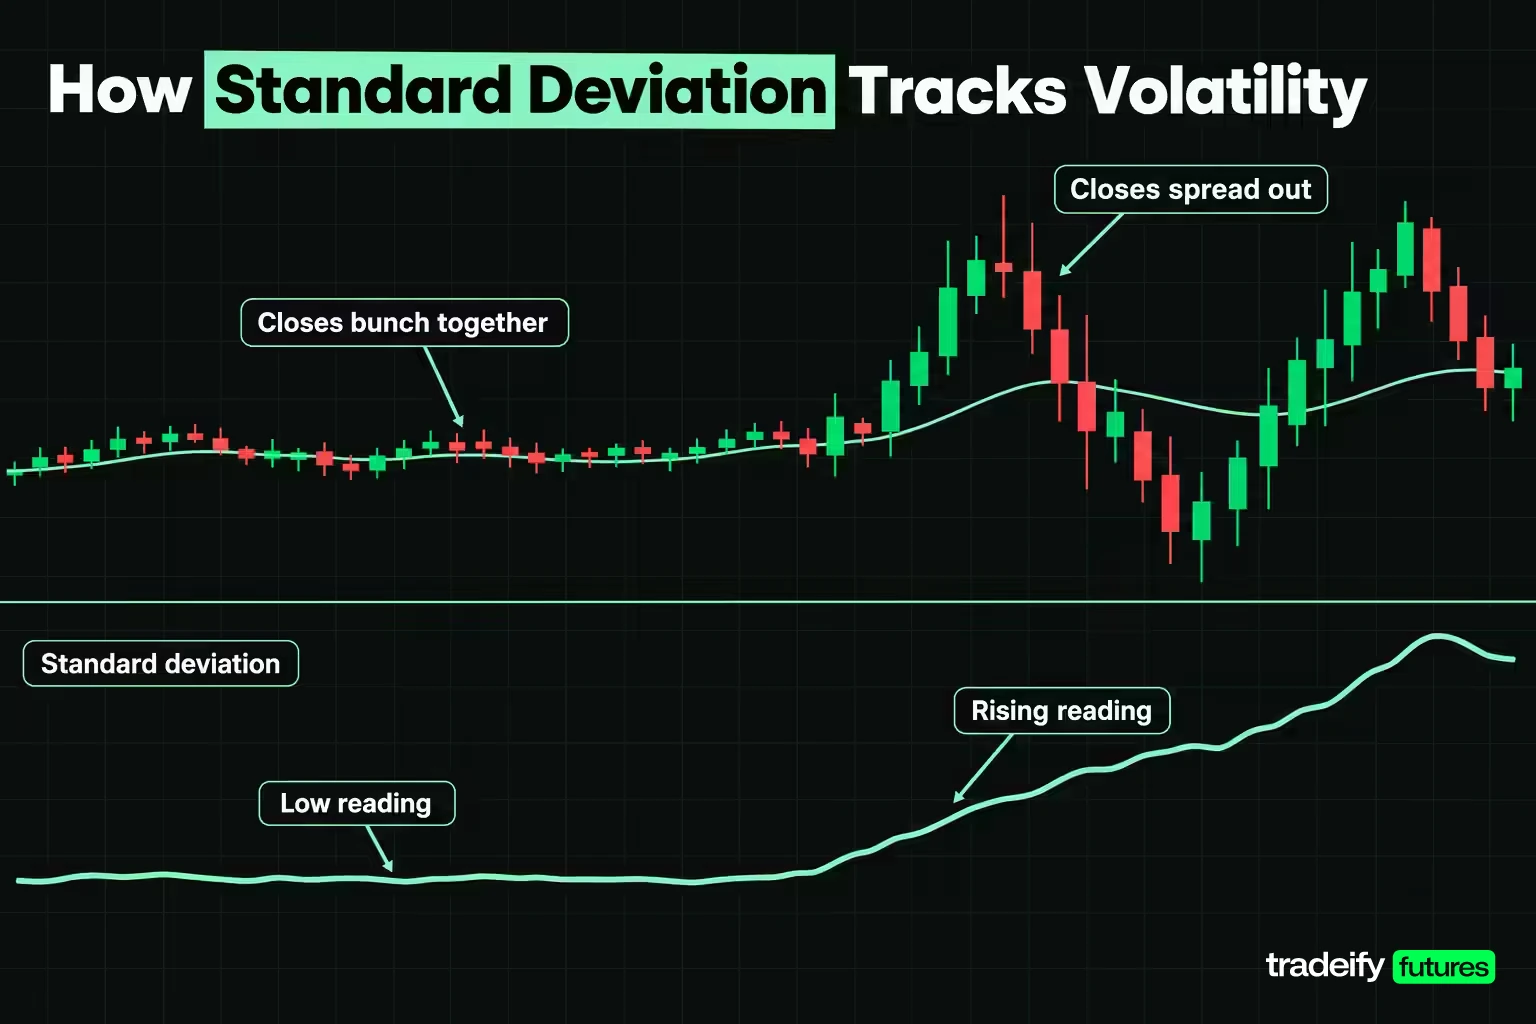
The standard deviation indicator applies the statistic to a rolling window of prices. On each bar it takes the last n closes, finds their simple moving average, and measures how far those closes sit from that average. The plot is one line in its own pane, rising when recent closes spread out and falling when they bunch together.
MetaTrader 5's help describes the indicator as a measure of market volatility relative to a moving average and notes that it is normally used as a part of other indicators, the best-known being Bollinger Bands. Fidelity's indicator guide puts it simply: the reading rises as prices become more volatile and heads lower as price action calms.
Three properties of the standard deviation indicator shape everything else about how you use it:
- It has no direction. A sharp rally and a sharp sell-off both lift the reading. StockCharts makes this point directly: volatility can rise on a large move either way, so you need price or another tool to tell you which way.
- It is in price units. A reading of 84.31 points on ES and 896.66 points on NQ on the same day cannot be compared as raw numbers. StockCharts notes that higher-priced securities show higher standard deviation values simply because of price.
- It is a memory of the window. The reading uses closes that have already happened. A large bar lifts it for as long as that bar stays inside the window, then the reading drops when the bar falls out the back, even if nothing happens on the current session.
Standard Deviation Formula and Worked Calculation
The standard deviation formula on a chart takes five steps. Fidelity's guide and StockCharts' ChartSchool lay out the same sequence:
- Average the last n closes (the n-period simple moving average).
- Subtract that average from each of the n closes.
- Square each difference.
- Add the squares and divide by n. The result is the variance.
- Take the square root of the variance.
Written out, the population form is SD = √( Σ (close - average)² ÷ n ). The sample form divides by n - 1 instead of n.
Standard Deviation Hand Check on Eight Numbers
A common practice question asks for the standard deviation of 5, 9, 8, 12, 6, 10, 6 and 8. The numbers sum to 64, so the mean is 8. The deviations from 8 are -3, 1, 0, 4, -2, 2, -2 and 0. Squared, they are 9, 1, 0, 16, 4, 4, 4 and 0, which sum to 38.
Divide 38 by 8 for a population variance of 4.75 and a population standard deviation of 2.18. Divide 38 by 7 for a sample variance of 5.43 and a sample standard deviation of 2.33. Both answers are correct; they answer different questions, and a chart platform has to pick one.
Standard Deviation on Twenty Closes
Twenty closes match the most common chart setting. The values in this table are round illustrative numbers, not real prices, so the arithmetic is easy to check. Their mean is 109.20.
| Close | Close minus the 109.20 mean | Squared deviation |
|---|---|---|
| 100.00 | -9.20 | 84.64 |
| 102.00 | -7.20 | 51.84 |
| 101.00 | -8.20 | 67.24 |
| 104.00 | -5.20 | 27.04 |
| 103.00 | -6.20 | 38.44 |
| 105.00 | -4.20 | 17.64 |
| 107.00 | -2.20 | 4.84 |
| 106.00 | -3.20 | 10.24 |
| 108.00 | -1.20 | 1.44 |
| 110.00 | 0.80 | 0.64 |
| 109.00 | -0.20 | 0.04 |
| 111.00 | 1.80 | 3.24 |
| 112.00 | 2.80 | 7.84 |
| 110.00 | 0.80 | 0.64 |
| 113.00 | 3.80 | 14.44 |
| 115.00 | 5.80 | 33.64 |
| 114.00 | 4.80 | 23.04 |
| 116.00 | 6.80 | 46.24 |
| 118.00 | 8.80 | 77.44 |
| 120.00 | 10.80 | 116.64 |
The squared deviations sum to 627.20. Divided by 20, the variance is 31.36, and its square root, the standard deviation, is 5.60. At the last close of 120.00, that is 4.67% of price.
Two details in this twenty-close standard deviation example are worth noticing. Squaring makes every term positive, which is why the indicator can never go negative. And squaring rewards distance: the two largest closes contribute 194.08 of the 627.20 total, about 31% of the dispersion from 2 of 20 bars. One outsized bar moves the reading far more than several ordinary ones.
Population or Sample Standard Deviation
Platforms do not agree on the divisor. StockCharts, Fidelity and MetaTrader 5 divide by n (the population form). TradingView's Pine Script function ta.stdev has a "biased" argument that defaults to true, which its reference defines as the population estimate; setting it to false gives the sample estimate. cTrader's built-in standard deviation divides by n - 1. In Excel, STDEV.P is the population form and STDEV.S the sample form.
On the twenty closes, the sample form gives 5.75 instead of 5.60. The gap depends only on the period: the sample reading is 2.60% larger at 20 periods, 3.77% larger at 14 and 5.41% larger at 10. Over the trailing year of ES and NQ data, switching the convention changed whether a close sat outside a two-deviation band on 3 of 252 ES sessions and 4 of 252 NQ sessions. If two tools disagree by about that margin, the convention is the likely cause, not a bug.
How to Read Standard Deviation Values on a Chart
A rising line means closes in the window are spreading farther from their average; a falling line means they are bunching together. That much is easy. The hard part is deciding whether a given standard deviation value is high or low, because the raw number depends on the instrument's price and its normal behavior.
Convert Standard Deviation to Percent of Price
StockCharts recommends dividing the standard deviation by the closing price to compare securities. The result is the reading as a percent of price, and it is the only version you can compare across instruments, timeframes and years.
On November 3, 2026, the 20-day standard deviation of ES daily closes was 84.31 points on a close of 7,596.75, which is 1.11% of price. The same day on NQ it was 896.66 points on a close of 28,305.75, or 3.17%. In raw points NQ looks more than ten times as volatile. In percent it was a bit under three times, which is still a big difference, and even that comparison needs each market's own history for context.
What High and Low Standard Deviation Looked Like on ES and NQ
A reading is only high or low relative to the same market's own history. The table profiles the 20-day reading, as a percent of price, across the trailing 252 sessions from November 3, 2025 to November 3, 2026.
| Instrument | Smallest | 10th percentile | 25th percentile | Median | 75th percentile | 90th percentile | Largest | Average |
|---|---|---|---|---|---|---|---|---|
| E-mini S&P 500 (ES) | 0.56% | 0.67% | 0.83% | 1.10% | 1.46% | 1.86% | 3.61% | 1.23% |
| E-mini Nasdaq-100 (NQ) | 0.67% | 0.93% | 1.32% | 1.91% | 2.42% | 3.11% | 4.74% | 1.97% |
Read the columns, not the cells. The NQ median of 1.91% sits above the ES 75th percentile of 1.46%, so a reading that is routine on NQ would be unusually high on ES. The busiest ES reading (April 23, 2026) was about six and a half times the quietest (August 31, 2026); on NQ the ratio was about seven.
Now place the November 3 readings in that profile. The ES reading of 1.11% sat at about the 51st percentile, right on its median: an ordinary week for ES. The NQ reading of 3.17% sat at about the 92nd percentile, in the busiest tenth of its year. Same day, same sell-off, very different conditions, and the raw point values hid it.
Standard Deviation as a Z Score
A Z score restates the same information as a position: subtract the window's average from the current close and divide by the standard deviation. Zero means price is on its average; +2 means two standard deviations above it; -2 means two below. This is the arithmetic behind the phrase "price looks stretched."
On November 3, 2026, ES closed at 7,596.75 against a 20-day average of 7,747.89. The gap of 151.14 points divided by the 84.31-point standard deviation gives a Z score of -1.79. NQ closed at 28,305.75 against an average of 29,815.54, a Z score of -1.68. The two markets had very different volatility but sat at a similar distance below their own averages, and the Z score is the only one of these numbers that puts them side by side.
Standard Deviation as a Volatility Measure
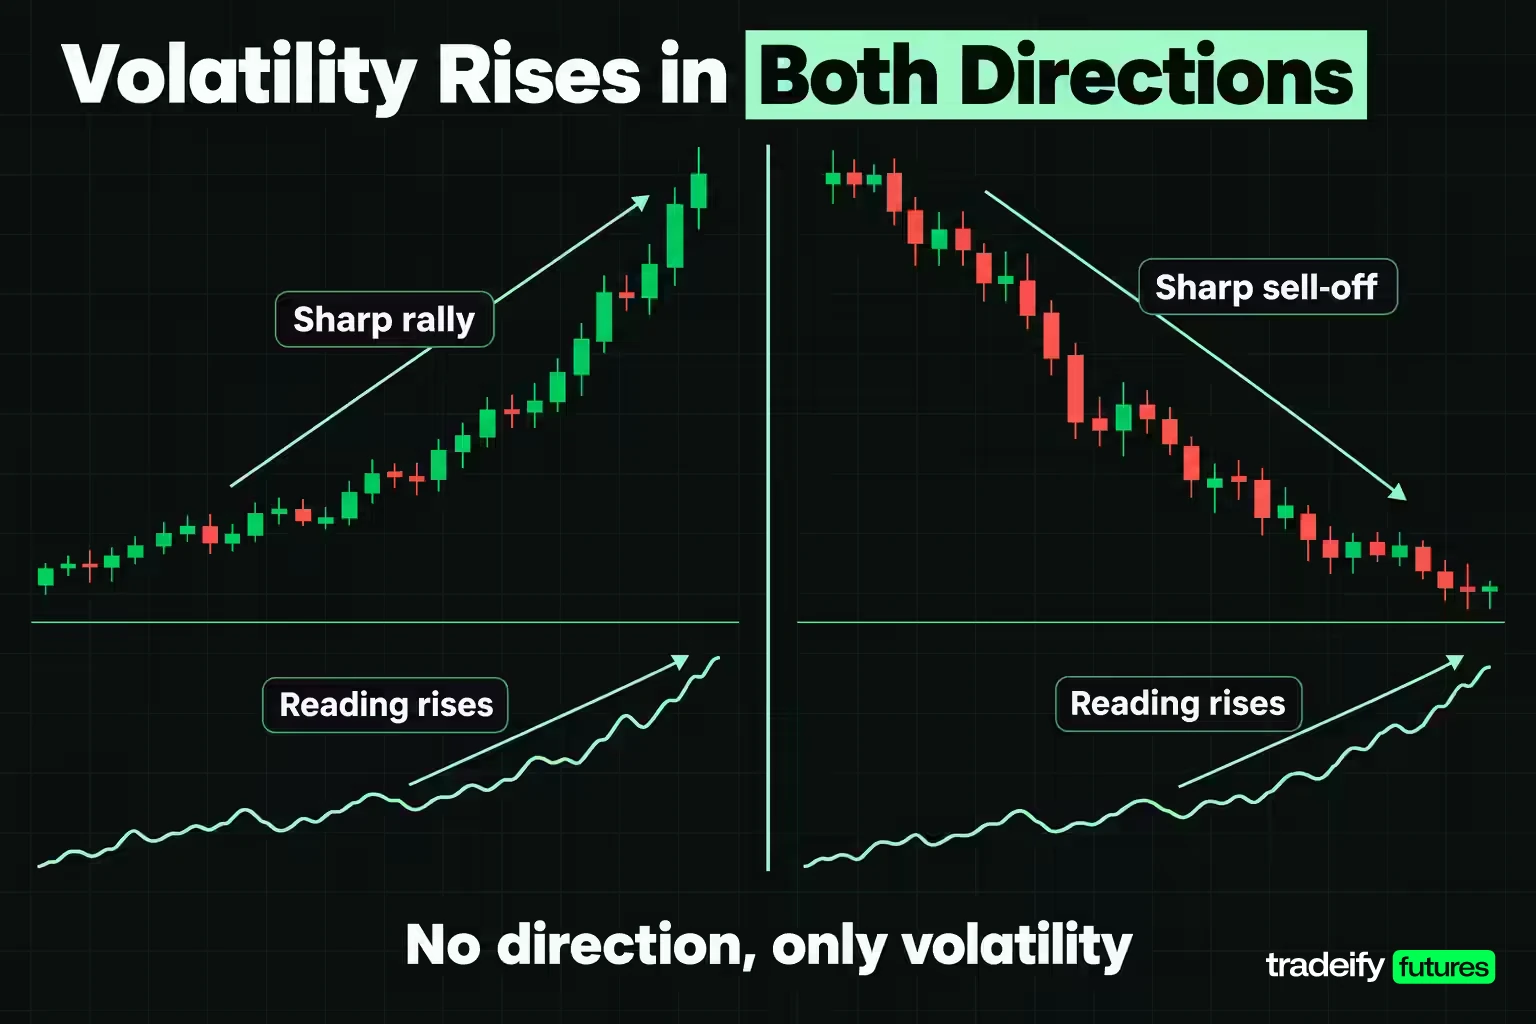
As a volatility measure, the standard deviation indicator describes how much price has been moving, and the direction of the line tells you whether that is increasing or calming. Fidelity's guide adds observations about context: tops that come with rising volatility over short periods tend to reflect nervous, indecisive traders, while tops with falling volatility over long time frames suggest a maturing bull market. Bottoms with falling volatility over long periods suggest boredom, and bottoms with sharply rising volatility over short periods suggest panic selling.
Those are descriptions, not triggers. The practical use is to decide what kind of market you are trading before you decide what to do in it. In a quiet tape, tight stops and fading extremes may fit. In a wide one, the same stop gets hit by ordinary noise, and the trade you were right about never gets the chance to work.
Rising and Falling Standard Deviation
MetaTrader 5's help states the common belief directly: a very low value suggests a spike may come soon, and a very high value suggests activity will probably decline. cTrader's documentation says something similar about complacency at low readings. That is a testable claim, so it was tested on a year of ES and NQ daily bars.
The method, run for this guide on Yahoo Finance's continuous ES and NQ daily futures data: every session from November 3, 2025 to November 3, 2026 with a complete 10-session forward window (242 sessions per market) was labeled quiet if its 20-day reading sat at or below the year's 20th percentile, and busy if it sat at or above the 80th. For each group the test measured how often the reading rose at least 10% at some point in the next 10 sessions, how often it ended those 10 sessions above the year's median, and its average change.
| Standard deviation group | Sessions | Reading rose 10% or more within 10 sessions | Above the median 10 sessions later | Average change in the reading |
|---|---|---|---|---|
| ES quiet | 47 | 93.6% | 19.1% | +42.6% |
| ES busy | 51 | 43.1% | 80.4% | -12.4% |
| ES all sessions | 242 | 52.1% | 49.6% | +8.3% |
| NQ quiet | 51 | 74.5% | 29.4% | +71.8% |
| NQ busy | 45 | 20.0% | 80.0% | -20.6% |
| NQ all sessions | 242 | 46.7% | 50.4% | +14.7% |
In that measurement, quiet readings did tend to widen. On ES, 93.6% of quiet sessions saw the reading rise at least 10% within ten sessions, against 52.1% for all sessions. But look at the next column: only 19.1% of quiet ES sessions had a reading above the year's median ten sessions later. Most of the widening was a calm window returning toward normal, not an explosion. Busy readings mostly stayed busy: about 80% were still above the median ten sessions later on both markets, even though the average reading eased.
What Quiet and Loud Standard Deviation Readings Did Next
A second test, also measured for this guide on Yahoo Finance's continuous ES and NQ daily data, sorted the 242 sessions from November 3, 2025 onward that had a full forward window into fifths by their 20-day reading, then measured the price move over the next ten sessions.
| Reading fifth | ES sessions | ES average reading | ES average absolute 10-session move | ES share higher after 10 sessions | NQ average absolute 10-session move | NQ share higher after 10 sessions |
|---|---|---|---|---|---|---|
| Lowest fifth | 48 | 0.67% | 1.65% | 39.6% | 2.87% | 39.6% |
| Second fifth | 48 | 0.89% | 1.62% | 58.3% | 1.80% | 47.9% |
| Middle fifth | 49 | 1.12% | 1.15% | 42.9% | 2.98% | 51.0% |
| Fourth fifth | 48 | 1.40% | 2.02% | 50.0% | 2.97% | 50.0% |
| Highest fifth | 49 | 2.13% | 2.66% | 83.7% | 4.09% | 69.4% |
In this guide's measurement, the busiest fifth was followed by the largest moves on both markets (2.66% on ES, 4.09% on NQ), so high readings did describe a market that kept moving. The quiet fifth was not followed by the smallest moves, which fits the "quiet becomes normal" result, but it carried no direction either: 39.6% of those sessions were higher ten sessions later on both markets.
Treat the 83.7% in the busiest ES fifth of this measurement with caution. The highest readings clustered around one episode in April 2026, and overlapping ten-session windows count the same rebound many times. One year of one market is a small sample. The defensible conclusion is narrow: the standard deviation indicator described current conditions well and said nothing reliable about direction.
Related lesson: What is volatility
A Real Standard Deviation Example on ES
A ten-session stretch of ES daily bars shows the standard deviation indicator doing exactly what its formula says, including the parts traders tend to misread. Each row uses the 20-day population standard deviation of closes.
| Date | ES close | 20-day average | Standard deviation | Percent of close | Z score |
|---|---|---|---|---|---|
| Oct 21, 2026 | 7,800.25 | 7,788.23 | 52.39 | 0.67% | 0.23 |
| Oct 22, 2026 | 7,704.50 | 7,785.10 | 55.35 | 0.72% | -1.46 |
| Oct 23, 2026 | 7,659.75 | 7,777.90 | 61.48 | 0.80% | -1.92 |
| Oct 26, 2026 | 7,714.50 | 7,776.29 | 62.69 | 0.81% | -0.99 |
| Oct 27, 2026 | 7,758.25 | 7,777.60 | 62.02 | 0.80% | -0.31 |
| Oct 28, 2026 | 7,783.25 | 7,780.99 | 60.36 | 0.78% | 0.04 |
| Oct 29, 2026 | 7,754.25 | 7,782.50 | 59.28 | 0.76% | -0.48 |
| Oct 30, 2026 | 7,614.00 | 7,774.34 | 69.76 | 0.92% | -2.30 |
| Nov 2, 2026 | 7,574.50 | 7,761.75 | 81.05 | 1.07% | -2.31 |
| Nov 3, 2026 | 7,596.75 | 7,747.89 | 84.31 | 1.11% | -1.79 |
Here is what a trader watching this pane would have seen. Through late October the reading drifted between about 0.7% and 0.8% of price, below the ES median for the year. On October 30, ES closed 140.25 points lower, the Z score dropped to -2.30, and the reading jumped from 59.28 to 69.76 points.
Then the lag shows up. On November 3, ES closed 22.25 points higher than on November 2, yet the reading kept rising to 84.31. Nothing new was getting more volatile; the October 30 and November 2 closes were simply still inside the window, pulling the average down and the dispersion up. The reading will stay elevated until those bars fall out of the 20-day window, then drop on its own.
The decision this supports is about sizing, not direction. A trader who had been using stops built for a 0.7% market was, by November 3, trading a 1.1% market. The indicator does not say whether ES bounces or keeps falling. It says yesterday's stop distance is probably too tight.
The Same Indicator on a 5-Minute Chart
The standard deviation indicator works on any bar length; only the meaning of the window changes. On a 5-minute chart, 20 bars cover 100 minutes.
During the November 3, 2026 regular session (9:30 AM to 4:00 PM ET), the 20-bar standard deviation of ES 5-minute closes ranged from 3.91 points on the 12:55 PM bar to 9.47 points on the 3:05 PM bar, with a median of 6.17. On the 3:55 PM bar it was 4.82 points. A midday lull and an afternoon push more than doubled the reading in a little over two hours, which is why an intraday trader reads the intraday pane, not the daily one, when setting stops.
Standard Deviation Indicator Settings
The standard deviation indicator settings come down to three choices: the period, the price source and the convention. None of them has a correct universal value.
- Period. Twenty is the most common choice because it matches the default Bollinger Bands setting, which John Bollinger calls a default, not a rule. cTrader's built-in standard deviation defaults to 14 periods, and StockCharts' defaults to 10. Shorter periods react faster and are noisier; longer periods are steadier and slower to recognize a change.
- Price source. Most tools use the close. Some let you pick the high, low or a typical price. NinjaTrader's StdDev method accepts any input series, for example the high.
- Convention. Population (divide by n) or sample (divide by n - 1). The sample reading is 2.60% larger at 20 periods and 5.41% larger at 10, so the shorter the period, the bigger the gap.
Matching the Standard Deviation Period to Your Timeframe
Translate the period into time before you pick it. Twenty daily bars is about a month of trading. Twenty 5-minute bars is 100 minutes. Twenty 1-minute bars is 20 minutes, which can swing hard on a single news print.
A sensible rule is to match the window to how long you expect to hold a trade and to the stop you are sizing. If your trades last 30 to 90 minutes, a 20-bar reading on 5-minute bars describes the right stretch of time. A daily reading is better used as context: is today's market quiet or loud compared with the past month?
StockCharts suggests one more setting: put a long moving average on the standard deviation itself, for example a 250-day average, so you can see when the current reading is above or below its own norm. That is a simple way to answer "high or low?" without a percentile table.
Adding Standard Deviation in Trading Platforms
Adding the standard deviation indicator takes a minute on most platforms. The steps that matter more are checking the period and confirming which convention the platform uses.
Standard Deviation in NinjaTrader 8
NinjaTrader's help guide says the platform ships with over 100 pre-built indicators, added through the Indicators window.
- Open the Indicators window from the chart toolbar icon, by right-clicking the chart background, or with the default Ctrl + I hot key.
- Type "standard deviation" in the Search box, or find StdDev in the Available list.
- Double-click it to move it to the Configured list.
- Set the period and input series in the Properties section, then apply.
NinjaTrader's documentation also notes that the source code of its system indicators can be viewed through New, then NinjaScript Editor, then Indicators in the Control Center. That is the most reliable way to confirm how the divisor is set.
Standard Deviation in TradingView
In TradingView, the Pine Script function ta.stdev(source, length, biased) returns the standard deviation. The reference states that biased defaults to true, which is the population estimate, and false gives the sample estimate. A one-line script such as plot(ta.stdev(close, 20)) adds a 20-period population reading in its own pane. TradingView's Help Center also lists related built-ins that use standard deviation, such as Bollinger Bands, Bollinger BandWidth and Historical Volatility. If you use a community script instead, read its inputs before trusting the number.
Standard Deviation in MetaTrader 5
MetaTrader 5 lists Standard Deviation under its Trend Indicators. Its published formula divides the sum of squared deviations by N, the population form, and is built from a period N and an applied price, so check both inputs when you add it.
Using Standard Deviation Step by Step
This routine turns a standard deviation reading into a decision. The order matters because each step depends on the one before it.
Reading the Standard Deviation Before a Trade
- Add the indicator with a period that matches your holding time, and confirm whether the platform divides by n or n - 1.
- Divide the reading by the current close to get a percent of price.
- Check where that percent sits in the same market's recent history: below its long-run average, near it, or in the top tenth.
- Read the direction of the line. Rising means the window is getting wider; falling means it is calming or a big bar just left the window.
- Check the chart for which bars are driving the reading. One large bar inside the window inflates it until that bar drops out.
- Compute the Z score if you care where price sits relative to its average, not just how volatile it is.
Acting on the Standard Deviation Reading
Once the standard deviation reading is in context, turn it into risk and record it.
- Turn the reading into a stop distance in points, then into dollars per contract, then into a position size that fits your risk limit.
- Get direction from somewhere else: trend structure, a moving average, momentum or your setup rules.
- Log the reading and its percentile next to the trade in your journal, so your next "is this high?" question has your own answer.
If you do one thing after reading this, add the indicator to the chart you actually trade, divide today's reading by price, and write down where it sits against the last few months. That single number will tell you more about tomorrow's stop than any fixed rule of thumb.
Standard Deviation Trading Strategies
No standard deviation reading is a buy or sell signal by itself. These three standard deviation trading frameworks use it as a filter or a sizing input inside a plan with its own entry rules. Each is described as a hypothetical approach, with what would confirm it and what would invalidate it.
Volatility Expansion Breakout With Standard Deviation
The idea: after a long quiet stretch, a break out of a range on a rising reading can mark the start of a larger move. The condition is a reading in the bottom fifth of its own history while price holds a defined range. The trigger is a close outside the range with the reading turning up. Bollinger's own rules note that closes outside the bands are initially continuation signals, not reversal signals, which is the logic behind many volatility breakout systems.
What invalidates it: price returns inside the range within a bar or two, or the reading jumps on a single bar with no follow-through. In a one-year test on ES and NQ daily bars, quiet readings widened often, but the widening carried no direction, so the range break has to supply it.
Z Score Mean Reversion With Standard Deviation
The idea: in a sideways market, a close two standard deviations from the average may snap back toward it. The condition is a flat moving average and a reading at or below its median, so you are not fading a trending market. The trigger might be a Z score beyond ±2 followed by a bar that closes back toward the average.
What invalidates it: the reading is rising fast, the average is sloping, or price keeps closing beyond the band. In trending markets, Bollinger notes, price can walk along a band for a long time, and ES and NQ daily data from November 2025 to November 2026 showed closes beyond two deviations on roughly one session in ten.
Standard Deviation as a Regime Filter
The simplest strategy use is a switch. When the reading is in the top fifth of its history, trade smaller and wider, or stand aside. When it is in the bottom fifth, tighten targets and expect smaller ranges. When it is near its median, run your normal plan. The filter does not create trades; it stops you from running a quiet-market playbook in a loud market, which is where many stopped-out-then-right trades come from.
Standard Deviation Stops and Entries
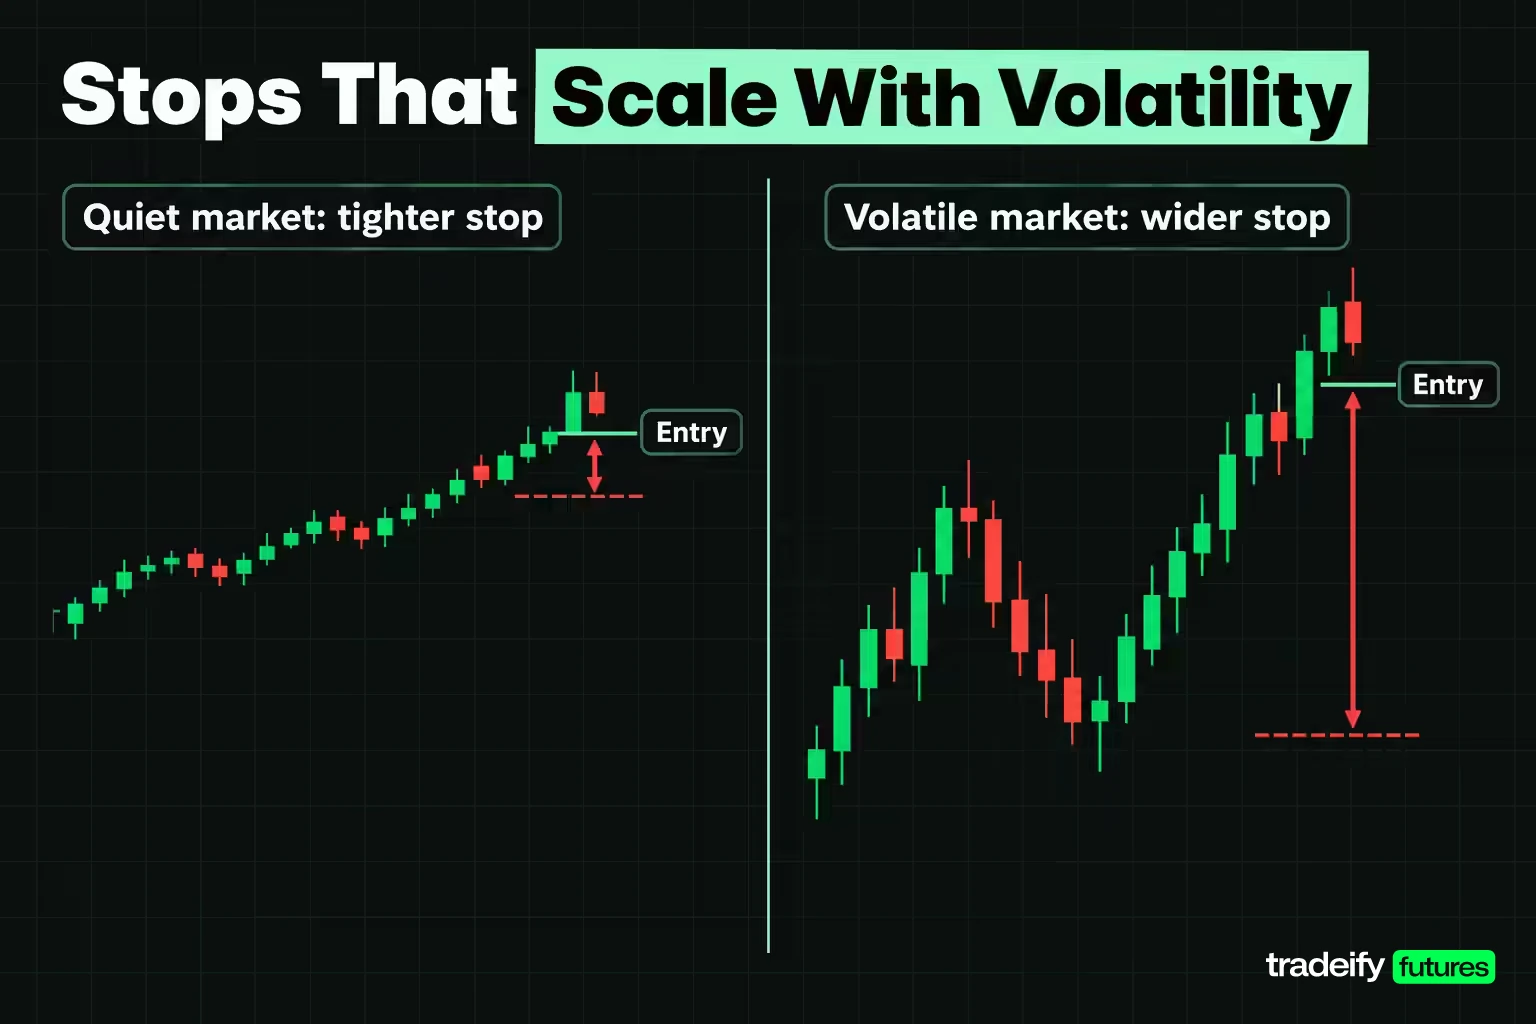
The most practical use of the standard deviation indicator is setting a stop distance that scales with conditions. A fixed 10-point stop can be generous in a quiet tape and useless in a loud one. A stop sized from the reading adjusts automatically.
Here is what that looked like on November 3, 2026, priced on the Micro E-mini S&P 500 (MES, $5 per index point) and the Micro E-mini Nasdaq-100 (MNQ, $2 per index point). The figures are illustrations of the arithmetic, before commissions and slippage.
| Stop basis | Distance in points | Risk per micro contract |
|---|---|---|
| ES daily, 1 standard deviation | 84.31 | $421.55 per MES |
| ES daily, 2 standard deviations | 168.62 | $843.10 per MES |
| ES daily, 14-period ATR | 90.17 | $450.85 per MES |
| NQ daily, 1 standard deviation | 896.66 | $1,793.32 per MNQ |
| ES 5-minute, 1 standard deviation | 4.82 | $24.10 per MES |
| ES 5-minute, 2 standard deviations, rounded to the tick | 9.75 | $48.75 per MES |
The daily readings show why day traders rarely use them directly for stops: a one-deviation daily stop on a single MES risked $421.55. The temptation, when the reading jumps, is to keep the old stop and the old size because the setup looks the same. The chart may look the same; the noise around it is not. The 5-minute reading at the 3:55 PM bar gives a stop measured in single-digit points. MES trades in 0.25-point ticks worth $1.25, so a two-deviation distance of 9.64 points rounds out to 9.75 points, or 39 ticks.
Using Standard Deviation as an Entry Filter
For entries, the standard deviation reading works best as a filter. Some traders skip entries when the intraday reading is in its top tenth because the stop needed to survive the noise is too wide for their risk limit. Others wait for a reading to turn down after a spike before fading a move. Both are rules about when to act, not about which way.
A standard deviation stop is a starting distance, not a guarantee. A fast market can fill a stop order well beyond its price, and a gap can jump it entirely.
Related lesson: Average true range
Standard Deviation as a Risk Measure
As a risk measure, standard deviation tells you how much price has typically moved around its average. That makes it useful for sizing, and it sits inside common risk statistics too: TradingView's Sharpe ratio, for example, divides by the standard deviation of portfolio returns. It is not the same as how much you can lose.
The gap between the two is the tails. A normal curve puts 4.55% of values beyond two standard deviations. In this guide's own measurement of ES and NQ daily closes from November 2025 to November 2026, closes landed outside a 20-day, two-deviation band on 10.3% and 10.7% of sessions. Big moves happened more than twice as often as the bell curve suggests, which is why a stop sized at two deviations will be hit by "rare" moves more often than the textbook implies.
Sizing a Position From Standard Deviation
Sizing from the reading follows one chain: stop distance in points, times dollars per point, equals risk per contract; your risk budget divided by that figure is the most contracts you can hold. With an illustrative $500 risk budget and the ES 5-minute two-deviation stop of 9.75 points, each MES risks $48.75. $500 divided by $48.75 is 10.26, which rounds down to 10 MES and $487.50 at risk. With a one-deviation daily stop rounded to 84.50 points, each MES risks $422.50, so the same budget fits one contract.
The same rule produced a tenfold difference in position size. That is the point of reading volatility rather than copying a fixed stop: when the reading doubles, size falls so the dollar risk stays the same. It feels like trading smaller for no reason. It is actually trading the same risk in a bigger market. The win-rate math moves with the target, not the stop: a target twice the stop distance breaks even at a 33.3% win rate before costs.
On our accounts, every position must be closed by 4:45 PM ET with no overnight or swing holds, so a stop sized from a multi-day daily reading does not fit a single-session trade; the intraday reading is the relevant one. Contract limits also cap size regardless of what the volatility math allows, for example 4 minis or 40 micros on a 50K account. You can chart the standard deviation indicator on the platforms we support, including NinjaTrader, TradingView through the Tradovate connection, Tradovate, WealthCharts, Tradesea, Quantower, Sierra Chart and R Trader Pro. Our evaluation and funded accounts are simulated.
Related lesson: Volatility based position sizing
Combining Standard Deviation With Other Indicators
The standard deviation indicator says how much, never which way, so it pairs naturally with tools that supply direction. Bollinger's rules give a useful guardrail: combine indicators that are not directly related, because two momentum indicators are not better than one. Pairing standard deviation with Bollinger Bands, for instance, adds no new information, since the bands are built from it.
| Tool | What it adds to standard deviation | Shared information |
|---|---|---|
| Bollinger Bands | Draws the same reading on the price chart as a moving average plus and minus two deviations | Fully shared; BandWidth equals four times the coefficient of variation |
| Average true range (ATR) | Bar size including gaps from the prior close | Partly shared; both rise in fast markets |
| Moving average slope | Trend direction, so you know which way a volatility expansion is resolving | None on direction |
| RSI or another momentum oscillator | Whether a stretched move is losing momentum | None on volatility |
| Volume | Whether participation confirms the move that lifted the reading | None on volatility |
Bollinger's BandWidth is four times the standard deviation divided by the middle band. On November 3, 2026, it was 4.35% for ES, the same 1.11% reading restated. A trend filter such as a sloping moving average tells you whether to treat a rising reading as a breakout or a sell-off, and a momentum oscillator can show whether a two-deviation stretch is fading.
Standard Deviation vs ATR
Average true range and standard deviation are often swapped as if interchangeable. They are not. ATR measures how big individual bars are, counting gaps from the prior close. Standard deviation measures how spread out closes are around their average; a bar counts only through its close.
On ES, the two readings (each as a percent of price) correlated at 0.79 from September 30, 2024 to November 3, 2026, but only 0.37 over the trailing 252 sessions. On NQ the figures were 0.64 and 0.07. In calmer stretches they can disagree badly: a slow, steady drift spreads closes away from their average and lifts standard deviation without making bars any bigger. Use ATR when the question is "how big is a normal bar?" and standard deviation when it is "how far has price traveled from its average?"
Related lesson: Bollinger Bands
Advantages of Standard Deviation
The standard deviation indicator earns its place on a chart for a few concrete reasons:
- It is transparent. The formula is five steps you can check by hand, so there is no hidden smoothing to second-guess.
- It is comparable once normalized. Divided by price, it lets you compare ES with NQ, or this month with last year.
- It scales stops and size. It turns "the market feels wild" into a number of points you can price per contract.
- It builds other tools. Bollinger Bands, Z scores and many volatility filters rest on it, so understanding it explains them too.
- It works on any timeframe. The same calculation applies to 1-minute, 5-minute and daily bars.
Standard Deviation Limitations and False Signals
The standard deviation indicator's weaknesses come straight from its formula, and most bad trades with it come from ignoring one of these:
- No direction. A rising reading after a rally and after a crash looks the same. cTrader's documentation lists the lack of directional bias as a core limitation.
- It lags, and it drops off. The reading is built from past closes, so it trails price. On ES it kept rising for two sessions after the October 30, 2026 sell-off even as price bounced. When a large bar leaves the back of the window, the reading falls on a quiet day, which can look like a "volatility contraction" that never happened.
- Prices are not normal. Bollinger warns against statistical assumptions from the bands, and this guide's measurement of a year of ES and NQ daily closes found two-deviation closes on about one session in ten, not one in twenty.
- The number depends on settings and convention. Period, price source and the n or n - 1 divisor all move the reading, so two platforms can disagree.
- Quiet does not mean a breakout is coming. In a one-year ES and NQ test, quiet readings mostly returned toward normal rather than exploding, and they said nothing about direction. Treating every low reading as a squeeze setup produces false signals.
- Continuous futures data can mislead. An unadjusted continuous chart jumps when the front month rolls, and that jump can inflate the reading for a full window. The ES and NQ figures in this guide use such a series, so treat roll weeks with care.
Is Standard Deviation a Lagging Indicator
Yes. The standard deviation indicator is calculated entirely from closes that have already happened, so it confirms volatility after it shows up rather than predicting it. That is not a flaw to fix; it is what a trailing measure does. Use it to describe the market you are in, and get timing and direction from price.
Standard Deviation Indicator FAQ
What does a standard deviation value tell you?
It tells you how far values typically sit from their average. On a price chart, a higher standard deviation means recent closes were more spread out, so the market has been more volatile. It says nothing about direction.
What is the standard deviation of 5, 9, 8, 12, 6, 10, 6, 8?
The population standard deviation is 2.18 and the sample standard deviation is 2.33. The mean is 8 and the squared deviations sum to 38, so divide by 8 for the population form or by 7 for the sample form before taking the square root.
Is 95% 3 standard deviations?
No. In a normal distribution about 95% of values (95.45%) fall within two standard deviations of the mean. Three standard deviations cover about 99.7%. Market prices have fatter tails, so real price data often break these bands more often.
What is the appropriate statistical symbol for standard deviation?
The population standard deviation is written with the Greek letter sigma (σ). A sample standard deviation is usually written as a lowercase s. The mean is written as mu (μ) for a population.
What is the best setting for the standard deviation indicator?
Twenty periods is the most common setting because it matches Bollinger Bands' default, and 14 and 10 are common platform defaults. Pick a period that covers roughly the time you hold a trade. Then measure that setting's own range on your market before judging any reading.
Is standard deviation better than ATR?
Neither is better; they measure different things. ATR measures bar size including gaps, while standard deviation measures how spread out closes are around their average. A common split is ATR for stop distances and standard deviation for judging how stretched price is.
Standard Deviation Trading Risk
This standard deviation indicator guide is for education only and is not investment advice or a recommendation to trade any product. The ES and NQ figures describe one historical period on an unadjusted continuous futures series, without commissions or slippage, and they do not predict future results. Futures trading uses leverage, and losses can exceed what you expect from a single stop, especially in fast markets or gaps. Evaluation and funded prop accounts are simulated, and results there may differ from live markets.


