



TL;DR: Bollinger Bands are a 20-period moving average with bands two standard deviations above and below it. A touch of a band shows price is relatively high or low, not that it must reverse. On four years of ES and NQ daily bars, squeezes were followed by wider bands far more often than other sessions. They did not reliably pick the direction, so the squeeze is a volatility warning, not an entry.
Price closes above the upper Bollinger Band and the urge to fade it shows up right away. The chart looks stretched, the indicator line is right there, and a short feels like the disciplined, contrarian thing to do. Sometimes it works. Often the market keeps walking up the band and the trade becomes a fight.
Bollinger Bands are one of the most useful tools on a chart once you know what they actually measure, and one of the most misused when every touch gets treated as a signal. The band is telling you where price sits. Whether that is a trade is a separate decision. This guide covers the formula worked by hand, what the 20 and the 2 do, how %b and BandWidth turn the bands into numbers, and the W-bottom and M-top patterns. It also tests two popular claims, the squeeze and the "close outside the band means reversal" idea, on E-mini S&P 500 (ES) and E-mini Nasdaq-100 (NQ) futures data, with the method stated so you can repeat it.
What Bollinger Bands Are and Who Created Them
Bollinger Bands are a volatility-based trading band created by John Bollinger in the early 1980s. They place an upper and a lower band around a moving average, and the distance between them comes from the standard deviation of recent closes. The name came on air, when a Financial News Network host asked Bollinger what he called the lines on his chart.
The idea that made them different was adaptation. Before Bollinger Bands, the most popular trading bands were percentage bands, a moving average shifted up and down by a fixed percent. A 7% band never changed width, so traders kept redrawing it by hand, and Bollinger noted that bullish traders tended to redraw it bullishly and bearish traders bearishly. Keltner-style bands use Average True Range to adapt, and Donchian bands use recent highs and lows. Bollinger chose the standard deviation, so the bands widen on their own when the market gets volatile and narrow when it goes quiet.
What the bands answer is narrow and useful. Bollinger's first rule says the bands provide a relative definition of high and low: by definition, price is high at the upper band and low at the lower band. That is a statement about where price sits against its own recent behavior. It is not a forecast. Bollinger Bands is a registered trademark of John Bollinger.
The Three Lines in Bollinger Bands
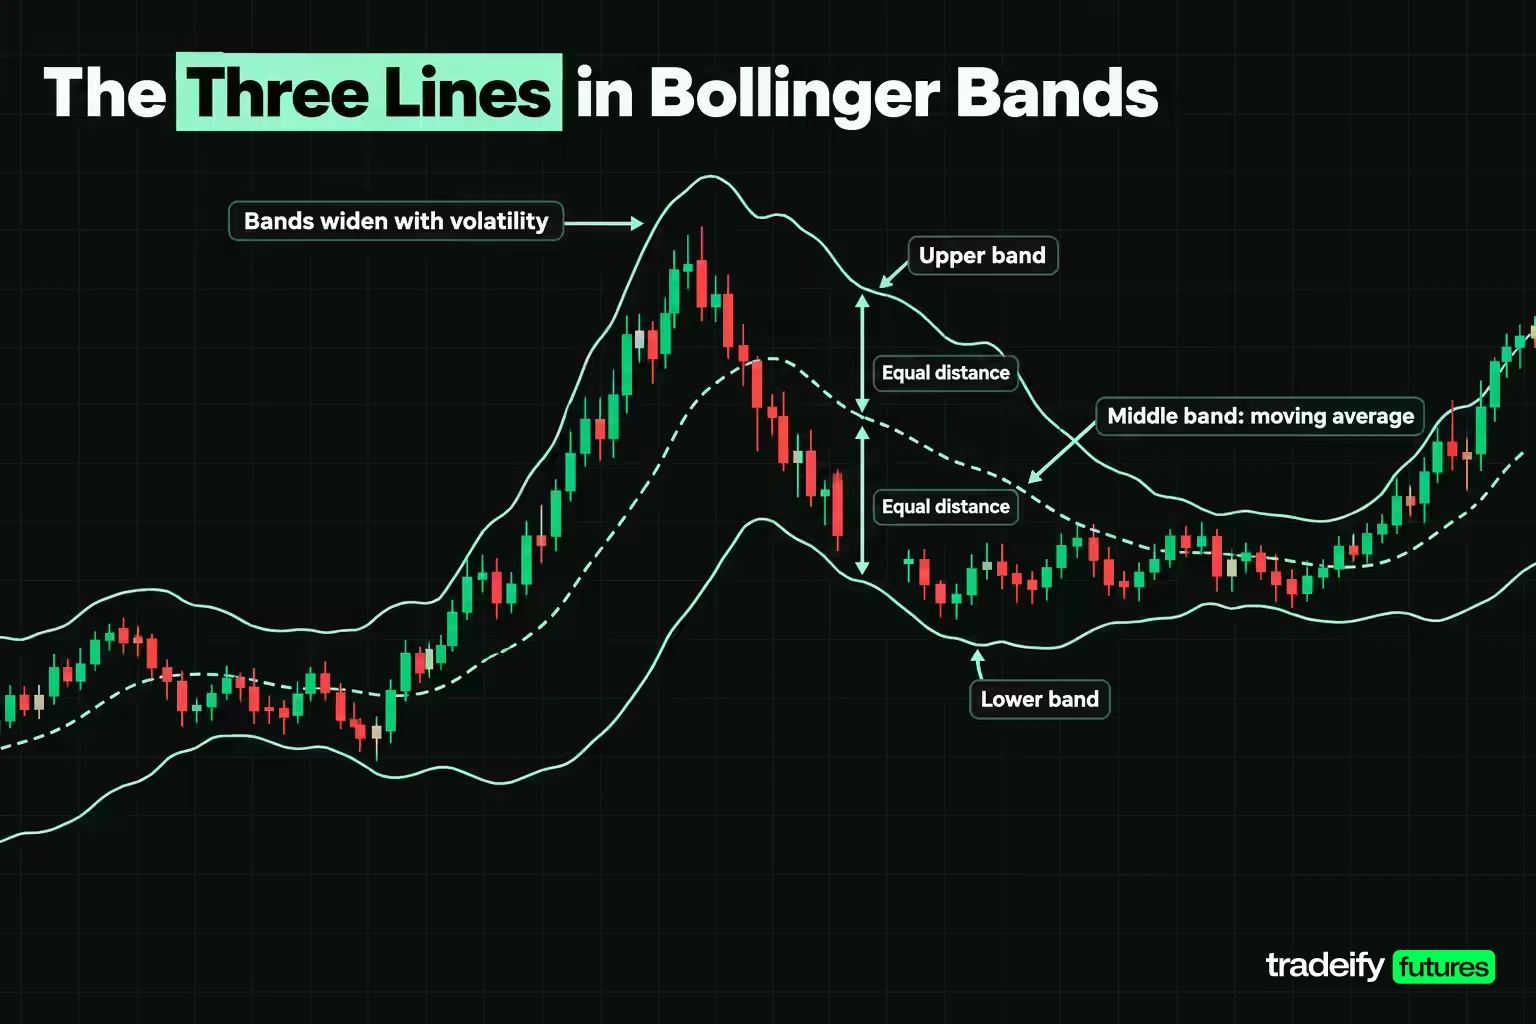
The three lines in Bollinger Bands are a middle band, an upper band and a lower band, all built from the same window of closing prices.
- Middle band. A simple moving average of closes, 20 periods by default. Bollinger's rules say it should describe the intermediate-term trend rather than be the best average for crossovers.
- Upper band. The middle band plus a multiple of the standard deviation of the same 20 closes, 2 by default.
- Lower band. The middle band minus the same multiple.
A simple average sits in the middle for a reason of consistency. The standard deviation is measured around a simple average, so Bollinger uses the same simple average for the center line. Exponential versions exist, and Bollinger's rules say that if you use one, the exponential method has to be used for both the middle band and the standard deviation.
Because both outer bands come from one standard deviation figure, they always sit the same distance from the middle line. When a few violent sessions enter the window, the standard deviation jumps and the bands spread apart. When those sessions drop out of the back of the window 20 bars later, the bands can snap narrower even if today's bar is ordinary. That second effect surprises a lot of traders, and it is why the width can change sharply on a quiet day.
Bollinger Bands Formula With a Worked Calculation
The Bollinger Bands formula takes three steps. Average the last N closes for the middle band, measure the standard deviation of those same closes, then add and subtract K times that deviation.
- Middle band = simple moving average of the last N closes
- Standard deviation = square root of the average squared distance of each close from the middle band
- Upper band = middle band + (K x standard deviation)
- Lower band = middle band - (K x standard deviation)
The defaults are N = 20 and K = 2.
Bollinger Bands Hand Check on Round Numbers
Doing the Bollinger Bands math once by hand removes most of the mystery. Take 20 illustrative closes made of the sequence 100, 102, 104, 106, 108, 110, 108, 106, 104, 102, repeated twice.
| Step | Value | How it is obtained |
|---|---|---|
| Sum of the 20 closes | 2,100 | the ten values sum to 1,050 and appear twice |
| Middle band | 105 | 2,100 divided by 20 |
| Sum of squared deviations | 180 | the ten squared distances from 105 sum to 90, twice |
| Standard deviation | 3 | square root of 180 divided by 20, which is the square root of 9 |
| Upper band | 111 | 105 plus 2 times 3 |
| Lower band | 99 | 105 minus 2 times 3 |
| Band width | 12 points | 111 minus 99 |
| BandWidth | 11.43% | 12 divided by 105 |
| %b for a close at 108 | 0.75 | 108 minus 99, divided by 12 |
The distances from 105 are 5, 3, 1, 1, 3, 5, 3, 1, 1 and 3 points. Squared, they are 25, 9, 1, 1, 9, 25, 9, 1, 1 and 9, which sum to 90. The set appears twice, so 180 in total, and 180 divided by 20 is 9.
Bollinger Bands on Recent E-mini S&P 500 Closes
Here are Bollinger Bands at 20 and 2 on the last ten completed ES daily sessions before this guide was written, calculated from the continuous front-month series on Yahoo Finance's chart service. These are historical values as of November 4, 2026, shown to illustrate the math.
| Session | Close | Middle band | Standard deviation | Upper band | Lower band | %b | BandWidth % |
|---|---|---|---|---|---|---|---|
| 2026-10-22 | 7,704.50 | 7,785.10 | 55.35 | 7,895.80 | 7,674.40 | 0.14 | 2.84 |
| 2026-10-23 | 7,659.75 | 7,777.90 | 61.48 | 7,900.86 | 7,654.94 | 0.02 | 3.16 |
| 2026-10-26 | 7,714.50 | 7,776.29 | 62.69 | 7,901.66 | 7,650.91 | 0.25 | 3.22 |
| 2026-10-27 | 7,758.25 | 7,777.60 | 62.02 | 7,901.63 | 7,653.57 | 0.42 | 3.19 |
| 2026-10-28 | 7,783.25 | 7,780.99 | 60.36 | 7,901.71 | 7,660.27 | 0.51 | 3.10 |
| 2026-10-29 | 7,754.25 | 7,782.50 | 59.28 | 7,901.07 | 7,663.93 | 0.38 | 3.05 |
| 2026-10-30 | 7,614.00 | 7,774.34 | 69.76 | 7,913.85 | 7,634.82 | -0.07 | 3.59 |
| 2026-11-02 | 7,574.50 | 7,761.75 | 81.05 | 7,923.86 | 7,599.64 | -0.08 | 4.18 |
| 2026-11-03 | 7,596.75 | 7,747.89 | 84.31 | 7,916.51 | 7,579.26 | 0.05 | 4.35 |
| 2026-11-04 | 7,720.50 | 7,741.28 | 80.95 | 7,903.17 | 7,579.38 | 0.44 | 4.18 |
Read the last row. The close of 7,720.50 sat inside a band running from 7,579.38 to 7,903.17, a little under the middle band, so %b printed 0.44. The two sessions before the bounce closed below the lower band, and the band widened from 3.05% to 4.35% of the middle band in three sessions because the drop on October 30 added large deviations to the window. Those two closes below the band were followed by a 146.00 point rise from the November 2 close to the November 4 close, which is one example, not a rule.
Population or Sample Standard Deviation in Bollinger Bands
The standard deviation setting is the hidden reason two Bollinger Bands charts can disagree. Bollinger states that he uses the population calculation, dividing by N. Spreadsheet functions and some code libraries default to the sample calculation, dividing by N minus 1.
At 20 periods, the sample version is always about 2.6% wider, because the square root of 20 divided by 19 is 1.026. On the round-number series, the sample standard deviation is 3.08 instead of 3, which moves the bands to 111.16 and 98.84. Over the last 252 ES sessions that difference changed whether a close counted as inside the bands on 3 sessions, and on 4 NQ sessions. Small, but enough to start an argument about whether a band was "really" tagged.
Bollinger Bands Settings Beyond 20 and 2
Bollinger Bands settings of 20 and 2 mean a 20-period simple moving average with bands two standard deviations above and below it. Bollinger's own rules call these defaults and nothing more, and say that the parameters a given market or task needs may be different.
His rule 11 is the one worth testing. For consistent containment, if you lengthen the average you raise the multiplier, from 2 at 20 periods to 2.1 at 50 periods. If you shorten it, you lower the multiplier, to 1.9 at 10 periods. His rule 14 adds that prices are not normally distributed, so in practice about 90%, not the 95% a textbook bell curve suggests, of data sits inside the default bands.
How Much Price the Bollinger Bands Contain
Here is how often closes stayed inside the Bollinger Bands across eight settings, measured on the 252 ES and NQ daily sessions from November 4, 2025 to November 4, 2026.
| Period and multiplier (this guide's ES and NQ calculation) | ES closes inside | ES share inside | NQ closes inside | NQ share inside |
|---|---|---|---|---|
| 10 periods, 1.9 deviations | 224 of 252 | 88.9% | 223 of 252 | 88.5% |
| 10 periods, 2.0 deviations | 234 of 252 | 92.9% | 229 of 252 | 90.9% |
| 20 periods, 1.9 deviations | 217 of 252 | 86.1% | 217 of 252 | 86.1% |
| 20 periods, 2.0 deviations (default) | 226 of 252 | 89.7% | 225 of 252 | 89.3% |
| 20 periods, 2.1 deviations | 230 of 252 | 91.3% | 234 of 252 | 92.9% |
| 50 periods, 2.0 deviations | 227 of 252 | 90.1% | 216 of 252 | 85.7% |
| 50 periods, 2.1 deviations | 234 of 252 | 92.9% | 223 of 252 | 88.5% |
| 50 periods, 2.5 deviations | 244 of 252 | 96.8% | 240 of 252 | 95.2% |
In this guide's ES and NQ calculation, the default 20 and 2 setting lands almost exactly on Bollinger's 90% figure: 89.7% on ES and 89.3% on NQ. So a close outside the default bands happens on roughly one session in ten. That is uncommon, but it is not rare enough to treat as an extreme by itself.
Bollinger's 10-period guidance held on both markets in this calculation, with 1.9 deviations bringing containment back near the default's level. The 50-period guidance was mixed in this window. On NQ, 2.1 deviations moved containment from 85.7% toward the default, as the rule predicts, while on ES the 50-period bands at 2.0 already contained 90.1%. One year on two correlated markets is a small sample, so treat this as a reason to check containment on your own market rather than a verdict on the rule.
Choosing Bollinger Bands Settings for Your Timeframe
The 20 in Bollinger Bands means 20 bars, so its length in time depends on your chart. On a daily chart it covers about a month of sessions. On a 5-minute chart it covers 100 minutes. A shorter period reacts faster and gets tagged more often; a longer one describes a slower trend and gets tagged less.
A practical way to pick settings is to decide what the middle band should describe first. If it should track the trend you actually trade, choose the period that matches your holding time, then adjust the multiplier so roughly 90% of closes stay inside. Changing the multiplier by small steps matters more than most traders expect.
Percent B and Bandwidth Readings
Bollinger built two readings on top of the bands, and they turn a visual tool into numbers you can journal and test.
- %b = (close - lower band) / (upper band - lower band). A reading of 1 means price is at the upper band, 0 means the lower band, 0.5 means the middle. Above 1 or below 0 means the close is outside the bands.
- BandWidth = (upper band - lower band) / middle band. It shows the band's width as a share of price, which lets you compare quiet and volatile periods. At the default settings, Bollinger notes it equals four times the coefficient of variation.
%b is what most traders actually mean when they say "price is stretched." A 0.95 reading after a strong rally and a 0.95 reading inside a sideways range look identical as numbers, which is why the middle band's slope has to come with it.
What Normal Bandwidth Looks Like on ES and NQ
BandWidth only means something against its own history. Here is the distribution over the same 252 sessions, in percent of the middle band.
| Market and setting | Lowest | 10th percentile | 25th percentile | Median | 75th percentile | 90th percentile | Highest |
|---|---|---|---|---|---|---|---|
| ES, 20 and 2 | 2.23 | 2.67 | 3.29 | 4.38 | 5.88 | 7.51 | 15.10 |
| NQ, 20 and 2 | 2.66 | 3.69 | 5.25 | 7.60 | 9.81 | 12.53 | 20.44 |
| ES, 50 and 2.1 | 3.30 | 4.20 | 5.22 | 6.26 | 8.30 | 15.38 | 21.10 |
| NQ, 50 and 2.1 | 5.49 | 7.05 | 7.80 | 9.74 | 11.84 | 25.04 | 34.38 |
NQ's typical band was about 1.7 times as wide as ES's, with a median of 7.60% against 4.38%. A fixed threshold therefore means different things on different markets. StockCharts' sample squeeze scan treats BandWidth under 4% of price as narrow. On ES that line sits just under the median, so it fires often. On NQ it sits between the 10th and 25th percentiles, so it fires rarely. Ranking today's reading against the market's own year avoids that problem. As of November 4, 2026, ES BandWidth was 4.18%, about the 46th percentile of its year, while NQ was 11.56%, about the 88th.
How to Read Bollinger Bands Tags, Walks and Breakouts
Reading Bollinger Bands well comes down to separating what the bands describe from what you want them to predict. Four behaviors cover most of it.
- Tags. Bollinger's rule 6 says a tag of the upper band is not, by itself, a sell signal, and a tag of the lower band is not, by itself, a buy signal.
- Walking the bands. In a strong trend, price can ride along the upper or lower band for many sessions (rule 7). Each touch is a sign of trend strength, not exhaustion.
- Closes outside the bands. Rule 8 says these are initially continuation signals, not reversal signals.
- Expansion and contraction. Wide bands mean the market has been volatile; narrow bands mean it has been quiet. Neither says which way the next move goes.
The overbought and oversold reading most traders start with is the one Bollinger warns against. "Price is high relative to the last 20 bars" and "price is about to fall" are different statements. The first is an observation. The second needs confirmation from something else, such as a failed retest, a volume divergence or a break of structure. Until that confirmation shows up, the correct trade is often no trade.
Do Closes Outside the Bollinger Bands Continue or Reverse
To check rule 8, this guide measured what ES and NQ did over the next 10 sessions after every daily close outside the default bands. The test ran from June 6, 2022 to October 21, 2026, 1,102 sessions that all have 10 later sessions to measure.
| Condition (this guide's ES and NQ futures calculation) | ES sessions | ES share higher 10 sessions later | ES average 10-session change | NQ sessions | NQ share higher 10 sessions later | NQ average 10-session change |
|---|---|---|---|---|---|---|
| Close above the upper band | 69 | 69.6% | +0.98% | 68 | 67.6% | +1.23% |
| Close below the lower band | 63 | 65.1% | +1.55% | 53 | 58.5% | +1.64% |
| Every session in the test | 1,102 | 61.9% | +0.66% | 1,102 | 60.6% | +0.89% |
In this guide's calculation on Yahoo Finance ES and NQ futures data, closes above the upper band leaned toward continuation, not reversal. On ES they were followed by a higher price 10 sessions later 69.6% of the time, against 61.9% for every session, with a larger average gain. Anyone who shorted each of those closes was standing in front of the trend more often than not.
Closes below the lower Bollinger Band are the messier half of the same study. In this guide's ES and NQ data they were followed by an average bounce on both markets, larger than the overall average, which reads more like a short-term reversal than the continuation Bollinger's rule 8 describes. Two cautions apply. ES rose about 89.3% and NQ about 138.1% across the test, so a rising market flatters anything bullish, and many observations overlap because band closes come in clusters. The honest takeaway is that neither band close was a reliable fade in this sample, and the upper band close was the closest thing to a continuation signal.
The Bollinger Band Squeeze, Measured on ES and NQ
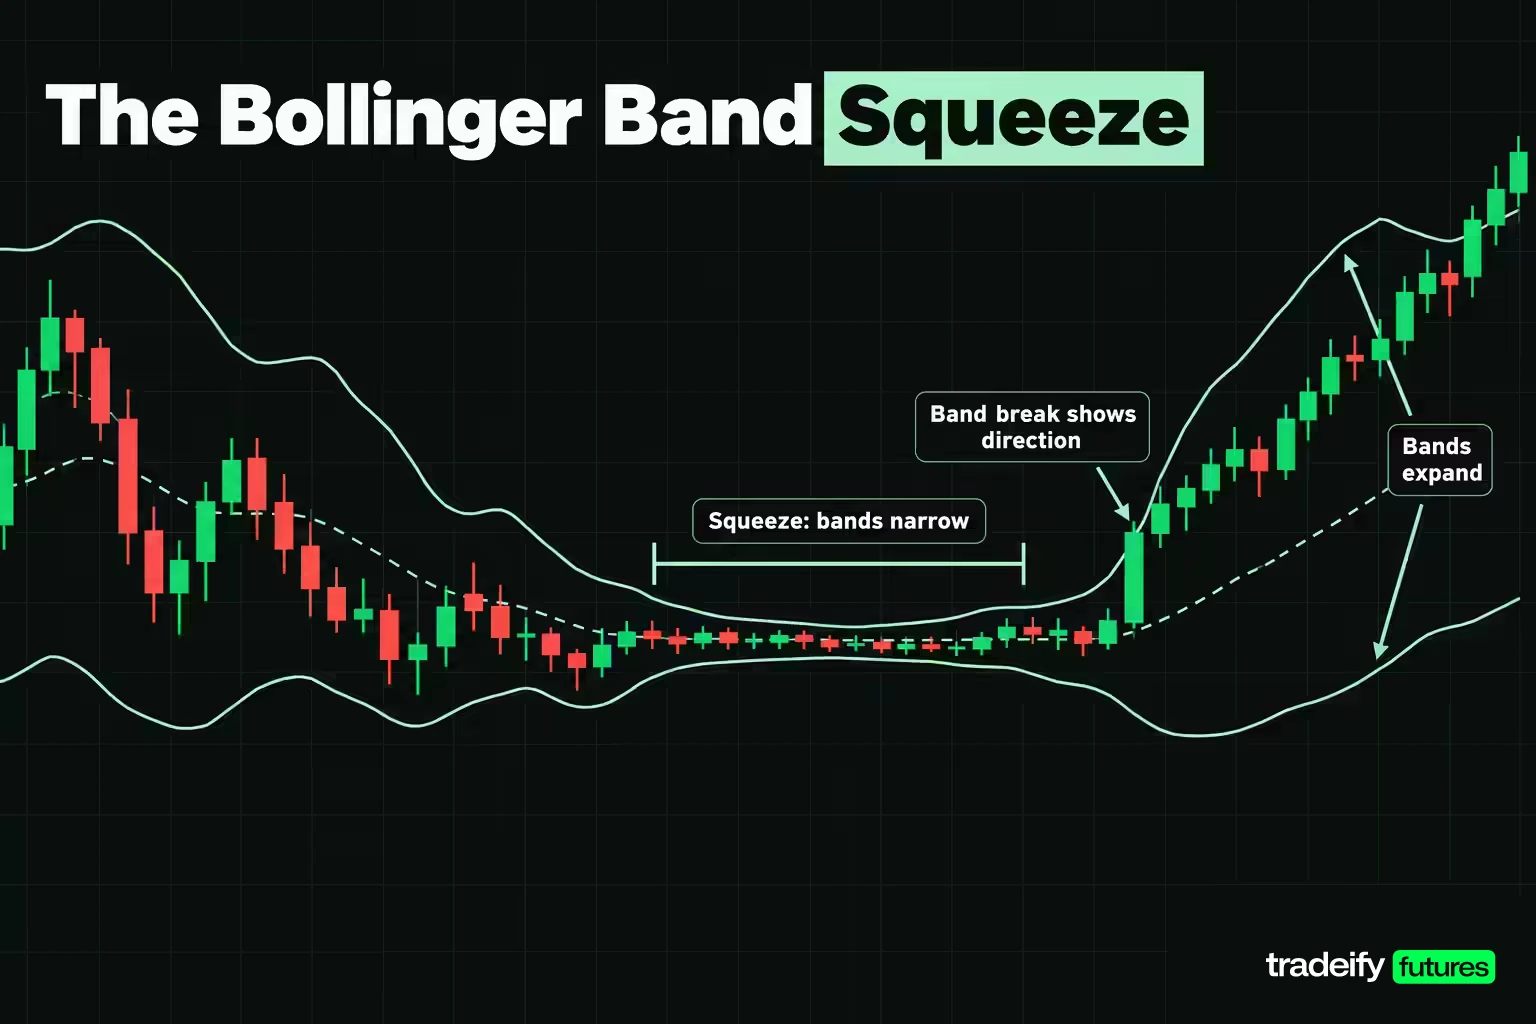
The Bollinger Band squeeze is a period when the bands narrow because volatility has dropped. Bollinger's view is that low volatility tends to be followed by high volatility, so a squeeze can come before a large move. StockCharts' write-up of the strategy looks for BandWidth near the low end of its six-month range, then waits for a band break to show direction, and it adds that the narrowing itself gives no directional clue.
That gives three testable claims. After a squeeze, the bands should widen more often than usual. The next move should be bigger than usual. And the first band break should point the right way.
How the Bollinger Band Squeeze Test Was Run
The squeeze test used ES and NQ daily closes from Yahoo Finance's continuous front-month series, five years of bars ending November 4, 2026, with bands at 20 and 2.
- Squeeze definition. A session counts as a squeeze when its BandWidth is the lowest of the last 125 sessions, about six months. Consecutive squeeze sessions form one episode, and each episode is measured from its last session.
- No look-ahead. Each session is judged only on readings available that day.
- Test window. June 6, 2022 to October 21, 2026, the sessions with a full six-month lookback and 10 later sessions to measure.
- Comparison. Every non-squeeze session in the same window, measured the same way.
- Measures. Whether BandWidth was wider 10 sessions later, the size of the 10-session price move regardless of direction, and whether the first close outside the bands within 20 sessions was followed by more movement the same way.
What Followed Each Bollinger Band Squeeze
| Measure (this guide's ES and NQ squeeze test) | ES squeeze episodes | ES other sessions | NQ squeeze episodes | NQ other sessions |
|---|---|---|---|---|
| Number measured | 9 | 1,082 | 12 | 1,074 |
| Bands wider 10 sessions later | 100% | 48.8% | 83.3% | 46.8% |
| Average BandWidth change over 10 sessions | +110.7% | +8.6% | +106.9% | +9.2% |
| Average 10-session move, either direction | 3.02% | 2.28% | 3.51% | 3.18% |
| Median 10-session move, either direction | 2.96% | 1.90% | 3.70% | 2.73% |
| Share of 10-session moves larger than 2% | 66.7% | 47.5% | 66.7% | 61.4% |
Here are the nine ES episodes, so you can see the spread behind the average.
| Episode start | Episode end | Sessions in squeeze | BandWidth at end | BandWidth 10 sessions later | 10-session move |
|---|---|---|---|---|---|
| 2022-07-19 | 2022-07-19 | 1 | 5.11 | 10.47 | 3.97% |
| 2022-12-08 | 2022-12-08 | 1 | 4.43 | 7.49 | 2.94% |
| 2023-04-25 | 2023-04-28 | 4 | 2.77 | 3.16 | 1.21% |
| 2023-12-11 | 2023-12-11 | 1 | 2.50 | 8.31 | 4.30% |
| 2024-06-11 | 2024-06-11 | 1 | 2.60 | 6.47 | 2.96% |
| 2025-02-12 | 2025-02-18 | 4 | 2.28 | 6.72 | 5.81% |
| 2025-09-03 | 2025-09-09 | 5 | 2.13 | 5.22 | 2.96% |
| 2026-08-28 | 2026-08-31 | 2 | 2.23 | 2.29 | 1.43% |
| 2026-09-14 | 2026-09-14 | 1 | 2.23 | 4.09 | 1.60% |
The first squeeze claim, that bands widen afterward, held up well in this guide's ES and NQ test. Squeezes were followed by wider bands far more often than ordinary sessions, and the average BandWidth more than doubled. Part of that is built in, since a six-month low in volatility has little room to fall further, but it still means a squeeze is a fair warning that quiet conditions are unlikely to last.
The second squeeze claim, that the next move is bigger than usual, held up more weakly in the same test. On ES the median move after a squeeze was 2.96% against 1.90%, a real difference. On NQ the gap was smaller, and the share of moves over 2% was close to normal. Two of the nine ES episodes, in April 2023 and August 2026, were followed by moves under 1.5%.
Bollinger Band Squeeze Direction and Head Fakes
Direction is where the Bollinger Band squeeze gives the least help. After each squeeze episode in this guide's ES and NQ daily test (squeeze defined as a six-month BandWidth low), the calculation took the first close outside the bands within 20 sessions and checked whether price kept going that way over the next 10 sessions. On ES, 6 of 9 breaks followed through, split 4 up and 5 down. On NQ, 7 of 12 followed through. That is better than a coin flip, but 3 of 9 ES breaks and 5 of 12 NQ breaks went the wrong way. That is the "head fake" squeeze traders complain about, and it tends to catch the trader who entered on the first close outside the band because waiting felt like missing the move.
A looser definition makes the results noisier. Counting any BandWidth at or below the 20th percentile of the prior 125 readings produced 38 ES episodes and 30 NQ episodes. Widening stayed common, at 88.9% on ES and 93.3% on NQ. But the move size advantage faded: on NQ the median move after these episodes was 1.95% against 2.65% for other sessions. The stricter the squeeze, the more it meant.
With 9 and 12 episodes, these are small samples on two correlated markets, and daily bars only. The practical reading is that a squeeze tells you to expect a change in volatility and to plan for it: smaller size until the break, a stop that accounts for wider bands, and a confirmation rule for direction. It does not tell you to buy or sell before price shows its hand.
W-Bottoms and M-Tops With Bollinger Bands
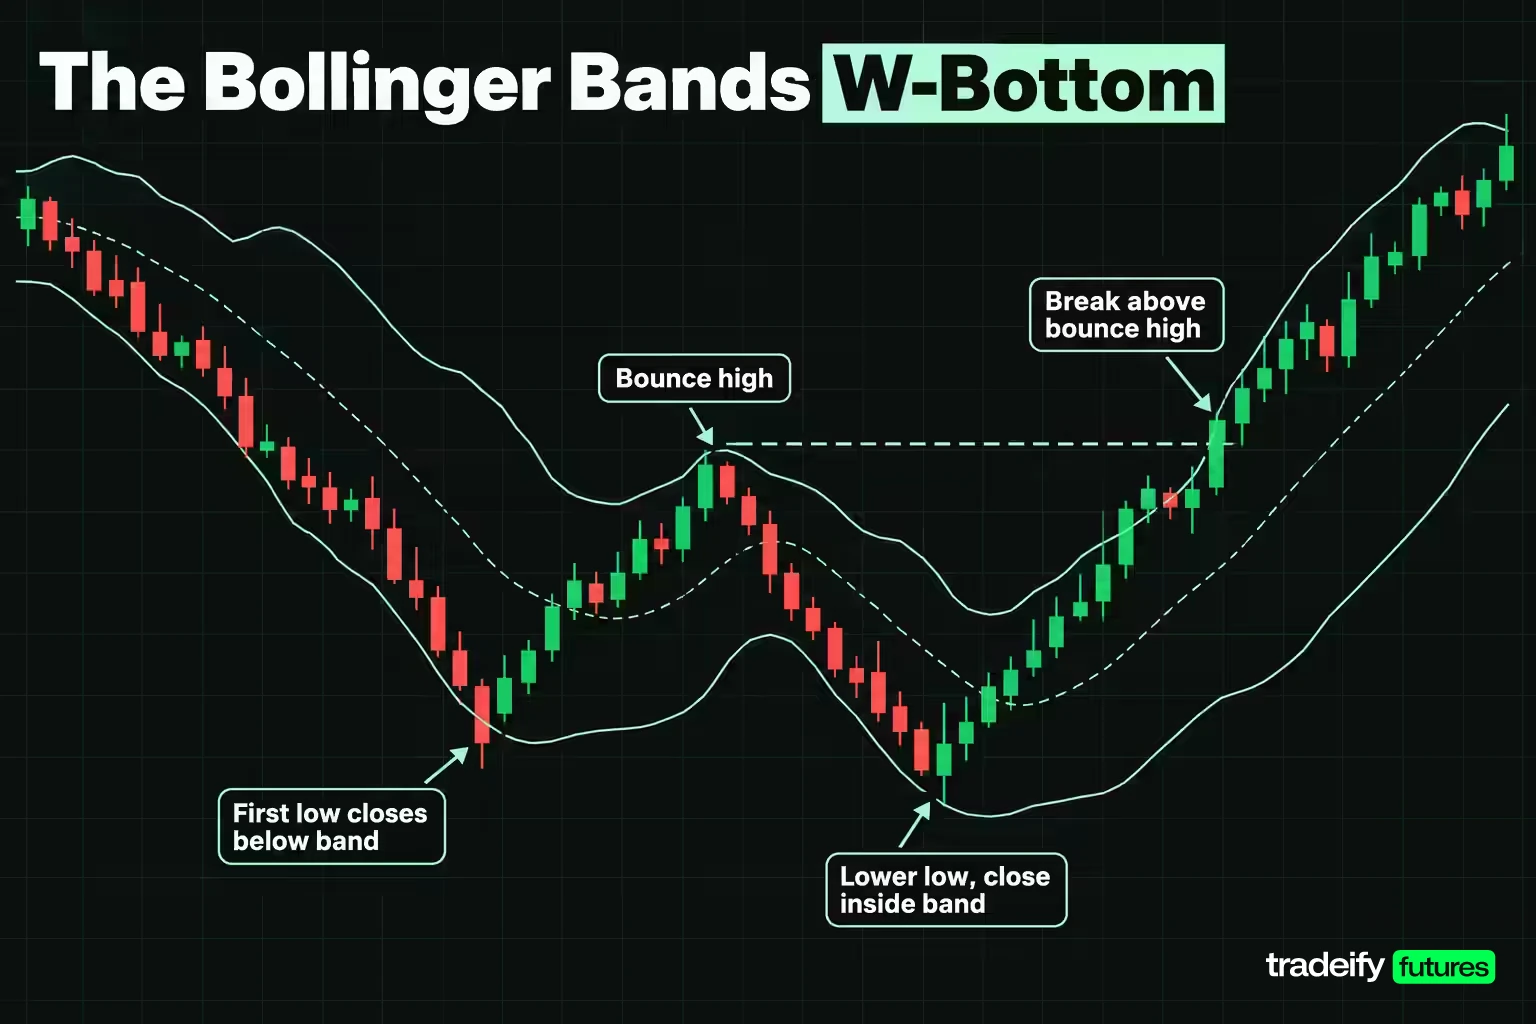
Bollinger Bands help define two price patterns from Arthur Merrill's work, which catalogued 16 patterns with a basic W shape and 16 with an M shape. Bollinger's rule 5 says the bands can clarify pure price patterns like these. The value of the bands here is that they give "weaker second low" a precise meaning.
The Bollinger Bands W-Bottom in Four Steps
A W-bottom forms in a downtrend with two reaction lows.
- A first reaction low forms, usually below the lower band, though not always.
- Price bounces back toward the middle band.
- Price makes a new low, but this time the close holds above the lower band. Price fell further, yet it was less stretched relative to its own volatility, which shows less selling pressure.
- A strong move off the second low breaks the resistance created by the bounce in step 2, confirming the pattern.
The pattern is judged on closes, since the bands are calculated from closes. An intraday spike below the lower band on the second low does not break the pattern if the close holds above it. The setup is invalidated if the second low closes below the lower band, or if the breakout in step 4 fails back under the step 2 high.
The Bollinger Bands M-Top Non-Confirmation
M-tops are the mirror image, though Bollinger notes that tops are usually more drawn out and complicated than bottoms. The classic warning sign is a non-confirmation.
- Price makes a reaction high above the upper band.
- Price pulls back toward the middle band.
- Price pushes to a higher high, but fails to close above the upper band.
The new price high on fading relative strength is the warning. Final confirmation comes from a support break or a bearish signal from a separate indicator. Until then, it is only a warning, and a strong market can turn the "failed" second high into the start of another walk up the band.
Bollinger Bands Trading Strategies
Bollinger Bands trading strategies work best when they are written as rules before the market opens, because the bands make it easy to rationalize any trade after the fact. Bollinger's rule 22 frames the bands as a way to identify setups where the odds may be in your favor, not as continuous advice. Here are three common approaches, written as context, trigger, confirmation and invalidation. They are illustrations of structure, not recommendations.
Bollinger Bands Mean Reversion Inside a Range
- Context. The middle band is flat and price has been rotating between the bands. This strategy only applies here.
- Trigger. A tag of the lower band for a long, or the upper band for a short.
- Confirmation. A reversal close back inside the band, ideally with a separate indicator, such as volume, not confirming the extreme.
- Target and invalidation. The middle band is the natural first target. A close beyond the band followed by another close further out invalidates the range idea, because the market may be starting to walk the band.
The trap is applying this in a trend. The measured results show why: closes above the upper band were followed by higher prices more often than an average session, so fading them blindly meant trading against the more common outcome.
Trend Continuation by Walking the Band
- Context. The middle band slopes clearly in one direction and price has closed outside the band in that direction.
- Trigger. A pullback toward the middle band that holds, then a close back in the trend direction.
- Confirmation. The pullback holds above the middle band in an uptrend, or below it in a downtrend.
- Invalidation. A close through the middle band against the trend, or a close beyond the opposite band.
This approach accepts that you will rarely buy the low. It trades the walk Bollinger describes instead of fighting it, and it asks for patience on the pullback rather than chasing the close that is already outside the band.
Squeeze Breakout With Confirmation
- Context. BandWidth is at a six-month low on the market and timeframe you trade.
- Trigger. The first close outside the bands after the squeeze.
- Confirmation. A break of the range's support or resistance in the same direction, since StockCharts notes that unconfirmed band breaks are prone to failure.
- Invalidation. A close back inside the bands and through the middle band. In the squeeze test, 8 of 21 first breaks across ES and NQ failed this way.
Each of these needs a stop placed where the idea is wrong on price, and a position size set from that distance. That is where the band width itself becomes useful.
Related lesson: Mean reversion trading
Sizing Stops From the Bollinger Band Width
The Bollinger Band width already tells you how much the market has been moving, so it is a natural input for stop distance. A fixed 20-point stop is generous inside a squeeze and sits inside the normal noise during an expansion. A stop sized from the current standard deviation keeps the same meaning in both.
The table below uses the November 4, 2026 values from the ES and NQ daily calculation, a standard deviation of 80.95 ES points and 857.90 NQ points, and prices them on the Micro E-mini contracts. The Micro E-mini S&P 500 (MES) is $5 per index point, and the Micro E-mini Nasdaq-100 (MNQ) is $2 per index point, per CME Group's contract specifications. The $500 risk budget is illustrative.
| Stop distance | ES points | Risk per MES | MES within $500 | NQ points | Risk per MNQ | MNQ within $500 |
|---|---|---|---|---|---|---|
| Half a standard deviation | 40.48 | $202.40 | 2 | 428.95 | $857.90 | 0 |
| One standard deviation | 80.95 | $404.75 | 1 | 857.90 | $1,715.80 | 0 |
| Two standard deviations, middle to outer band | 161.90 | $809.50 | 0 | 1,715.80 | $3,431.60 | 0 |
What Band-Based Stops Mean for Contract Size
Two things stand out in the Bollinger Band stop table. Stops built from daily bands are wide, even on micro contracts: one daily standard deviation on NQ was $1,715.80 per MNQ, far beyond a $500 budget. If a band-based stop does not fit your risk budget, the answer is to trade fewer contracts, use bands on a timeframe that matches your holding period, or skip the trade. Shrinking the stop until it fits your budget puts it back inside the noise.
Break-Even Win Rates for Bollinger Band Targets
With a Bollinger Band stop, the target matters as much as the stop. Before costs, a trade that targets twice its risk breaks even at a 33.3% win rate, one that targets its risk breaks even at 50.0%, and one that targets four times its risk at 20.0%. A range trade entered at the lower band and aimed at the middle band has a target two standard deviations away, so a stop two deviations away makes it a 1 to 1 trade that needs to win more than half the time. Commissions and slippage raise every one of those break-even rates.
Related lesson: Volatility based position sizing
Combining Bollinger Bands With RSI, MACD and Volume Indicators
Combining Bollinger Bands with other indicators works when the second tool measures something the bands do not. Bollinger's rule 3 lists suitable inputs as momentum, volume, sentiment, open interest and inter-market data. Rule 4 sets the limit: indicators used together should not be directly related, because two momentum indicators are not better than one.
That rule is why RSI, MACD and Stochastic all add less to Bollinger Bands than they appear to. All three are built from the same closing prices as the bands, so when price is at the upper band, they tend to be high as well. Agreement between them is often the same information counted twice.
Volume-based tools are a better fit. Bollinger's own early approach compared tags of the band with David Bostian's Intraday Intensity, a volume indicator, treating a tag that the volume tool did not confirm as a setup. StockCharts' squeeze guide makes the same point for narrow bands: momentum oscillators and moving averages flatten during a consolidation, so volume tools such as the Accumulation Distribution Line, Chaikin Money Flow, Money Flow Index or On Balance Volume are more likely to show buying or selling pressure before the break.
Momentum oscillators still have a job once the trend is known. StockCharts' examples pair a band breakout with a 10-period Commodity Channel Index to time pullbacks inside the new trend. In that role, the bands define the trend and the oscillator only times the entry.
Related lesson: Relative strength index RSI
Bollinger Bands vs Keltner Channels
Bollinger Bands and Keltner Channels look alike on a chart but measure volatility differently.
| Feature | Bollinger Bands | Keltner Channels |
|---|---|---|
| Center line | 20-period simple moving average | 20-period exponential moving average |
| Width input | standard deviation of closes | Average True Range, which includes gaps and intrabar range |
| Common default | 2 standard deviations | 2 times a 10-period ATR in StockCharts' default |
| Reaction to one large bar | widens sharply, then narrows sharply 20 bars later | widens and narrows more gradually |
| Typical use | relative high and low, squeezes, W and M patterns | trend direction from channel slope, channel breakouts |
The modern Keltner version comes from Linda Bradford Raschke's work in the 1980s, which updated Chester Keltner's 1960 "Ten-Day Moving Average Trading Rule" by using ATR for width. Because standard deviation reacts more to sharp closes than ATR does, Bollinger Bands tend to swell faster after a shock and contract faster in quiet periods. Some traders use that difference directly and treat Bollinger Bands moving inside a Keltner Channel as their squeeze condition.
Related lesson: Keltner Channels
Setting Up Bollinger Bands on a Charting Platform
Setting up Bollinger Bands takes a minute on most platforms, but the inputs are worth checking, because a wrong default is the most common reason your bands do not match someone else's.
Bollinger Bands Inputs on TradingView and NinjaTrader
On TradingView, the built-in Bollinger Bands indicator has these inputs:
- Length, the period for the middle band, 20 by default.
- Basis MA Type, which lets you change the middle band's moving average.
- Source, the price used, close by default.
- StdDev, the multiplier, 2 by default.
- Offset, which shifts the bands forward or back, 0 by default.
TradingView also has a timeframe input that calculates the bands on a different timeframe from the chart, for example hourly bands shown on a 5-minute chart.
On NinjaTrader 8, the built-in Bollinger indicator takes two parameters, NumStdDev and Period. Its system source code sets Period to 14, not 20, so check this setting before comparing it with a chart that uses 20.
Bollinger Bands Setup Checklist
A quick Bollinger Bands setup checklist for any platform:
- Set the period and multiplier on purpose, and write them down with the timeframe.
- Confirm the middle band is a simple moving average, unless you have deliberately chosen an exponential version for both lines.
- Confirm the price source is the close.
- Leave the offset at 0.
- Check the last closed bar against a hand or spreadsheet calculation once, using the population standard deviation.
On our accounts, you chart through the platforms we support, including Tradovate, TradingView through the Tradovate connection, NinjaTrader, WealthCharts, Quantower, Sierra Chart and R Trader Pro, so check the Bollinger Bands inputs on whichever one you use. All positions must be closed by 4:45 PM ET, with no overnight or swing holds, so a daily band setup that needs several sessions to play out cannot be held on our accounts; daily bands serve as context for intraday entries. Our evaluation and funded accounts are simulated.
Using Bollinger Bands on Futures, Forex, Stocks and Crypto
Bollinger Bands work on most financial time series, including stocks, indices, currencies, commodities, futures, options and bonds, according to Bollinger's rule 20. Rule 21 adds that they work on bars of any length, as long as each bar holds enough activity to give a reliable reading.
The settings travel better than the thresholds. The same 20 and 2 contained about 90% of closes on both ES and NQ, but NQ's median BandWidth of 7.60% was far wider than ES's 4.38%. Expect the same pattern across markets: a quiet reading on a crypto chart could be a violent one on a Treasury chart. Very thin markets, overnight sessions with little volume, and bars that span a gap need extra care, since a single print can widen the bands.
Bollinger Bands Limitations and Common Mistakes
Bollinger Bands have clear limits, and most losses blamed on the indicator come from a handful of repeat mistakes.
- Reading the bands as probabilities. Bollinger's rule 14 says to make no statistical assumptions from the standard deviation, because prices are not normally distributed and 20 bars is too small a sample for significance.
- Fading every tag. A tag describes where price is. In the ES test, closes above the upper band were followed by higher prices more often than average.
- Trusting a squeeze for direction. The squeeze warned of wider bands well, but 8 of 21 first band breaks after a squeeze on ES and NQ went the wrong way.
- Copying thresholds between markets. A BandWidth level that is tight on ES can be wide on NQ.
- Ignoring the settings behind a screenshot. Period, multiplier, average type and standard deviation convention all change where the bands sit.
- Stacking related indicators. RSI or MACD agreeing with the bands is often the same closes counted twice.
- Judging a rule on a short sample. Nine squeeze episodes or a few dozen band closes cannot prove a strategy, especially in a market that rose for most of the period.
The fix is the same each time: write the rule down, measure it on your market and timeframe with a baseline, and size the position from the stop the rule needs.
Related lesson: Standard deviation indicator
Bollinger Bands FAQ
What does a Bollinger Band of 20 and 2 mean?
It means the middle band is a 20-period simple moving average and the outer bands sit two standard deviations of the same 20 closes above and below it. These are Bollinger's defaults. On the ES and NQ daily data in this guide, they contained about 90% of closes over the latest year.
What is the middle line of Bollinger Bands?
The middle line is a simple moving average of closes, 20 periods by default. It is the base for both outer bands and is meant to describe the intermediate-term trend. In range strategies it often works as the first profit target.
What is the 3-5-7 rule in trading?
The 3-5-7 rule says to risk no more than 3% of the account on one trade, keep combined risk across open positions under 5%, and aim for winners at least 7% larger than losers. It is an informal risk guideline, not an official standard. Versions of the third number vary, and many traders use smaller per-trade risk.
What are the top 5 technical analysis indicators?
Moving averages, the Relative Strength Index, MACD, Bollinger Bands and a volume measure such as On Balance Volume appear on most beginner lists of top indicators. There is no official ranking. A better test than popularity is whether each indicator measures something different, since several of them are built from the same closes.
Does the Bollinger Band squeeze work?
In this guide's test on four years of ES and NQ daily bars from Yahoo Finance, squeezes defined as six-month BandWidth lows were followed by wider bands far more often than other sessions. The move size advantage was clear on ES and smaller on NQ. Direction was the weak point, with 8 of 21 first band breaks going the wrong way.
Why do my Bollinger Bands look different from someone else's?
Check the period, the multiplier, the moving average type, the price source and the standard deviation convention. The sample version of the standard deviation makes 20-period bands about 2.6% wider than the population version Bollinger uses. Some platforms also use a default period other than 20.
What is the best timeframe for Bollinger Bands?
The best timeframe is the one that matches how long you hold a trade. A 20-bar band on a 5-minute chart describes the last 100 minutes, while a daily band describes about a month. Many traders read a higher-timeframe band for context and a lower one for entries.
Bollinger Bands Trading Risk
This Bollinger Bands guide is for education only and is not investment advice or a recommendation to trade any instrument. The ES and NQ figures describe what two related markets did over one historical period, on daily bars, without trading costs or slippage, and they do not predict future results. Futures trading uses leverage, and losses can be larger than you expect from a single trade. Evaluation and funded prop accounts are simulated, and results there may differ from live markets.


