



TL;DR: Volatility based position sizing keeps dollar risk level by letting the contract count shrink as ATR stops widen. On 227 ES and NQ breakout trades, a 1.0 ATR stop cost $521.25 to $9,510.63 on one ES contract. A 1% budget on $50,000 funded no ES trade with whole minis, but 108 of 117 with micros. Size from the stop and the budget, round down, and log the trades the math refuses to fund.
Volatility based position sizing starts from an uncomfortable fact. The same stop rule costs wildly different amounts of money from one trade to the next. A one-ATR stop on the E-mini S&P 500 can be a few hundred dollars per contract in a quiet tape and several thousand in a fast one. If your contract count never changes, your risk is whatever the market happens to hand you that day.
This guide covers the formula, how ATR feeds it, how it compares with static sizing and other methods, and what happened when one volatility rule was applied unchanged to 20 years of ES and NQ daily bars. The study is there to show the arithmetic under real conditions, not to sell a strategy.
Position Sizing Basics Behind Any Volatility Rule
Position sizing is the decision about how many contracts, shares or lots to trade so that a loss at your stop costs a dollar amount you chose in advance. It is not the same as buying power. Buying power tells you the most you are allowed to open. Position sizing tells you how much you can afford to lose on this trade.
Every sizing method has two halves, and it helps to keep them apart.
- The stop half decides where the trade is wrong. Its output is a distance in points.
- The size half turns that distance into a contract count. Its output is a whole number, because you cannot trade 0.34 of a futures contract.
The bridge between the halves is the contract's point value. The E-mini S&P 500 (ES) pays $50 per index point and the Micro E-mini S&P 500 (MES) pays $5, so a 10-point stop is $500 on one ES and $50 on one MES. Same chart, same stop, ten times the dollars.
Most sizing mistakes happen when a trader fixes one half and lets the other float without noticing. It rarely feels like a decision in the moment, which is exactly the problem. Fix the contract count and the dollar risk floats with the stop. Fix the dollar risk and the contract count has to float instead. Volatility based sizing is a deliberate choice of the second option.
Related lesson: Position sizing
How Volatility Based Position Sizing Works
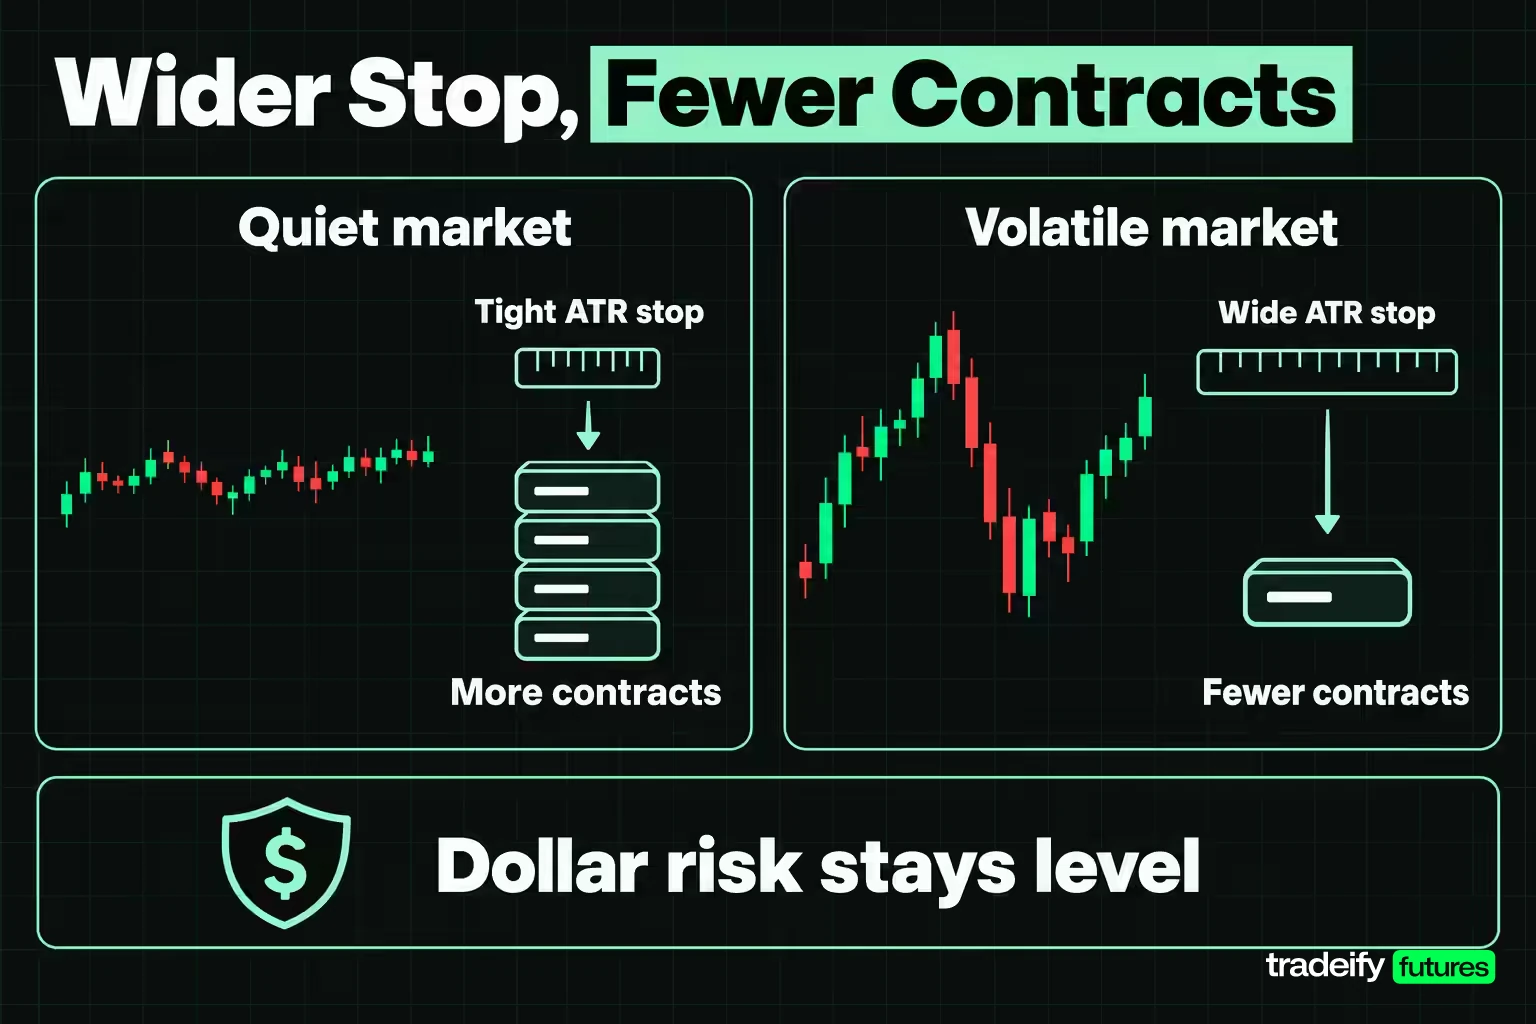
Volatility based position sizing sets the stop distance from a volatility measure, then divides a fixed dollar budget by that distance to get the contract count. When the market gets wilder, the stop widens and the size shrinks. When the market goes quiet, the stop tightens and the size grows. The planned dollar loss stays roughly level.
The best-known version is the percent volatility model that Van K. Tharp described in Trade Your Way to Financial Freedom. Thomas Bulkowski reproduces it on his ThePatternSite position sizing page as:
- Position size = (current equity x percent of equity to risk) / volatility
- His volatility input is the 10-day exponential average of the true range.
- His worked stock example: $100,000 x 2% / $1.25 = 1,600 shares.
In futures the same idea has to pass through the contract multiplier before it becomes a contract count, which is where most of the practical trouble lives.
What volatility sizing does and does not do
Volatility based position sizing does standardise the loss you take when a stop is hit. It also stops a quiet market from quietly authorising an oversized position just because the stop looks small in points.
Volatility sizing does not make a loss less likely. It does not add edge to a rule that has none. It does not cap a loss when price gaps through the stop. And it cannot produce a fractional contract, so on small budgets it often produces nothing at all.
That last point sounds like a footnote. On a $50,000 account trading ES with a 1% budget, whole-contract rounding decides almost everything, because a typical one-ATR stop on one ES costs more than the whole $500 budget.
ATR as the Volatility Input for Position Sizing
Average True Range (ATR) is the most common volatility input for position sizing because it measures volatility in price points, which converts straight into dollars. J. Welles Wilder introduced it in his 1978 book New Concepts in Technical Trading Systems, designing it with commodities and daily prices in mind.
ATR averages the true range, which StockCharts' ChartSchool defines as the greatest of three values:
- Current high minus current low.
- Current high minus the previous close, as an absolute value.
- Current low minus the previous close, as an absolute value.
The second and third methods catch gaps. A day that opens far from yesterday's close and then trades a narrow range still shows a large true range, which is the volatility a stop actually has to survive.
ATR length and smoothing choices
ChartSchool notes that ATR is typically based on 14 periods, and that Wilder smoothed each new value with the previous ATR rather than taking a plain average. Many traders use a simple average instead, and many use 20 sessions to match roughly a month of trading. Neither choice is wrong. What matters is that you pick one and do not change it mid-sequence.
Three decisions sit inside "use ATR":
- Length. Short lengths react fast and whipsaw the size. Long lengths react slowly and can leave you oversized after volatility jumps.
- Timing. Use the ATR known before the entry. Including the signal bar itself mixes the decision with information you did not have when you placed the order.
- Multiple. The stop is a multiple of ATR. The multiple sets how much noise the trade can absorb, and it quietly changes how many trades your budget can fund.
Reading ATR as a dollar figure
ATR only becomes a sizing input once you turn it into dollars per contract. In this guide's own 20-year study of Yahoo Finance ES daily bars, ATR(20) ranged from 10.425 to 190.2125 ES points at the moments the breakout rule entered.
- At an ATR of 28.9875 points, a 1.0 ATR stop costs $1,449.38 on one ES and $144.94 on one MES. A $500 budget buys 3 MES.
- At an ATR of 190.2125 points, the same stop costs $9,510.63 on one ES and $951.06 on one MES. The same $500 budget buys nothing.
That is the ATR doing its job. The wider the market's range, the fewer contracts the same dollar budget can carry, down to zero.
Daily ATR versus intraday ATR
A daily ATR describes how far price travels in a full session. An intraday trader who stops out within hours needs an ATR on the timeframe the stop lives on, such as a 5-minute or 15-minute chart. The sizing arithmetic is identical. Only the input changes, and an intraday ATR will usually be a much smaller number of points.
Related lesson: Average True Range
The Volatility Position Sizing Formula for Futures
The volatility position sizing formula for futures is short enough to run on a napkin, but each step has a trap.
- Read the ATR known before entry.
- Multiply it by your stop multiple to get the stop distance in points.
- Multiply the distance by the contract's point value to get dollar risk per contract.
- Add the round-turn cost per contract (commission plus expected slippage).
- Divide your dollar budget by that risk per contract.
- Round down to a whole contract. If the answer is zero, the trade is unfunded.
Point values for the four equity index contracts used in this guide come from the CME contract specifications:
| Contract | Dollars per index point | Minimum tick | Tick value |
|---|---|---|---|
| E-mini S&P 500 (ES) | $50 | 0.25 | $12.50 |
| Micro E-mini S&P 500 (MES) | $5 | 0.25 | $1.25 |
| E-mini Nasdaq-100 (NQ) | $20 | 0.25 | $5 |
| Micro E-mini Nasdaq-100 (MNQ) | $2 | 0.25 | $0.50 |
Worked volatility sizing example on ES
Take an ATR reading of 28.9875 ES points and a 1.0 ATR stop. That is a 28.9875-point stop.
- One ES: 28.9875 x $50 = $1,449.38 of risk.
- One MES: 28.9875 x $5 = $144.94 of risk.
- Budget: 1% of a $50,000 account = $500.
- Whole ES contracts: $500 / $1,449.38 = 0.34, which rounds down to zero. The trade is unfunded in minis.
- Micro contracts: $500 / $144.94 = 3.45, which rounds down to 3 MES, committing $434.82.
Now add costs. If you assume two ticks of slippage plus $1 commission per micro round turn, each MES carries $3.50 of cost, so risk per contract is $148.44. The budget still buys 3 micros, but on tighter stops the cost line is what pushes a 4-contract answer down to 3. Put costs inside the risk per contract, not after the fact, or the rounded size will sit over budget on every trade.
Hidden choices in the volatility sizing formula
The volatility sizing formula hides two choices. The first is the ATR length and multiple. The second is what "round down" means when the answer is 0.34 on one contract and 3.45 on its micro sibling. The formula treats both as details. In practice they decide whether your sizing rule trades at all.
Related lesson: Tick size and tick value
Static vs Dynamic Position Sizing
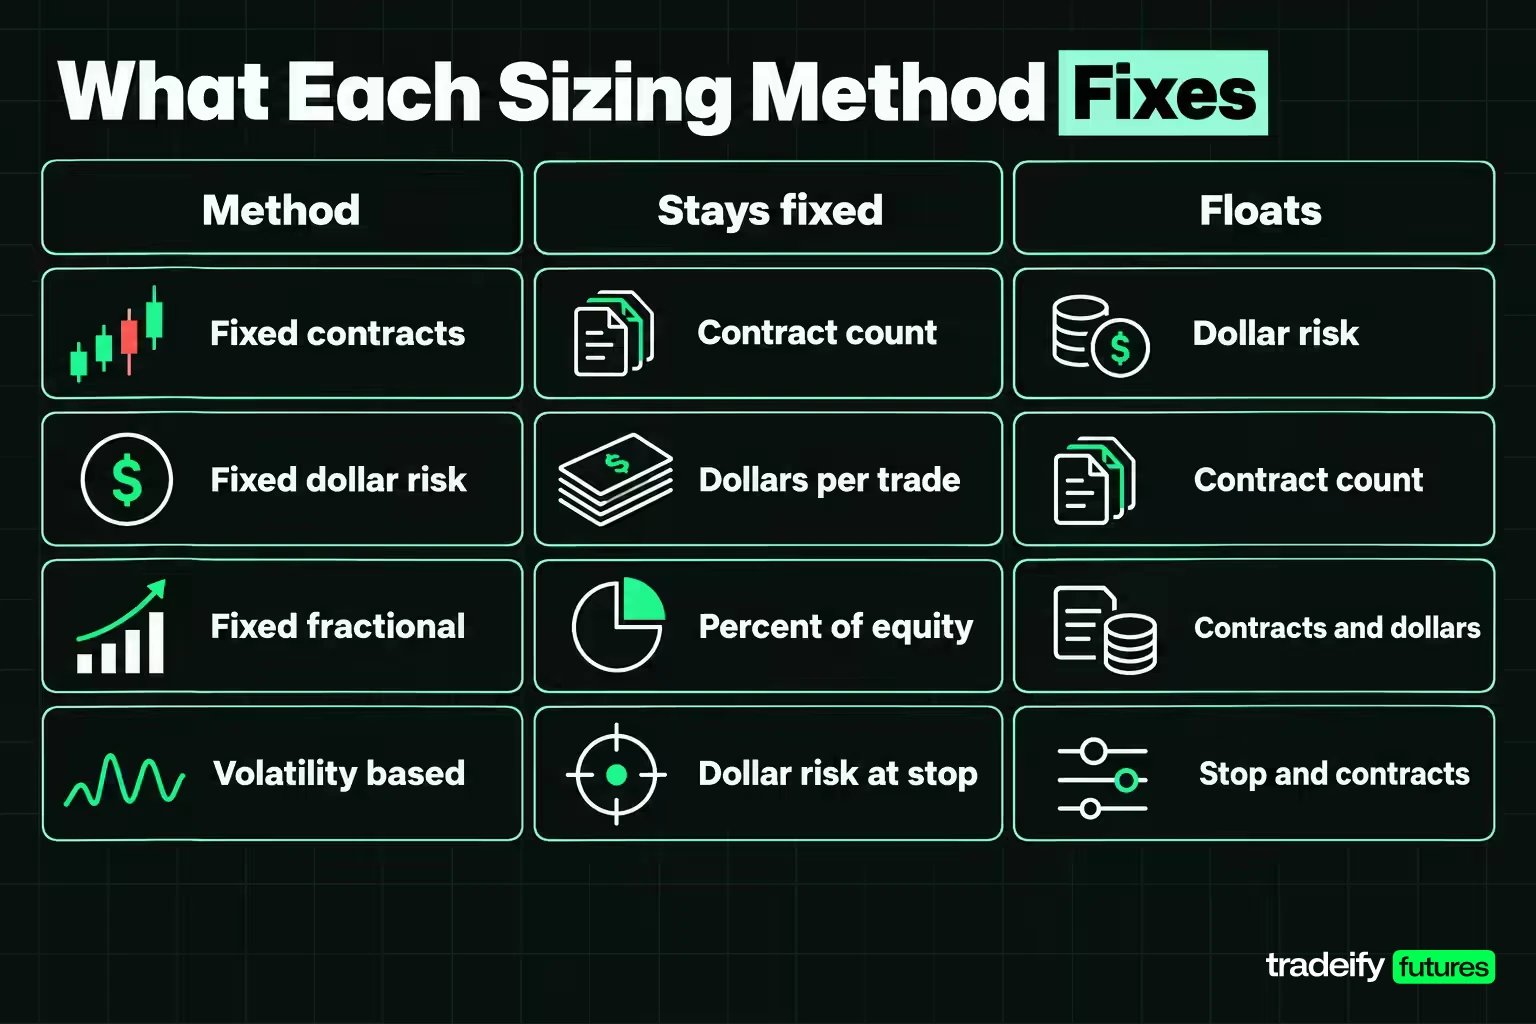
Static position sizing keeps something fixed regardless of market conditions. Dynamic position sizing lets size respond to equity, volatility or both. The useful question is not which is better, but what each one holds constant and what it lets float.
| Method | What stays fixed | What floats | Typical failure |
|---|---|---|---|
| Fixed contracts | Contract count | Dollar risk per trade | A wide-stop trade costs many times a normal one |
| Fixed dollar risk | Dollars risked per trade | Contract count | Ignores whether the account has grown or shrunk |
| Fixed fractional | Percent of equity risked | Contract count and dollars | Small accounts round to zero contracts |
| Volatility based | Dollar risk at a volatility stop | Stop distance and contract count | Wide-ATR trades round to zero, low-ATR trades hit size caps |
When static position sizing breaks
Static sizing feels safer because it is predictable in contracts. It is not predictable in dollars, and dollars are what leave the account.
In a 20-year test of a 55-session breakout rule on ES daily bars with a 1.0 ATR stop, trading exactly one ES contract on every signal from a $50,000 start drove the account below zero on trade 89 of 117. Nothing in that sequence needed an aggressive position. It needed a fixed contract count and stops that sometimes cost $9,510.63 on one contract.
The same one-contract rule on NQ survived the sequence and ended higher, but its worst peak-to-trough decline was 87.53%. Surviving with an 87.53% drawdown is not a sizing plan anyone would choose in advance.
When dynamic position sizing breaks
Dynamic position sizing breaks in the opposite direction. It asks for exact amounts the contract grid cannot deliver. On the same 20-year ES breakout sequence, a 1% budget with whole minis funded zero trades, because even the tightest stop in the sample cost more than $500 on one contract. A sizing rule that cannot be executed is not conservative. It is absent.
Related lesson: Fixed fractional position sizing
Twenty Years of ATR Stops on ES and NQ
To see how much an ATR stop actually moves in dollars, this guide's own study wrote down one breakout rule for ES and NQ futures and applied it without change to two decades of Yahoo Finance daily bars. The aim was to measure the volatility sizing arithmetic, not to find a profitable system.
Volatility sizing study method
- Data. Continuous front-month daily bars for ES and NQ from Yahoo Finance, September 2006 to September 2026, 5,032 usable sessions per product.
- Signal. A session close above the highest high, or below the lowest low, of the previous 55 sessions. Entry at that close.
- Volatility. ATR(20), the simple average of true range over the 20 sessions before the signal session, fixed at entry.
- Stop. A multiple of that ATR from entry. The main runs use 1.0 ATR.
- Exit. The stop, a close beyond the opposite 20-session channel, or 250 sessions, whichever comes first. A session that touches the stop counts as a stop even if it also closes beyond the exit channel.
- Positions. One position at a time per product.
At a 1.0 ATR stop, this guide's calculation produces 117 resolved ES trades and 110 resolved NQ trades, 227 in total. ES won 28 of its 117 (23.93%) and NQ won 30 of its 110 (27.27%).
The rule holds positions for days or weeks, so it is a swing study on daily bars. The point is the dollar spread of the stop, which an intraday trader also faces on a smaller scale.
Dollar risk of one ATR stop per contract
| Measure | ES per contract | NQ per contract |
|---|---|---|
| Smallest stop | $521.25 | $405.75 |
| 10th percentile | $841.38 | $693.30 |
| Median | $1,449.38 | $1,684.13 |
| 90th percentile | $4,108.75 | $7,255.48 |
| Largest stop | $9,510.63 | $13,066.25 |
| Largest divided by smallest | 18.25 times | 32.20 times |
| 90th divided by 10th percentile | 4.88 times | 10.47 times |
The median looks manageable: $1,449.38 on ES is 2.90% of a $50,000 account. The largest ES stop, $9,510.63, is 19.02% of the same account. On NQ the largest, $13,066.25, is 26.13%. One rule, one multiple, and a dollar range that runs from "normal trade" to "a fifth of the account".
NQ is the more extreme product on both ratios. Its 90th-to-10th percentile ratio is more than double the ES figure. A single ATR multiple does not deliver a single risk level, even across two index products in the same asset class.
Stop Loss Placement in Volatility Based Sizing
In volatility based sizing the stop is placed first and the size is derived from it, never the other way round. If you pick the size first and then squeeze the stop to fit the budget, the stop is no longer measuring volatility. It is measuring what you can afford.
Four stop definitions on the same signals
Holding the 55-session breakout signals and the channel exits fixed, the 20-year ES and NQ study was rerun with four stop definitions. Three are ATR multiples. The fourth is a fixed point distance set to each product's median ATR over the whole sample (28.50 points on ES, 69.25 on NQ), which is what a trader gets by picking one number once and never revisiting it. Results are in R, before costs.
| Stop definition | ES trades | ES win rate | ES net R | NQ trades | NQ win rate | NQ net R |
|---|---|---|---|---|---|---|
| 0.5 ATR | 176 | 9.66% | -37.37R | 151 | 14.57% | +70.27R |
| 1.0 ATR | 117 | 23.93% | -7.47R | 110 | 27.27% | +34.79R |
| 2.0 ATR | 87 | 35.63% | -2.59R | 78 | 39.74% | +22.48R |
| Fixed median distance | 131 | 18.32% | -5.42R | 134 | 19.40% | +47.44R |
Three things stand out.
- Wider stops raise the win rate without rescuing a weak signal. ES went from 9.66% winners at 0.5 ATR to 35.63% at 2.0 ATR and stayed negative throughout.
- The fixed distance was not obviously worse. On ES it beat the 1.0 ATR stop in net R, and on NQ it beat both the 1.0 and 2.0 ATR stops.
- The product mattered more than the stop. Every NQ variant was positive and every ES variant was negative.
That weakens the case for a volatility stop as an edge. On this data its value is standardising dollar risk per trade, not improving the trade.
A tighter stop with more contracts is not lower risk
On ES, the median 0.5 ATR stop cost $661.59 on one contract and the median 2.0 ATR stop cost $2,742.50. If you hold the contract count constant, the tight stop cuts risk and the wide stop multiplies it. If you let size scale up to fill the budget, the tight stop buys more contracts and the dollar risk is the same. What the tight stop changes is how often you get stopped out, and the 9.66% ES win rate shows how expensive that can get.
Gaps and stop orders
A stop order becomes a market order once the stop price is reached, and Investor.gov notes the fill can differ from the stop price in a fast-moving market. Volatility sizing assumes the stop fills near its level. When price gaps through it, the realised loss is larger than the planned one, and no ATR multiple prevents that.
Related lesson: Stop loss orders and placement
Risk Budgets for Volatility Stops Over 20 Years
Capital preservation is where the sizing choice shows up in the account balance. In this guide's 20-year ES and NQ breakout study on Yahoo Finance daily bars (1.0 ATR stop), each policy below started with $50,000 and recomputed its budget from current equity before every trade, so a losing stretch shrank the next position.
Costs were charged on every trade: two ticks of slippage plus an assumed $4 round-turn commission on a full-size contract or $1 on a micro. That works out to a mean of 0.0211R per trade on full-size ES and 0.0255R on MES, and 0.0098R on NQ and 0.0140R on MNQ. These are modelling assumptions, not any firm's fee schedule.
ES results by sizing policy
| ES policy | Trades funded | Median contracts | Ending equity | Worst peak-to-trough |
|---|---|---|---|---|
| One ES per signal | 89 of 117 | 1 | Below zero on trade 89 | Over 100% |
| 1% budget, whole ES only | 0 of 117 | 0 | $50,000.00 | 0% |
| 0.5% budget, MES | 81 of 117 | 2 | $47,190.30 | 6.48% |
| 1% budget, MES | 108 of 117 | 3 | $46,578.01 | 19.94% |
| 2% budget, MES | 116 of 117 | 5 | $39,124.79 | 41.43% |
NQ results by sizing policy
| NQ policy | Trades funded | Median contracts | Ending equity | Worst peak-to-trough |
|---|---|---|---|---|
| One NQ per signal | 110 of 110 | 1 | $72,022.45 | 87.53% |
| 1% budget, whole NQ only | 1 of 110 | 1 | $51,651.00 | 0% |
| 0.5% budget, MNQ | 66 of 110 | 2 | $57,309.78 | 5.02% |
| 1% budget, MNQ | 93 of 110 | 4 | $65,163.42 | 10.16% |
| 2% budget, MNQ | 110 of 110 | 8.5 | $86,360.95 | 20.98% |
Lessons from the ES and NQ risk budget results
In the 20-year ES and NQ breakout study, the one-contract-per-signal policy is the result to read twice. A fixed contract count wiped out the ES account and put NQ through an 87.53% drawdown, on exactly the same signals the budgeted policies traded.
The whole-contract policies are the mirror image. A 1% budget on $50,000 is $500, and the tightest ES stop in the whole sample cost $521.25 on one contract. That rule never placed a trade.
Micros are where the policy became tradeable. Doubling the budget from 1% to 2% roughly doubled the drawdown on both products. On ES, where the rule lost money, the bigger budget simply lost more. On NQ it made more and drew down more. Halving the budget to 0.5% cut the worst drawdown to about a third on ES and about half on NQ, but left 36 ES trades and 44 NQ trades unfunded. Lower risk bought a smoother ride and a thinner trade list. That is a real tradeoff, not a free lunch.
Volatility sizing did not stop the ES losing streaks. It changed how much each loss cost. A rule with no edge stays a rule with no edge at a smaller size.
Related lesson: Maximum risk per trade
Contract Rounding in Volatility Position Sizing
Contract rounding is the part of volatility position sizing that the formula hides. A dollar budget divided by a stop distance rarely lands on a whole contract. The remainder is either discarded, which can drop the trade, or rounded up, which breaks the budget.
Whole contracts versus micros at a $500 budget
On the 20-year ES and NQ breakout sample with a 1.0 ATR stop and a flat $500 budget per trade:
| Budget and contract | ES trades funded | NQ trades funded |
|---|---|---|
| $500, whole minis | 0 of 117 | 1 of 110 |
| $500, micros | 111 of 117 | 81 of 110 |
| $1,000, whole minis | 33 of 117 | 36 of 110 |
| $2,000, whole minis | 73 of 117 | 61 of 110 |
The gap between 0 and 111 is not a rounding detail. It is the difference between a rule that trades and one that does not, and it is decided by the contract multiplier, not by the analysis.
Rounding down versus rounding up
Round down and your realised risk sits below the budget. With 1% MES sizing on ES, the median position used about 86% of its budget. Round up and you break the budget: on a $144.94 MES stop, 3 micros commit $434.82, but 4 micros commit $579.76, nearly 16% over a $500 limit. Record the realised dollar risk of the position you took, not the budget it came from.
Two ES trades at opposite ends
The median-risk ES trade in the sample entered short on 11 October 2018 at 2,745.50 after a close below the prior 55-session low. ATR(20) read 28.9875, so the 1.0 ATR stop sat at 2,774.4875. One ES risked $1,449.38, or 2.90% of a $50,000 account. One MES risked $144.94.
- A $500 budget buys no ES and 3 MES, committing $434.82.
- A $1,000 budget buys no ES and 6 MES, committing $869.64.
- A $2,000 budget buys 1 ES, committing $1,449.38 and leaving $550.62 unused. The same $2,000 in micros buys 13 MES and commits $1,884.22.
The widest ES stop entered short on 23 March 2020 at 2,220.50, with ATR(20) at 190.2125 and a stop at 2,410.7125. One ES risked $9,510.63, or 19.02% of the account. One MES risked $951.06. A $500 budget funds neither, so the volatility rule removes the trade rather than shrinking it.
If you are tempted to call that a missed opportunity, notice what the alternative was. Whether removing that trade is right is a policy question. What is not in question is that the budget and the multiplier made the decision, not an opinion about the setup.
Related lesson: Mini and micro futures contracts
How to Backtest a Volatility Sizing Rule
Backtesting a volatility sizing rule tests two things at once, the signal and the sizing, and it is easy to credit one with the other's result. This guide's own 20-year ES and NQ breakout study on Yahoo Finance daily bars is a useful example of how thin the evidence can be even with two decades of data.
What 227 breakout trades prove about volatility sizing
Pooling both products at the 1.0 ATR stop, the 227 trades averaged 0.1204R per trade before costs, with a standard deviation of 2.4153R. That gives a t statistic of about 0.75 and a 95% interval from -0.1938R to +0.4346R. The interval includes zero, so the sample does not show an edge. At this effect size you would need roughly 1,547 trades before the interval cleared zero.
The products also disagree. ES averaged -0.0638R per trade and NQ +0.3163R. Reporting only the pooled figure would hide that one market lost and one made money.
Sizing changes the curve, not the edge
Every sizing policy in the 20-year ES and NQ study traded the same signals. The differences in ending equity and drawdown came from how much each trade risked, not from which trades won. When a backtest shows a smoother equity curve after you add volatility sizing, check whether the expectancy per trade in R actually changed. Usually it has not.
Data traps in a volatility sizing backtest
- Continuous contracts. Front-month series splice contracts at each roll, and vendors handle roll gaps differently. Different vendors can produce different ATR readings on roll dates.
- Costs in R. A fixed dollar cost is a bigger share of R on tight stops. The cost model used here was 0.0211R per ES trade at a 1.0 ATR stop and grows as stops tighten.
- Look-ahead in ATR. Using the signal bar inside the ATR window gives the test information you did not have when you placed the order.
- Unfunded trades. A sizing rule that skips trades changes the trade list. Report how many were skipped, not just the results of the ones taken.
- One sample. Twenty years of daily bars is still one path. A rule that works on one product and fails on its neighbour has not been validated.
Related lesson: Backtesting a trading strategy
Alternative Position Sizing Methods Compared
Volatility based sizing is one of several position sizing methods, and it often works alongside them rather than replacing them. The fractional rule usually supplies the budget, the volatility rule supplies the stop distance, and the contract multiplier does the rest.
| Sizing method | Core input | How size is set | Main weakness |
|---|---|---|---|
| Fixed fractional | Percent of equity and trade risk | Contracts = fraction x equity / dollar risk per contract | Rounds to zero on small accounts |
| Fixed ratio | Profit per added contract (delta) | Adds one contract each time profit grows by a set step | Slow to cut size after losses |
| Kelly criterion | Win rate and payoff ratio | Fraction that maximises long-run growth on known odds | Needs odds you rarely know, full Kelly swings hard |
| Percent volatility | Equity, risk percent and a volatility reading | Equity x risk percent / volatility | Ignores where the chart says the trade is wrong |
| Risk parity | Volatility of each position in a portfolio | Each position sized to contribute similar risk | Built for portfolios, not single intraday trades |
| Value at Risk | Loss distribution at a confidence level | Size capped so estimated loss stays under a limit | Says little about losses beyond the confidence level |
How other sizing methods connect to ATR sizing
- Fixed fractional. Adaptrade's formulation is N = f x equity / trade risk. Volatility sizing is fixed fractional with an ATR-based trade risk.
- Fixed ratio. Ryan Jones's method, as Adaptrade lays out, steps contracts up with accumulated profit rather than equity percent. It ignores volatility unless you add it.
- Kelly. J. L. Kelly Jr. published the growth-optimal betting fraction in 1956. Traders who use it typically scale it down sharply, because estimated odds from a backtest carry large error.
- Risk parity and VaR. These come from portfolio management. They size by statistical volatility of returns, which suits allocation decisions more than the stop-based contract count a futures day trader needs.
Related lesson: Kelly criterion for trading
Common Mistakes With Volatility Sizing
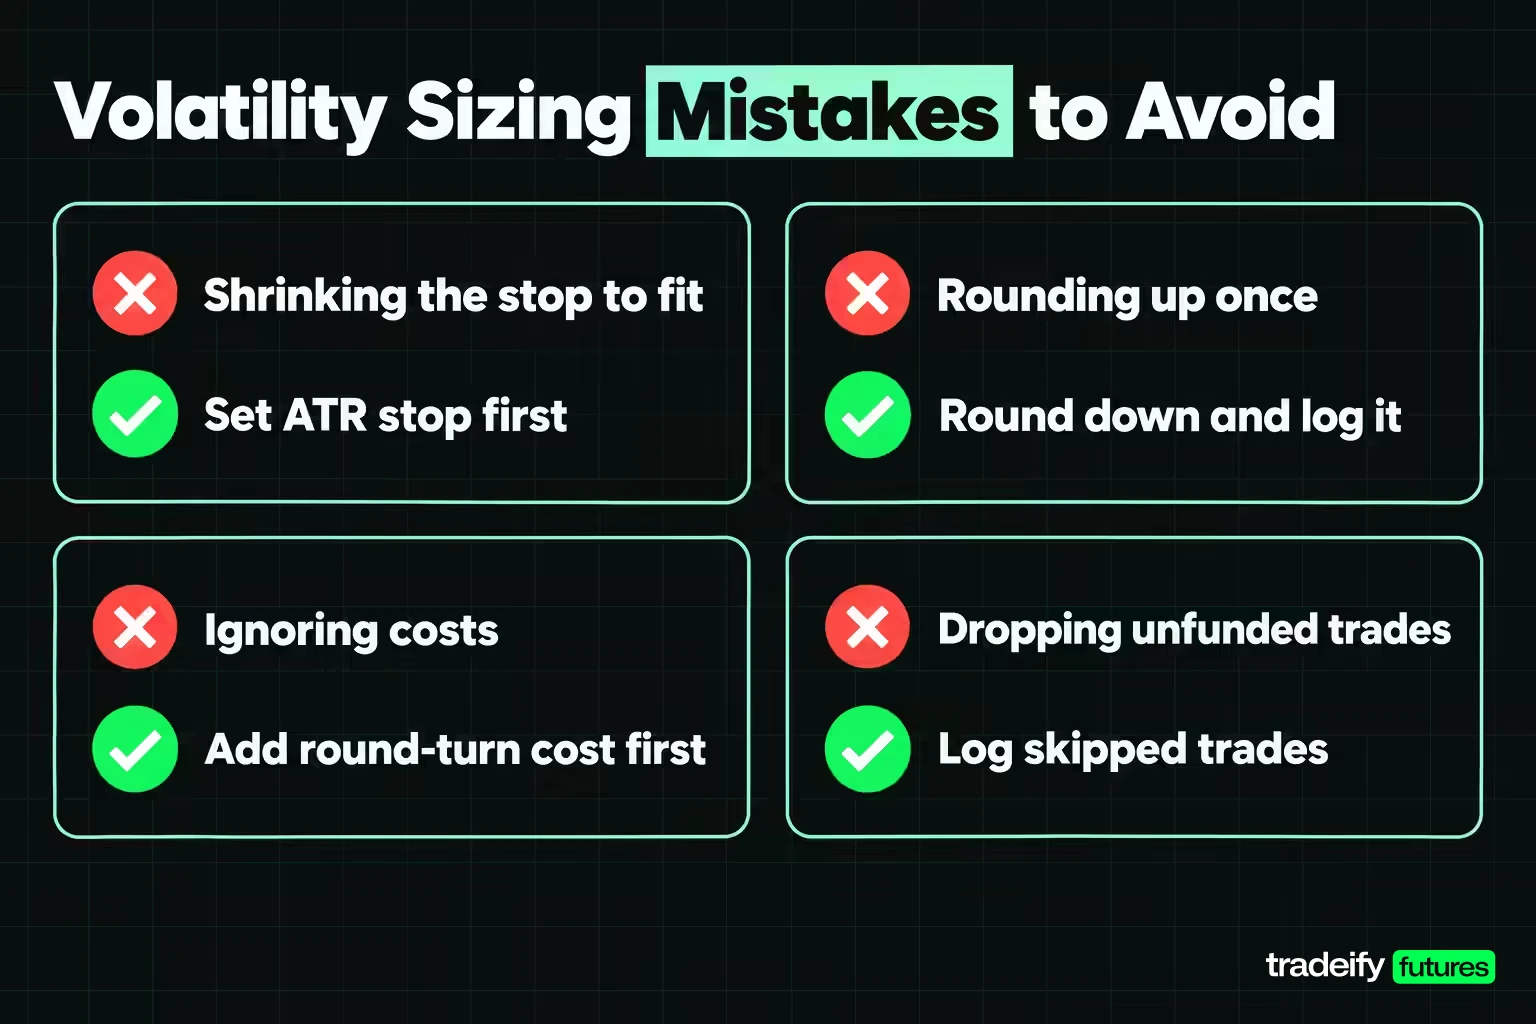
Most volatility sizing mistakes are arithmetic done correctly on the wrong inputs, or arithmetic done correctly and then quietly overridden.
| Mistake | What happens | Fix |
|---|---|---|
| Sizing from the budget, then shrinking the stop to fit | The stop stops measuring volatility | Set the stop from ATR first, then size |
| Rounding up "just this once" | Realised risk breaks the budget | Round down and log the shortfall |
| Ignoring costs in risk per contract | Every position sits slightly over budget | Add round-turn cost before dividing |
| Same ATR multiple on every product | Dollar risk spread differs by product | Check each product's risk distribution |
| Dropping unfunded trades from the journal | Results look better than the rule | Log skipped trades with the reason |
| Sizing from starting equity after losses | Budget stays too large in a drawdown | Recompute from current equity |
| Treating low ATR as permission to max out | Size spikes into a volatility expansion | Cap contracts regardless of the formula |
Best practices for volatility sizing
- Write down the ATR length, timeframe and multiple, and keep them fixed for a meaningful sample.
- Use micros when the whole-contract answer is regularly zero.
- Set a maximum contract count that holds even when ATR is unusually low.
- Track realised dollar risk per trade alongside R so you can see rounding drift.
- Review the distribution of your own stop costs every month, not just the average.
Related lesson: Risk of ruin
Automating Volatility Sizing Calculations
Automating volatility sizing removes the moment where you are tempted to nudge the number, usually right after a loss or right before a setup you really like. Most charting platforms include an ATR indicator, and the remaining steps are simple enough for a spreadsheet, a platform script or a small calculator.
Features of an automated volatility sizing tool
- Pull the ATR value known before entry, on the timeframe your stop lives on.
- Multiply by your fixed stop multiple and convert to dollars with the correct point value.
- Add round-turn costs before dividing.
- Round down and show the unrounded answer, the whole-contract answer and the unused budget.
- Say plainly when the answer is zero, rather than showing a fractional size.
- Apply any contract cap after the formula, so a quiet market cannot override it.
- Log every result, including unfunded trades, to your journal.
Pre-trade checklist for volatility sizing
- Write the stop distance in points and name the ATR length and multiple that produced it.
- Convert that distance to dollars per contract for the contract you will actually trade.
- Divide the dollar budget by that figure and note the unrounded result.
- Round down. If the answer is zero, log the trade as skipped with the budget and risk per contract.
- After entry, record the realised dollar risk of the position you took.
- Recheck the budget against current equity, not the equity you started the month with.
Prop Account Limits on Top of a Volatility Budget
Prop accounts add hard limits on top of whatever volatility sizing formula you use. The formula's output is a request. The account rules decide how much of it you can actually take.
- Contract caps. When ATR is low, the formula may ask for more contracts than the account allows. The cap wins, and your realised risk falls below budget on those trades.
- Trailing or maximum drawdown. A drawdown limit is a dollar floor, not a percentage of equity. Many traders size against the room left above that floor rather than against the account balance. With an illustrative $3,000 maximum drawdown, a $500 risk per trade allows six full stops before the floor.
- Daily loss limits. A daily limit caps the sum of the day's stops. Two or three volatility-sized losses can use it up, so plan how many full stops the day can absorb before the session starts.
- Holding rules. Accounts that must be flat by a set time cannot run a multi-day daily-bar rule. The sizing arithmetic carries over to intraday ATR stops; the holding period does not.
On our accounts, size is capped by contract limits. A 50K account allows up to 4 minis or 40 micros, with 10 micros counting as one mini and minis and micros allowed together inside that limit. Our Help Center notes that 10 MES cost $18.20 round trip against $5.76 for one ES, so once your volatility math lands on 10 or more micros, the mini does the same job for less. Positions are closed by 4:45 PM ET, so on our accounts volatility sizing works on intraday stops, and our funded accounts are simulated.
Volatility Based Position Sizing FAQ
What is volatility based position sizing?
Volatility based position sizing sets the stop distance from a volatility measure such as ATR and divides a fixed dollar budget by that distance to get the contract count. Size falls when volatility rises and rises when it falls. It standardises the dollar loss at the stop rather than reducing the chance of a loss.
What is the formula for position sizing?
Position size equals the dollar risk budget divided by the risk per contract. Risk per contract is the stop distance in points times the point value, plus round-turn costs. Round the result down to a whole contract.
How do you use ATR for position sizing?
Multiply ATR by your stop multiple to get the stop distance in points, then multiply by the contract's point value. A 28.9875-point stop is $1,449.38 on one ES at $50 a point and $144.94 on one MES at $5 a point. Divide your budget by that figure and round down.
Should the ATR multiple be the same on every instrument?
Not automatically. In this guide's 20-year study of Yahoo Finance ES and NQ daily bars, one ATR stop produced a 90th-to-10th percentile dollar risk ratio of 4.88 on ES and 10.47 on NQ. Pick the multiple per instrument and check the resulting dollar risk distribution.
What is the 3-5-7 rule in trading?
The 3-5-7 rule caps risk at 3% of capital on one trade and 5% across open positions, with a 7% minimum profit target on winning trades, as MetroTrade describes it. It is an informal heuristic, not an exchange or regulatory rule. It caps concentration but says nothing about an instrument's volatility.
Can volatility based sizing stop a losing streak?
No. It changes how much each loss costs, not how many losses arrive. In this guide's 20-year breakout study on Yahoo Finance ES daily bars, the rule lost on 89 of 117 trades at a 1.0 ATR stop regardless of the sizing policy. Smaller size slowed the decline without reversing it.
This article is educational and is not investment advice. Futures and leveraged products can lose money quickly, and a gap or fast market can produce a loss larger than the one your stop and position size planned for. The study figures describe one historical rule on one data sample and do not predict future results. Evaluation and funded prop accounts run in simulation, and simulated results can differ from live trading.


