




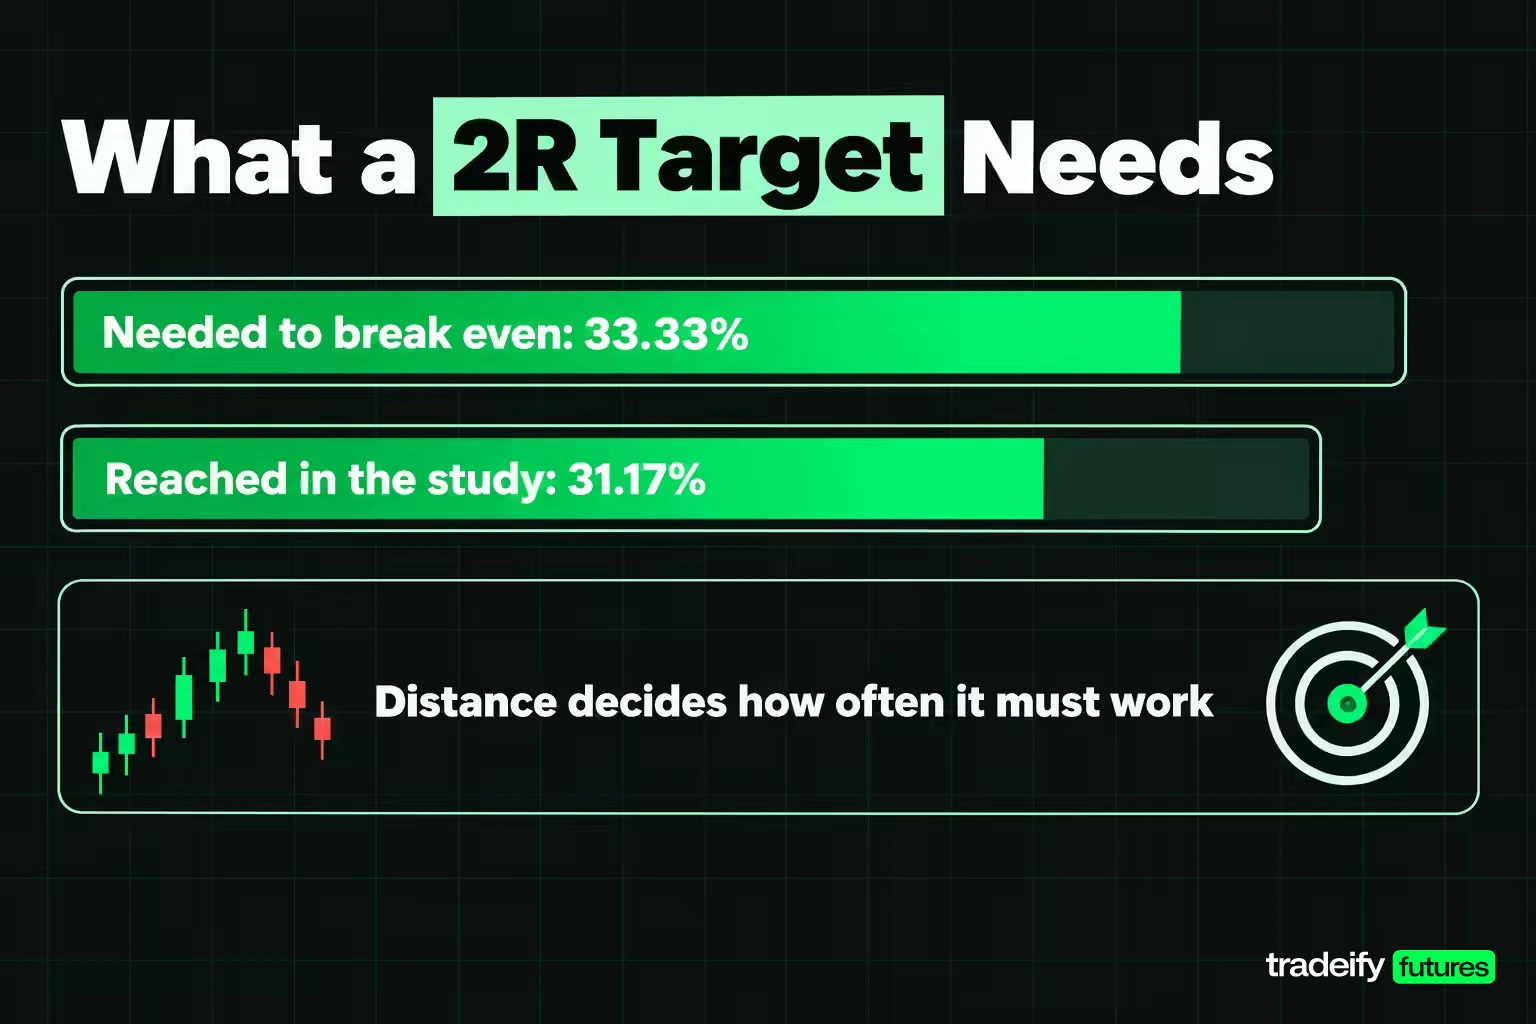
TL;DR: Profit target distance decides how often a trade has to work, not whether the trade pays. A 2R target needs a 33.33% reach rate to break even before costs. On 1,200 intraday index futures entries, 2R was reached 31.17% of the time. Set the target from the chart, then test its reach rate on your own log.
You put on a trade, it moves your way, and now you have to decide where it ends. A profit target makes that call before the pressure arrives. It is the price, or the amount of money, at which you plan to take the gain.
On a single trade it is usually a limit order resting at a chosen price, so the exit happens whether or not you are watching. Over a day, a week or an evaluation it is a dollar goal. In a business it is the profit a plan has to produce. This guide covers all three, with the most depth on the trade-level profit target, because that is where the number gets tested on every position.
What a Profit Target Is
A profit target is a planned exit for a winning position or a planned profit level for a period. The phrase gets used for three different things, and mixing them up causes real mistakes.
- Trade profit target. A price level where you close a winning trade. On a long it sits above the entry, on a short below it. It is usually sent as a take-profit order, which is a limit order to close the position.
- Period profit target. A dollar goal for a day, a week or a month. It is not a price. It is a total of closed trades.
- Evaluation or business profit target. A threshold you have to reach to complete something: a prop firm evaluation, a budget or a sales plan.
A trade profit target answers "where does this move probably end?" A period profit target answers "how much do I want to have made?" Only the first is about the market. The second is about you, and the market has no idea it exists.
How a Profit Target Works With a Take-Profit Order and a Stop
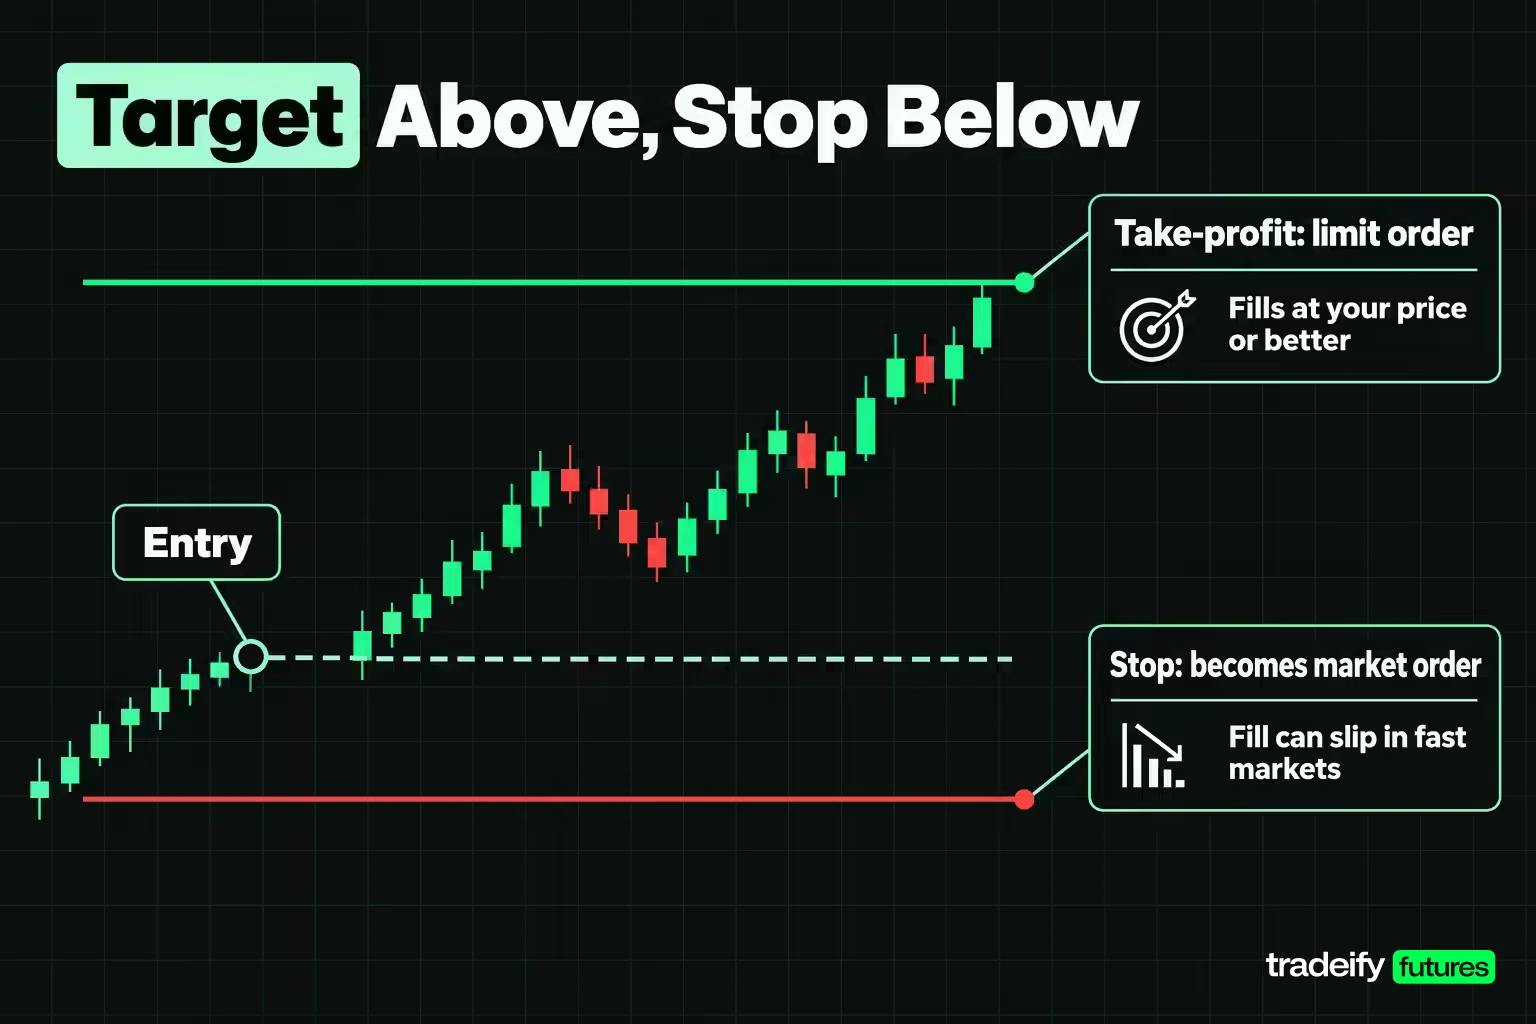
A take-profit order is the order type that carries out a trade profit target. On a futures exchange it is a limit order: CME defines a limit order as one executed at a specific price or better, so a sell limit above the market fills at your price or higher and a buy limit below the market fills at your price or lower. A take-profit order cannot fill worse than its price.
A stop works the other way round. A stop order becomes a market order once its price is reached, and Investor.gov warns that the execution price may differ from the stop price, especially in a fast-moving market. So the target controls the price but not whether you get out, while the stop controls whether you get out but not the price.
Most futures platforms link the two as a bracket. The entry fills, the platform places the stop and the profit target, and the two exit orders are joined as OCO (one cancels the other): when one fills, the other is cancelled. If the link is missing, a filled stop can leave the profit target working with no position behind it. A later fill on that order opens a brand-new trade you never planned, usually at the worst moment.
Why a touched profit target may not fill
A limit order rests in a queue at its price. When the market only touches your price, the orders ahead of yours in the queue may absorb all the volume traded there. Your take-profit order is certain to fill only once price trades through it. That matters for how targets get tested, because a backtest that counts every touch as a fill is slightly optimistic.
Related lesson: Bracket orders
Why Profit Targets Matter
A profit target matters because it turns a trade idea into a measurable bet. Once the stop and the target are fixed before entry, you know the reward for each unit of risk, and that ratio sets the win rate the setup has to beat.
The formula is short. If the target is k times the stop distance (call the stop distance 1R), the reach rate you need to break even before costs is 1 / (1 + k).
| Profit target | Reward per unit of risk | Break-even reach rate |
|---|---|---|
| 1R | 1 to 1 | 50.00% |
| 1.5R | 1.5 to 1 | 40.00% |
| 2R | 2 to 1 | 33.33% |
| 3R | 3 to 1 | 25.00% |
Three things follow from that table.
- The target is half of the expectancy calculation. Without a fixed target you cannot say what a winner is worth, so you cannot say whether the win rate is good enough.
- A wider target lowers the win rate you need and the win rate you get. The useful question is which falls faster.
- A pre-set target removes one in-trade decision. The hardest exit to make is the one you invent while the position is moving and your P&L is flashing. A resting order decides in advance.
Costs push every break-even rate up. Commissions and slippage come out of every trade, winners and losers alike, so the smaller the stop distance in ticks, the bigger the share of each R the costs eat.
Related lesson: Risk-reward ratio
How to Set a Realistic Profit Target
A realistic profit target is one the market reaches often enough to pay for the losers. Almost every method for choosing the price comes from one of five sources.
| Target source | How the price is chosen | Built-in weakness |
|---|---|---|
| Chart structure | Prior swing high or low, a range edge, the prior day's high or low | Needs a judgment about which level matters |
| Fixed ratio | A multiple of the stop distance, such as 2R | Widening the stop moves the target further away even if the market has not changed |
| Volatility multiple | A multiple of a recent range or average true range | Scales with conditions, but says nothing about where price is likely to stop |
| Measured travel | A distance your own data shows is reached often enough | Needs a log or a study, and old data can go stale |
| Fixed dollar amount | A round number of dollars per trade | Ignores the market completely |
The structure and measured-travel methods are the only two that start from what the instrument has been doing. The ratio method is the most common in bracket templates, and it hides a trap: the target becomes a multiple of the stop, so a wider stop drags the target further away even though nothing about the market changed.
A practical order of operations:
- Place the stop where the trade idea is proven wrong.
- Find the nearest level where the move is likely to stall, and measure that distance.
- Divide the target distance by the stop distance to get k.
- Look up the break-even reach rate for k and ask whether this setup reaches that level that often.
For scale, the median 5 minute bar range on the E-mini S&P 500 between September 30 and November 4, 2026 was 6.75 points, which is $337.50 on one ES contract and $33.75 on one MES. A 2R target from a stop that size sits 13.50 points away. Whether that is realistic depends on how far price usually travels in the time you plan to hold, and that is something you can measure rather than guess.
Profit Target Distance Measured on 1,200 Entries
Most articles on profit targets give you a ratio and stop there. This study measured how often targets at four distances were actually reached before the stop on index futures, using one entry rule so that only the target changes.
How the 1,200 profit target entries were built
- Data. 5 minute bars on the continuous front-month E-mini S&P 500 (ES), E-mini Nasdaq-100 (NQ), E-mini Dow (YM) and E-mini Russell 2000 (RTY), regular session 9:30 AM to 4:00 PM ET, from Yahoo Finance.
- Sessions. The 25 most recent complete sessions, September 30, 2026 to November 4, 2026, all on the December 2026 contracts. October 30 was excluded because the data feed was missing a bar and carried a bad 3:00 PM print.
- Entries. At 10:00 AM, 11:00 AM, 12:00 PM, 1:00 PM, 2:00 PM and 3:00 PM ET, the close of the 5 minute bar opening at that time is the entry. A long and a short both open at that price, so a market that drifted one way does not flatter one side. 4 products x 25 sessions x 6 times x 2 directions = 1,200 entries.
- Risk unit. 1R is the high-to-low range of the entry bar. The stop sits 1R away; targets sit at 1R, 1.5R, 2R and 3R.
- Scoring. From the next bar to the 4:00 PM close, the first level touched wins. A bar that touches both is scored to the stop. An entry that reaches neither exits at the 4:00 PM close and is counted as unresolved. A touch of the target counts as a fill, and there are no commissions or slippage.
- Intervals. 95% intervals come from resampling whole sessions 4,000 times, so entries on the same day are not treated as independent.
The median risk unit was 6.75 points on ES, 40.00 points on NQ, 41.5 points on YM and 3.30 points on RTY.
Profit target reach rates against the break-even rate
The table shows the counts and rates from this guide's own study of Yahoo Finance 5 minute data on ES, NQ, YM and RTY (1,200 entries, September 30 to November 4, 2026), set beside the reach rate each target distance needs to break even before costs.
| Target distance | Reached first | Stopped first | Unresolved | Reach rate | Rate needed | Median minutes to fill |
|---|---|---|---|---|---|---|
| 1R | 595 | 595 | 10 | 49.58% | 50.00% | 15 |
| 1.5R | 461 | 705 | 34 | 38.42% | 40.00% | 20 |
| 2R | 374 | 757 | 69 | 31.17% | 33.33% | 30 |
| 3R | 243 | 805 | 152 | 20.25% | 25.00% | 50 |
The 1R row is a built-in control. Because every long has a mirror-image short from the same price, the long's target is the short's stop. One side of each pair wins and the other loses, so the row lands on 50% by construction. It confirms the scoring has no directional tilt.
The wider rows are where it gets interesting. In this guide's study, each one fell short of its break-even rate, by 1.58 points at 1.5R, 2.16 points at 2R and 4.75 points at 3R. Only the 3R shortfall is clear of noise: its interval runs from 17.25% to 23.42%, all of it below the 25.00% needed. The 1.5R interval (36.50% to 40.25%) and the 2R interval (28.67% to 33.67%) both include the break-even rate.
Every wider target also cost time and patience, which is easy to underestimate when you are sitting through it. Stops per fill went from 1.00 at 1R to 1.53, 2.02 and 3.31, and the median wait for a 3R fill was 50 minutes.
Why a reach rate below break-even still showed positive expectancy
This is the part the break-even formula hides. In this guide's 1,200-entry study, the 2R rule had an expectancy of +0.0189R and the 3R rule +0.0531R, even though both missed their break-even reach rates. The difference came from unresolved trades.
The formula 1 / (1 + k) assumes every trade ends at the stop or the target. At 3R, 152 entries (12.67%) reached neither and closed at the bell, with a mean of +0.919R; 126 of the 152 closed above their entry. At 2R, 69 unresolved entries averaged +0.46R. A trade that has not been stopped by the close is, almost by definition, one that drifted your way.
Neither positive figure is established. The 2R interval runs from -0.0364R to +0.0773R and the 3R interval from -0.0343R to +0.1469R, so this sample cannot tell those rules apart from zero.
How sensitive the profit target results are
- Trade-through instead of touch. Requiring price to trade one tick through the target cut 2R fills from 374 to 372 and 3R fills from 243 to 241. The touch rule barely moved the result.
- Products. In the same Yahoo Finance study, 2R reach rates were 30.00% on ES, 32.00% on NQ, 32.33% on YM and 30.33% on RTY. At 3R the spread widened, from 17.67% on NQ and RTY to 23.33% on YM.
- Direction. In the same study, 2R targets were reached on 31.67% of longs and 30.67% of shorts.
Related lesson: Trading expectancy
What a Filled Profit Target Leaves Behind
A filled profit target is a decision that the move ends at your price. This guide's own study of Yahoo Finance 5 minute data on ES, NQ, YM and RTY (1,200 entries, September 30 to November 4, 2026) shows what that decision cost and what it saved.
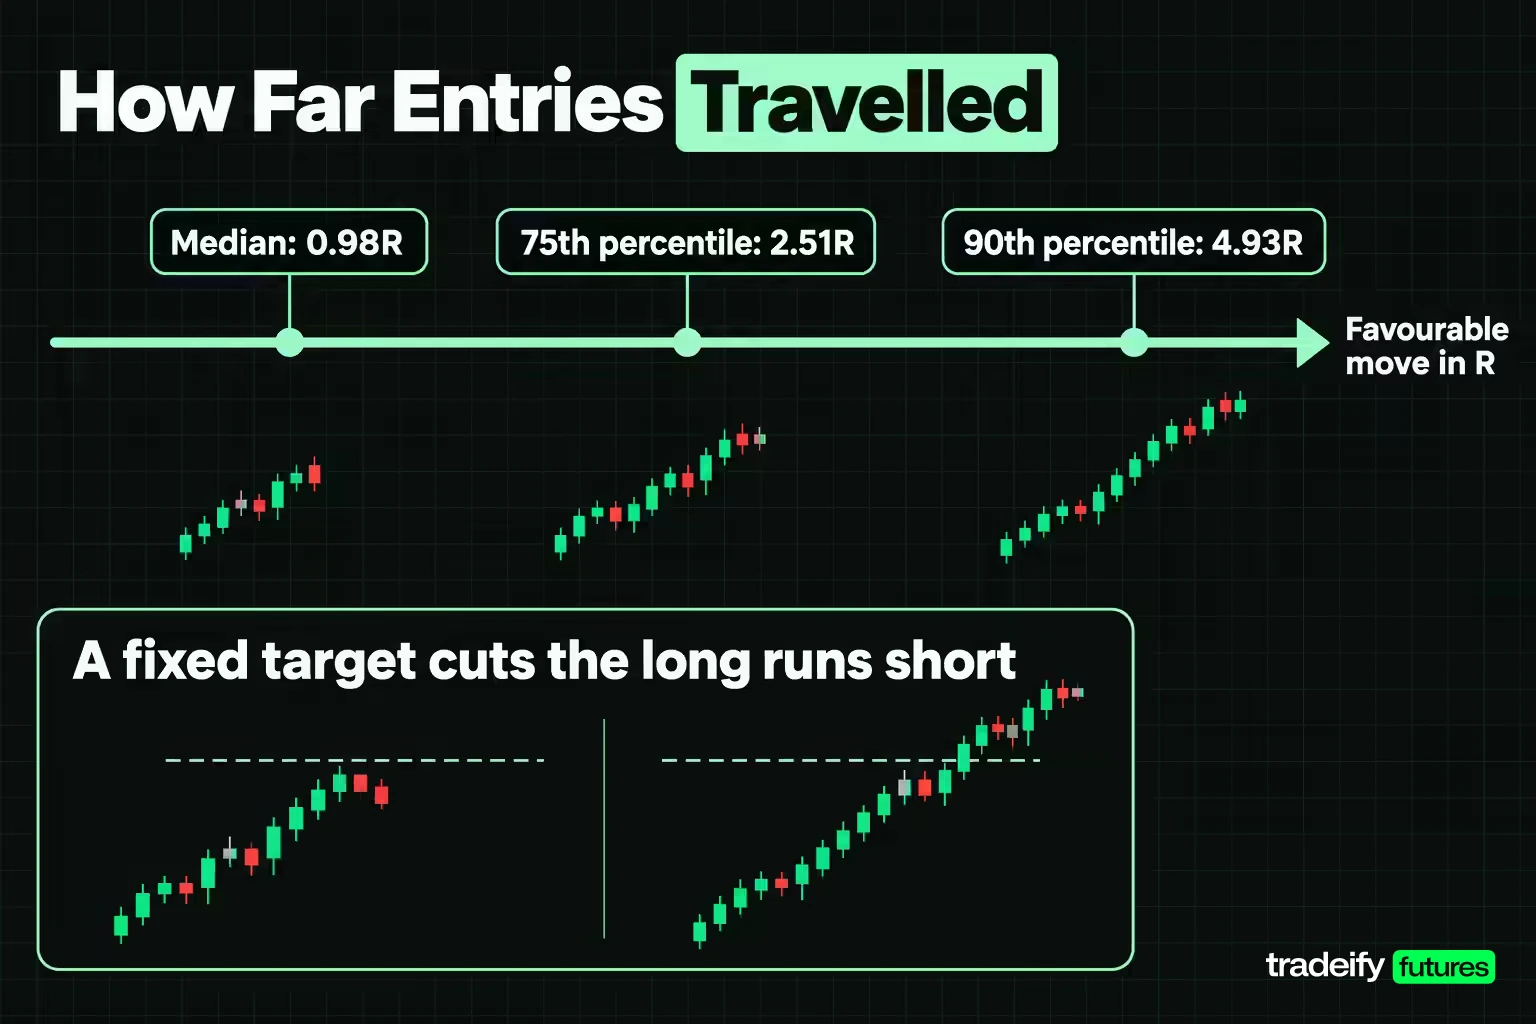
In that study, before the stop was hit (or by the close), the median entry travelled 0.98R in its favour, the 75th percentile 2.51R and the 90th percentile 4.93R. So one entry in ten went nearly five times the entry bar's range before reversing to the stop, and a fixed target cut every one of those short. Of the 595 entries that filled a 1R target, 374 (62.86%) went on to reach 2R before the stop.
What 2R profit target fills did after the fill
The 374 entries that filled a 2R target in this guide's own study of Yahoo Finance 5 minute data on ES, NQ, YM and RTY (1,200 entries, September 30 to November 4, 2026) split evenly on where the session closed.
| After a 2R fill | Entries | Share of 2R fills |
|---|---|---|
| Closed below the fill price | 187 | 50.00% |
| Closed at or beyond the fill price | 187 | 50.00% |
| Closed 1R or more back through the fill | 119 | 31.82% |
| Closed 1R or more beyond the fill | 131 | 35.03% |
That split, from this guide's own index futures study, is the honest case for and against a profit target. Half the fills locked in a price the market later gave back, and 119 of them would have handed back at least 1R of a 2R gain. The other half capped a move that kept going, and 131 left at least 1R more on the table. You cannot sort the two groups at entry. That is why the exit rule has to be judged across many trades, not on the last one.
A short ES trade where the profit target capped the move
On September 30, 2026, the 12:00 PM 5 minute bar on ES opened at 7774.75, traded between 7772.25 and 7777.75 and closed at 7776.25. Its 5.50 point range is 1R. A short from 7776.25 puts the stop at 7781.75 and a 2R take-profit order at 7765.25.
| Bar (ET) | Open | High | Low | Close |
|---|---|---|---|---|
| 12:00 PM entry bar | 7774.75 | 7777.75 | 7772.25 | 7776.25 |
| 12:05 PM | 7776.50 | 7778.25 | 7774.75 | 7775.50 |
| 12:10 PM | 7775.50 | 7778.50 | 7774.00 | 7777.50 |
| 12:15 PM | 7777.50 | 7777.75 | 7769.00 | 7772.00 |
| 12:20 PM | 7771.75 | 7772.50 | 7769.75 | 7770.25 |
| 12:25 PM | 7770.25 | 7771.00 | 7767.25 | 7767.25 |
| 12:30 PM | 7767.75 | 7768.25 | 7765.00 | 7767.50 |
The 12:30 PM bar traded down to 7765.00, through the 7765.25 target, and filled the order 30 minutes after entry. On one ES contract the stop risked $275 and the target paid $550 before costs; on one MES those are $27.50 and $55. The session closed at 7713.25, 63.00 points below the entry, or 11.45R. Holding to the bell would have been worth $3,150 on one ES. The target took 2R and left 9.45R behind.
A long ES trade where the profit target saved the gain
This ES example uses the same 2R profit target rule as this guide's 1,200-entry study, with 1R equal to the entry bar's range. On October 8, 2026, the 10:00 AM bar on ES closed at 7833.75 after a range of 4.25 points (7830.00 to 7834.25). A long from 7833.75 carries a stop at 7829.50 and a 2R target at 7842.25. The 10:20 AM bar printed a high of exactly 7842.25, 20 minutes after entry, for a $425 gain on one ES against $212.50 of risk. The session then closed at 7817.25, 16.50 points below the entry, or -3.88R. Without the target the position would have been stopped out for -1R.
There is a catch worth naming. That 7842.25 high was a touch, not a trade-through, so a real take-profit order at that price may or may not have filled. The rule that saved this trade is the same rule that capped other trades in the study, and only hindsight tells the two apart.
Partial Profit Targets, Break-Even Stops and No Target
Partial profit targets split the exit: part of the position comes off at a first target and the rest is managed differently, often with the stop moved to the entry price (a break-even stop). This guide's own study of Yahoo Finance 5 minute data on ES, NQ, YM and RTY (1,200 entries, September 30 to November 4, 2026) ran six exit rules on the same 1,200 entries and the same 1R stop, so the only difference is the exit.
| Exit rule | Expectancy | 95% interval | Sign established |
|---|---|---|---|
| Fixed 1R profit target | 0.0000R | none (mirror control) | No |
| Fixed 1.5R profit target | -0.0049R | -0.0375R to +0.0266R | No |
| Fixed 2R profit target | +0.0189R | -0.0364R to +0.0773R | No |
| Fixed 3R profit target | +0.0531R | -0.0343R to +0.1469R | No |
| Half at 1R, rest to the close with a break-even stop | +0.0625R | -0.0373R to +0.1814R | No |
| No target, 1R stop, exit at the close | +0.1053R | -0.1314R to +0.3904R | No |
In that study, none of the six rules established a sign. The no-target hold had the highest point estimate and by far the widest interval, and that width is the story.
How concentrated the no-target and partial results were
The no-target rule made +126.32R across 1,200 entries, but its ten largest entries made +137.77R on their own. Remove those ten and the other 1,190 averaged -0.0096R. The single largest entry was +17.38R. The partial rule showed the same shape: +75.02R in total, +73.67R from its ten largest entries, and +0.0011R per entry without them. The fixed 3R target kept +0.0283R per entry after its ten largest trades were removed, because a fixed target caps every winner at 3R.
The partial rule took a full 1R loss on 595 entries, banked half at 1R on the other 595, and then 391 of those runners were stopped at break-even. Only 204 runners made it to the close.
So choosing between a fixed target and a runner really means choosing a distribution. A fixed target gives you many similar outcomes. A runner gives you mostly small outcomes and a handful of very large ones, and a month without those few large days looks like a losing month.
Trailing stops as a middle path
A trailing stop moves the exit behind price as the trade works, which sits between a fixed profit target and no target at all. It was not one of the six exit rules in this guide's 1,200-entry index futures study, so there is no measured figure for it here. To judge a trailing stop against a fixed target, run both on the same entries with the same initial stop, then compare the interval around each expectancy, not just the average.
Related lesson: Scaling in and scaling out
Daily and Weekly Profit Targets
A daily or weekly profit target is a dollar goal for a period rather than a price for one trade. As a stopping rule it can help. As a requirement it turns dangerous fast.
The session clock and the profit target
Every intraday profit target has a deadline: the end of your session. In this guide's own study of Yahoo Finance 5 minute data on ES, NQ, YM and RTY (1,200 entries, September 30 to November 4, 2026), the median time to fill was 15 minutes at 1R, 30 minutes at 2R and 50 minutes at 3R. Entries later in the day had less time to get there.
| Entry time (ET) | 2R reach rate | 3R unresolved at the close |
|---|---|---|
| 10:00 AM | 32.5% | 10.0% |
| 11:00 AM | 34.5% | 6.0% |
| 12:00 PM | 33.5% | 11.0% |
| 1:00 PM | 31.0% | 11.5% |
| 2:00 PM | 29.0% | 19.0% |
| 3:00 PM | 26.5% | 18.5% |
In that study, by the 2:00 PM and 3:00 PM entries, nearly one 3R target in five never resolved before the bell. A target whose usual time to fill is longer than the time left in the session is not really a target anymore. In practice the exit becomes whatever the closing price happens to be.
Should you stop after hitting a daily profit target?
A daily target used as a ceiling ("I stop once I am up this much") protects a good day from a late, tired trade. A daily target used as a floor ("I keep going until I am up this much") does the opposite: it pushes you into extra trades on exactly the days your setups are not showing up. A practical rule is to set the ceiling in R, not dollars, and to treat a missed daily target as information about the market, not a debt to repay tomorrow.
Weekly and monthly targets have the same problem at a larger scale. A trader who is behind on Thursday feels the pull to size up on Friday. That is the moment a goal starts making decisions for you. If you set period goals at all, make them process goals (trades taken within the plan, stops honoured) as well as dollar goals.
How much day traders make per day on a $100,000 account
There is no reliable published average for what day traders make per day, on a $100,000 account or any other size. The best large study points the other way. Chague, De-Losso and Giovannetti's paper "Day Trading for a Living?" followed individuals who day traded Brazilian equity index futures and found that 97% of those who persisted more than 300 days lost money.
The arithmetic of a daily profit target on a $100,000 account shows why a fixed daily number is the wrong starting point. Imagine a hypothetical trader risking 0.5% per trade, which is $500. A setup with an expectancy of +0.05R per trade earns $25 per trade on average before costs, so four trades a day average $100, with individual days swinging by several hundred dollars either way. A daily target of $1,000 on that account would need 10 times the average day. Size and expectancy set what a day can produce; the target does not.
Profit Targets on Prop Firm Evaluations
A prop firm evaluation profit target is a completion threshold. It is the amount of profit you have to reach, under the firm's other rules, to pass. It is not a price level and it should never set an individual trade's exit.
The target-to-drawdown ratio
The raw target matters less than how it compares with the drawdown limit. Take a hypothetical evaluation with a $4,000 profit target and a $2,500 trailing drawdown, a ratio of 1.6 to 1. If you risk a fixed $250 per trade, the target is 16R away and the drawdown 10R away.
- At +2R per winner, 8 winners in a row with no losses would clear the target.
- Every 1R loss adds half a winner back to the count.
- 10 losses in a row would end the evaluation.
The higher the target relative to the drawdown, the longer the run of trades you need, and the more chances a losing streak has to arrive first. Halving risk per trade doubles the number of R in both directions: the drawdown gets safer, and the target gets further away in trade count.
Profit thresholds after an evaluation
Many funded programs keep profit requirements after the evaluation, such as a minimum profit or a number of profitable days before a payout can be requested. They work like profit targets with different consequences, so read them the same way: in R, against the drawdown, and with a realistic count of trading days. Deadlines, where a program has them, shorten the run of trades available. Programs without a deadline remove that pressure, which is one less reason to force size.
Target Profit in Business Planning
In business, target profit is the profit a plan is built to produce, and it drives decisions on price, volume and cost. Managerial accounting calls the method cost-volume-profit (CVP) analysis.
The core formula is:
Units needed = (fixed costs + target profit) / contribution margin per unit
Contribution margin per unit is the selling price minus the variable cost of one unit. A standard teaching example uses fixed costs of $3,400, a target profit of $850 and a contribution margin of $1.70: (850 + 3,400) / 1.70 = 2,500 units. Divided by the contribution margin ratio instead, $4,250 / 0.17 = $25,000 of sales.
An illustrative case with round numbers: fixed costs of $20,000, a target profit of $10,000 and a $15 contribution margin per unit need $30,000 / $15 = 2,000 units. If the market will not buy 2,000 units at that price, the plan has three levers: raise the price, cut the variable cost, or cut fixed costs.
The trading version works the same way. Your fixed costs are platform, data and account fees. Your contribution per trade is your expectancy in dollars after commissions. A monthly profit target divided by that expectancy tells you how many trades the plan needs. If that number is more than your setup produces, the target is not realistic.
Monitoring and Adjusting Profit Targets
Monitoring a profit target means comparing the target you planned with the exit you got, trade by trade. Adjusting it means changing the rule for future trades, never the order on an open one.
Log three numbers for every trade: the planned target, the realised exit and the furthest price reached in your favour before the exit. Over a few dozen trades those three columns answer the questions that matter:
- Reach rate. How often did price get to the planned target before the stop? Compare it with 1 / (1 + k).
- Give-up. How far did price go past your target after the fill?
- Near misses. How often did a trade get stopped out and then reach the target later? In this guide's 1,200-entry index futures study this happened often: 209 of the 757 entries stopped before a 2R target later traded to it, and 250 of 595 at 1R. A high near-miss count points at the stop, not the target.
Review on a schedule, such as monthly, not after a painful trade. Change the target rule only when the sample says so. A volatility-scaled target (a multiple of a recent range) adjusts itself as conditions change, which removes the need to keep moving a fixed number.
Related lesson: How to keep a trading journal
Common Mistakes With Profit Targets
Most profit target failures are not arithmetic errors. They are decisions that feel reasonable in the moment and quietly rewrite the plan.
| Mistake | The tell in the moment | The check that catches it |
|---|---|---|
| Target set too tight | The target sits inside the normal noise of one bar | Compare the target distance with the median bar range |
| Target set beyond reach | A big ratio on the ticket and a long wait for fills | Count how often that distance was reached in your log |
| Target moved further after entry | The trade is working and you want more | Log the original target and compare it with the exit |
| Chasing a daily or evaluation target | Extra trades or bigger size late in the period | Cap trades per day and size in R, not dollars |
| Target not linked to the stop | The stop filled and the target is still working | Confirm the bracket shows both orders as OCO |
Moving a target after entry deserves extra attention, because it feels like optimism rather than a rule break. It is not a new ratio. It is an unrecorded change of plan, and the journal ends up describing a strategy you never actually traded.
Tips to Hit Profit Targets More Consistently
Hitting profit targets more consistently means choosing targets the market actually reaches, then letting the orders do the work. Run this before your next trade and again each month on your log.
- Set the stop from the chart first, at the price that proves the idea wrong.
- Find the nearest level where the move is likely to stall and measure that distance.
- Divide by the stop distance, look up the break-even reach rate and write it next to the trade.
- Ask whether this setup, on this instrument, at this time of day, reaches that level that often. If you have not measured it, you have an assumption, not an answer.
- Check the clock. If the usual time to fill is longer than the time left in your session, shorten the target or skip the trade.
- Place the target as part of a linked bracket so it works when you are not watching.
- Record the planned target and the realised exit separately.
Profit target brackets and the daily flat time
On our accounts, several of the supported platforms build the profit target into a bracket. Tradovate's ATM Strategies place the stop loss and profit target automatically after the entry fills, linked OCO, and allow more than one target, though brackets are not supported while you use Tradovate Group Trading. R Trader Pro keeps brackets and OCO orders on Rithmic's servers if your internet drops, Tradesea's position brackets resize when you add or reduce, and WealthCharts offers multi-bracket orders for scaling out. Every position on our accounts has to be closed by 4:45 PM ET, so a profit target that has not filled by then needs a manual exit; positions left open are closed automatically, with slippage risk.
Profit Target FAQ
What is a profit target in trading?
A profit target in trading is the price at which you plan to close a winning position, set before or at entry. It is usually placed as a take-profit limit order linked to a stop. The distance from entry, measured against the stop, sets the win rate the trade needs to break even.
What is the 3-5-7 rule in trading?
The 3-5-7 rule is an informal rule of thumb: risk at most 3% of the account per trade, keep total open risk under 5%, and aim for a 7% profit figure. It is not an exchange or regulatory rule. The 7% is defined inconsistently, as a minimum profit target in some sources and a profit-to-loss ratio in others, so check which version you are reading.
Is it better to use a take-profit order or exit manually?
Neither is better in every case: a take-profit order removes an in-trade decision and fills at your price or better, but it caps the move. In this guide's own Yahoo Finance study of 1,200 index futures entries, none of six exit rules showed an expectancy clearly above zero. Choose the rule whose spread of outcomes you can live with, then test it on your own entries.
How do I calculate a profit target?
Start from the stop distance. Multiply it by your chosen ratio, or measure the distance to the nearest likely stalling level and divide it by the stop distance. Then compare the break-even reach rate, 1 / (1 + k), with how often your setup has actually reached that distance.
Does a take-profit order guarantee the price?
It guarantees the price but not the fill, because a limit order fills only at its price or better and orders ahead of yours in the queue may take all the volume on a touch. Only a trade-through makes the fill certain.
This article is educational, not investment advice, and its study is a historical measurement on 25 sessions without costs, not a prediction. Futures use leverage and can lose more than you expect, funded and evaluation accounts are simulated, and no profit target or exit rule guarantees a profit.


