




TL;DR: The risk reward ratio is your target distance divided by your stop distance, and it sets the win rate you must beat. A 2:1 ratio needs 33.33% winners to break even, a 3:1 ratio needs 25.00%. On 50 sessions of ES and NQ, every tested target was reached less often than its ratio required. Measure how often your setup reaches the target before you trust the ratio.
The risk reward ratio compares how far price must travel to pay you with how far it must travel to prove you wrong. It is the first number most traders learn to write in a plan. It is also one of the most misread, because it describes the shape of a bet and says nothing about how often the bet pays.
This guide covers the definition, the calculation in points and dollars, the breakeven win rate behind each ratio, and then a measured test: 1,200 entries on 50 regular sessions of E-mini S&P 500 (ES) and E-mini Nasdaq-100 (NQ) futures, each judged at four target distances, plus a replication on the 34 sessions that followed.
What a Risk Reward Ratio Measures
A risk reward ratio compares two planned distances from your entry price. Risk is the distance to the stop, the price that tells you the trade idea is wrong. Reward is the distance to the target, the price where you plan to take a winner. Divide reward by risk and you have the ratio.
Most traders write it as reward to risk, so a target twice as far as the stop is "2:1" or "2R". Some textbooks write it the other way round, risk to reward, so the same trade becomes "1:2". Both describe the same geometry. Pick one convention and keep it in every note and journal entry, because flipping between them halfway through a review reports a losing set of trades as a winning one.
Three things the ratio is not:
- It is not a win rate. A 3:1 ratio says nothing about whether the target arrives.
- It is not expectancy. Expectancy needs the ratio and the hit rate together.
- It is not a quality score. A 5:1 plan is not better than a 1:1 plan until you know how often each one reaches its target.
The ratio describes planned geometry. Both distances are chosen before the outcome is known, so the number is only as honest as the reasoning behind the stop and the target. A stop placed where the idea is genuinely wrong gives a meaningful ratio. A stop placed wherever makes the math look good gives a meaningless one.
Related lesson: Trading expectancy
How to Calculate a Risk Reward Ratio From Three Prices
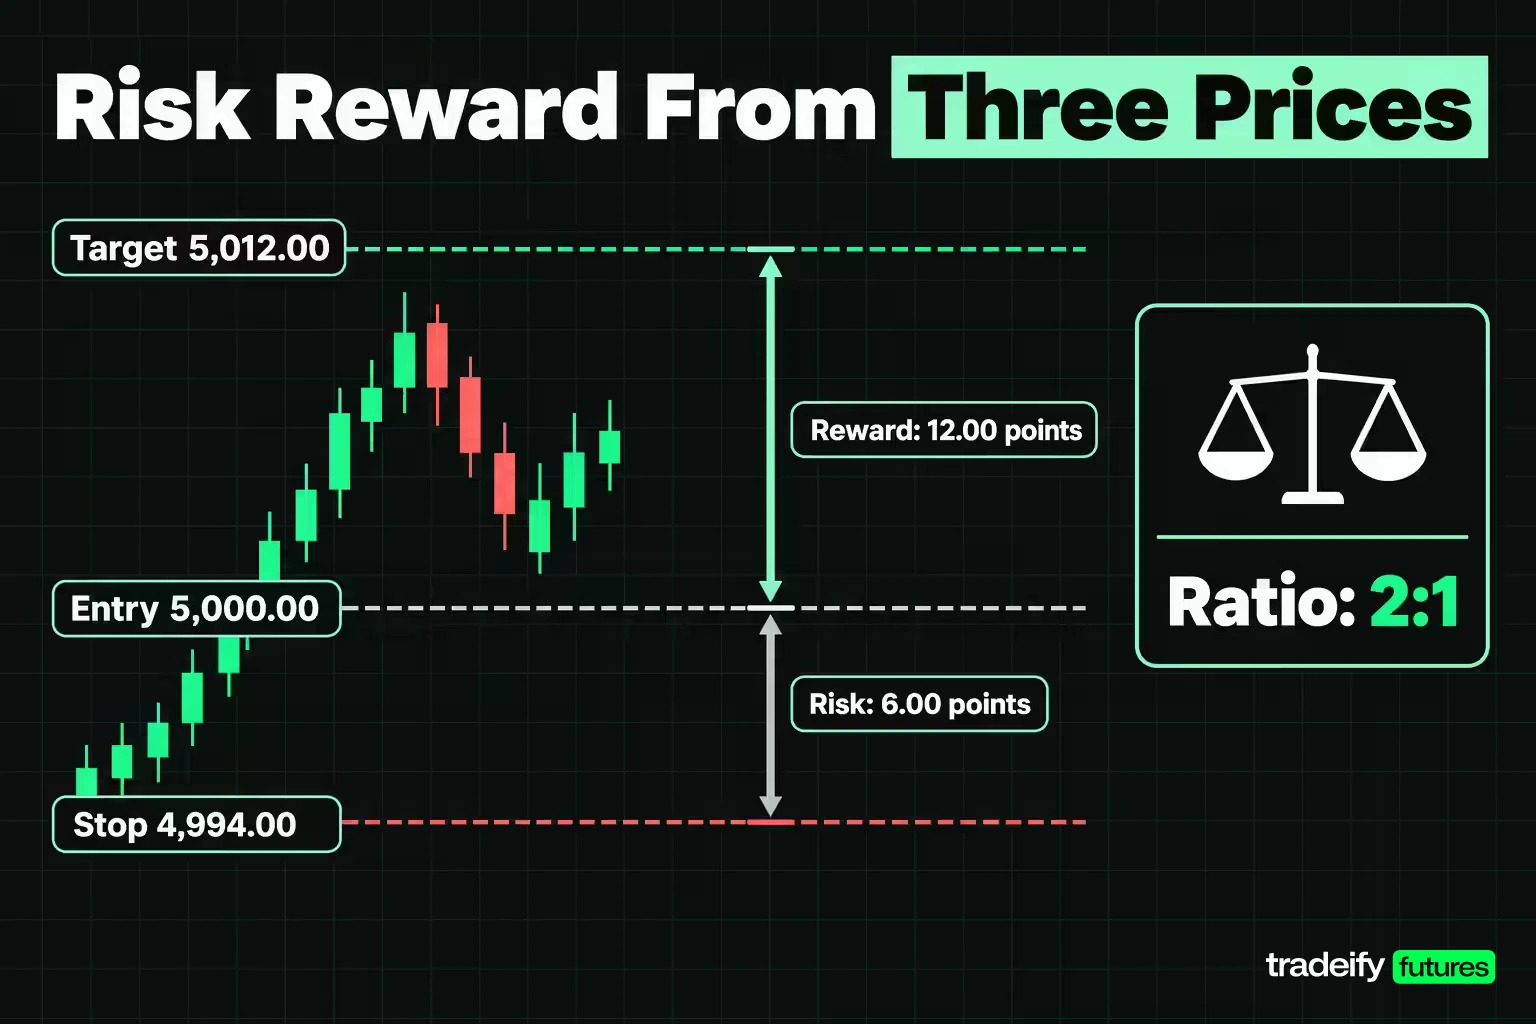
The risk reward ratio comes from three prices: entry, stop and target.
- Risk per unit. On a long, entry minus stop. On a short, stop minus entry. Use the absolute distance.
- Reward per unit. On a long, target minus entry. On a short, entry minus target.
- Ratio. Reward divided by risk.
An illustrative long on ES, using round prices rather than a live quote: entry 5,000.00, stop 4,994.00, target 5,012.00. Risk is 6.00 points, reward is 12.00 points, and the ratio is 2:1.
An illustrative short on NQ: entry 20,000.00, stop 20,040.00, target 19,940.00. Risk is 40.00 points, reward is 60.00 points, and the ratio is 1.5:1.
Converting the ratio to dollars on futures
A point is not a dollar, and the ratio does not tell you what the trade costs. Futures traders convert both distances with the contract's point value, published in CME Group's contract specifications.
| Contract | Dollars per index point | Long ES example, 6.00 risk and 12.00 reward | Short NQ example, 40.00 risk and 60.00 reward |
|---|---|---|---|
| E-mini S&P 500 (ES) | $50 | $300 risk, $600 target | Not applicable |
| Micro E-mini S&P 500 (MES) | $5 | $30 risk, $60 target | Not applicable |
| E-mini Nasdaq-100 (NQ) | $20 | Not applicable | $800 risk, $1,200 target |
| Micro E-mini Nasdaq-100 (MNQ) | $2 | Not applicable | $80 risk, $120 target |
The ratio is identical on the full and micro contract. The dollars are ten times apart. That is why the ratio and the position size are separate decisions: the ratio tells you the shape of the trade, the contract count tells you how much of your account rides on it.
Two habits keep the calculation honest. Set the stop from the chart first and let the ratio fall out of the prices, instead of choosing a ratio and hunting for a stop that fits it. And record the ratio you planned before entry, not the one you remember after the exit.
Related lesson: Stop loss orders and placement
The Breakeven Win Rate Behind Every Ratio
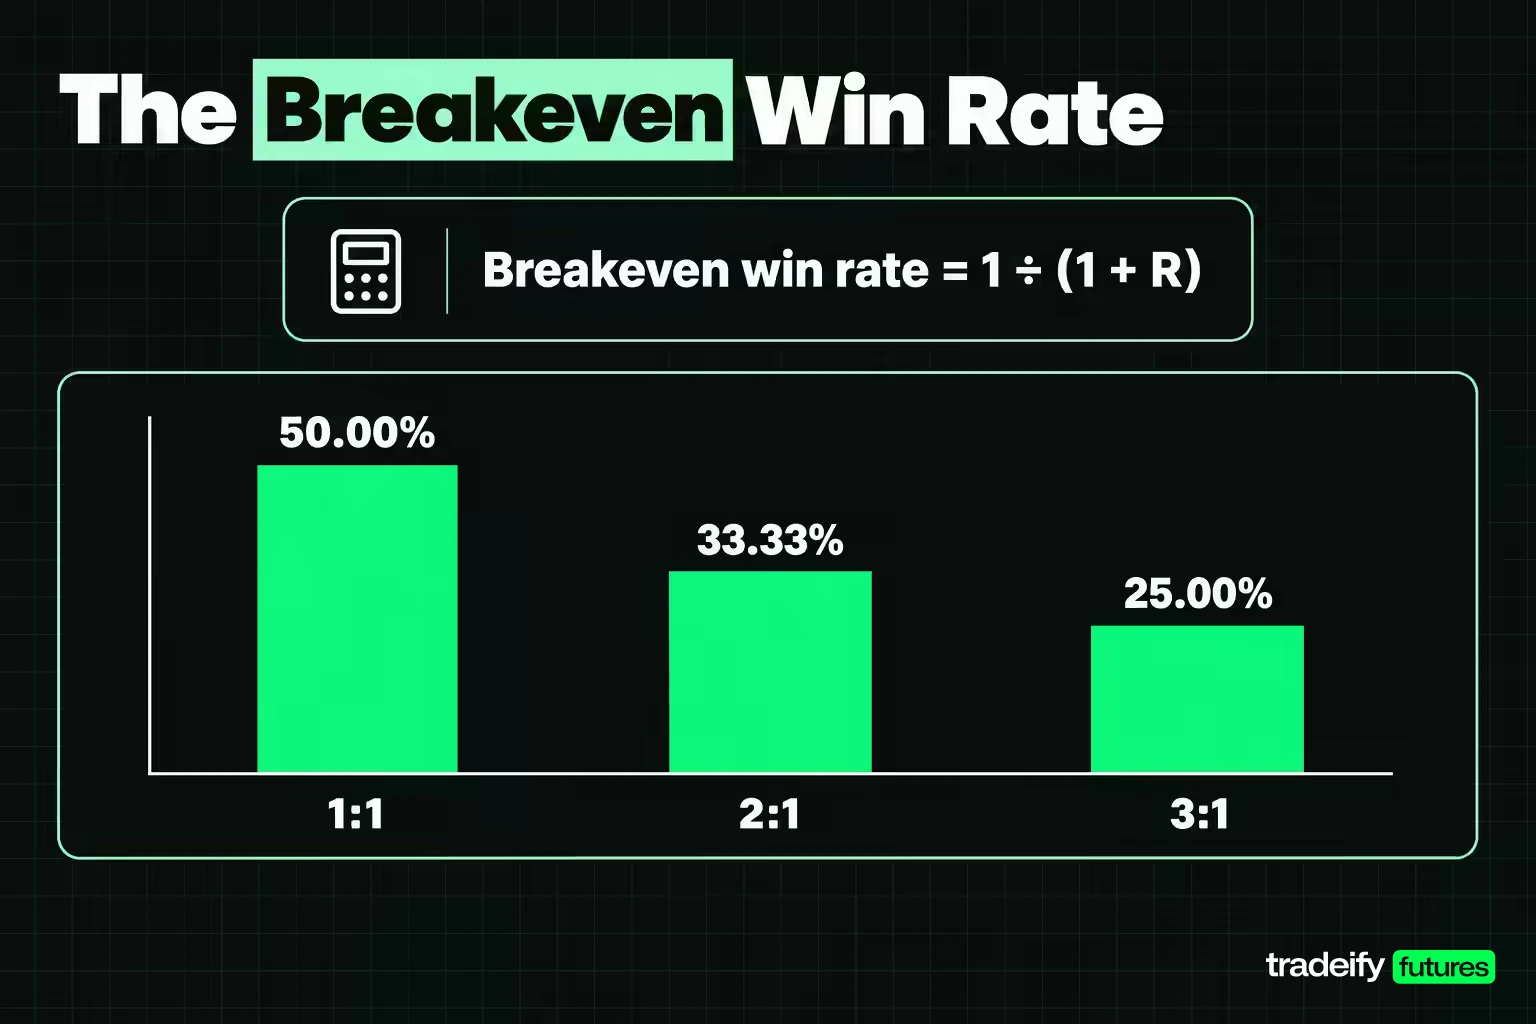
Every risk reward ratio implies one number that matters more than the ratio itself: the win rate at which winners exactly pay for losers. With a reward of R per unit of risk, that breakeven win rate is 1 divided by (1 plus R).
There is no market data in that formula. It is the same for every instrument, account size and timeframe, which makes it the cleanest way to read a ratio.
| Ratio, reward to risk | Breakeven win rate | Losses allowed per 100 trades | Target dollars at $250 of risk | Result per 100 trades at a 35% win rate |
|---|---|---|---|---|
| 0.5:1 | 66.67% | 33.33 | $125.00 | -47.50R |
| 1:1 | 50.00% | 50.00 | $250.00 | -30.00R |
| 1.5:1 | 40.00% | 60.00 | $375.00 | -12.50R |
| 1.67:1 | 37.45% | 62.55 | $417.50 | -6.55R |
| 2:1 | 33.33% | 66.67 | $500.00 | +5.00R |
| 2.5:1 | 28.57% | 71.43 | $625.00 | +22.50R |
| 3:1 | 25.00% | 75.00 | $750.00 | +40.00R |
| 4:1 | 20.00% | 80.00 | $1,000.00 | +75.00R |
| 5:1 | 16.67% | 83.33 | $1,250.00 | +110.00R |
Read the 2:1 row as a bar to clear. If two thirds of entries hit the stop and one third reach the target, the account ends where it started before costs. Anything above that line is profit, anything below is a slow bill.
The last column holds the win rate fixed at 35% to show the same hit rate losing money at 1.5:1 and making money at 2:1. The ratio moves the bar. It does not move the hit rate, and that is the part traders forget.
How trading costs raise the breakeven win rate
Commissions and fees come out of every round turn, winners and losers alike, so they shift the breakeven win rate up. Add the cost to the loss and subtract it from the win:
- An illustrative $5 round turn on a $300 risk unit at 2:1 turns the loss into $305 and the win into $595. The breakeven win rate becomes 305 divided by 900, or 33.89%, against 33.33% before costs. The cost is 1.67% of the risk unit.
- An illustrative $3 round turn on a $30 Micro risk unit at 2:1 turns the loss into $33 and the win into $57. The breakeven win rate becomes 33 divided by 90, or 36.67%.
Small risk units feel cheaper, but costs take a bigger bite from them. Check your own broker or platform fee schedule and run the same arithmetic.
How the Ratio and Win Rate Decide Expectancy
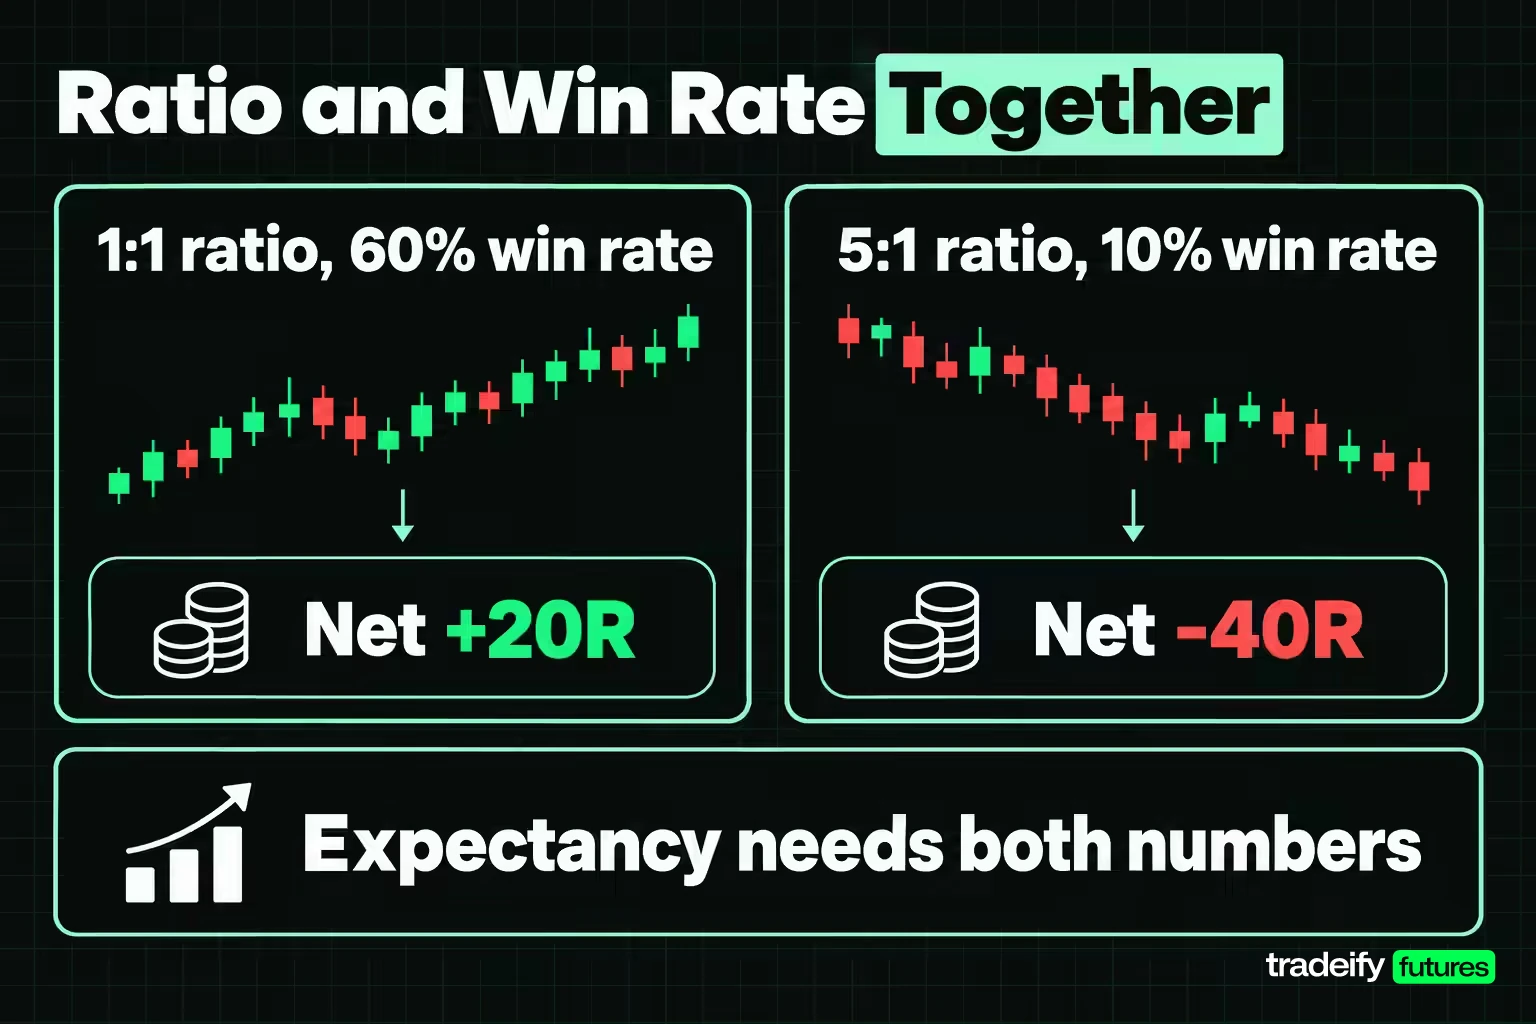
The risk reward ratio and the win rate only mean something together. Expectancy combines them into one figure: the average result per trade, measured in units of risk (R).
Expectancy in R = (win rate × R) minus (loss rate × 1).
Two illustrative plans show why neither number wins on its own:
- A 1:1 ratio with a 60% win rate earns 60R and loses 40R per 100 trades, a net +20R.
- A 5:1 ratio with a 10% win rate earns 50R and loses 90R per 100 trades, a net -40R.
The second plan looks more professional on paper. The first one makes money. The win rate and the ratio pull against each other: pushing the target further away lowers the win rate you need, and it usually lowers the win rate you get as well. Which effect is bigger is a measurement question, not an opinion. You answer it from a log of real or replayed entries, never from the ratio alone.
Related lesson: Win rate versus payoff ratio
The 50 Session Ratio Test on ES and NQ
The 50 session ratio test asks a plain question: when the same entry is judged at four different target distances, how often does each target arrive before the stop, and is that more or less often than the ratio requires?
How the ES and NQ ratio test was built
- Data: front-month E-mini S&P 500 (ES) and E-mini Nasdaq-100 (NQ) 5 minute bars, 50 regular sessions from 8 July 2026 to 16 September 2026.
- Entries: the close of the 5 minute bar at each hour from 10:00 AM to 3:00 PM New York time. A long and a short are opened from the same price, so the index's drift cancels out instead of flattering one direction.
- Risk unit: the high minus the low of that entry bar, so the stop distance reflects how much the market was moving at that moment.
- Targets: 1, 1.5, 2 and 3 times the risk unit, all judged on the same price path.
- Scoring: from the next bar on, the first level touched wins. A bar touching both levels counts as a stop. An entry that reaches neither by the closing bell is unresolved and recorded separately.
- Size: 600 entries per product, 1,200 pooled at each target distance.
There is no signal, filter or market selection in this design. It measures how far price travels relative to a recent bar range, which is exactly what a ratio assumes and almost nobody checks. It is not a strategy test.
What the four target distances delivered
| Target distance, 50 session study (Jul 8 to Sep 16, 2026) | Entries | Target first | Stop first, incl. ties | Neither by the close | Measured reach rate | Breakeven rate | Gap, percentage points | Expectancy per trade |
|---|---|---|---|---|---|---|---|---|
| 1:1 | 1,200 | 590 | 590 | 12 (1.00%) | 49.17% | 50.00% | -0.83 | -0.0067R |
| 1.5:1 | 1,200 | 454 | 704 | 40 (3.33%) | 37.83% | 40.00% | -2.17 | -0.0089R |
| 2:1 | 1,200 | 371 | 754 | 73 (6.08%) | 30.92% | 33.33% | -2.41 | +0.0188R |
| 3:1 | 1,200 | 226 | 809 | 164 (13.67%) | 18.83% | 25.00% | -6.17 | +0.0154R |
Every measured reach rate sits below the rate its own ratio requires. Widening the target lowered the bar, and it lowered the hit rate faster.
In the 50 session study, the 3:1 row is the one the sample clearly supports. A 95% confidence interval around 226 of 1,200 runs from 16.72% to 21.14%, entirely below the 25.00% the ratio needs. At 2:1 the interval, 28.37% to 33.59%, only just reaches the requirement, so the shortfall there is likely but not proven by this sample.
Why the one-to-one ratio row works as a control
With a long and a short opened from the same price and a 1:1 ratio, the long's target is the short's stop. Each resolved pair produces one winner and one loser, so the reach rate is pinned near 50% by design. The small shortfall at 1:1 comes from the eight bars that touched both levels and were scored as stops. The 1:1 row is a check that the scoring works, not evidence about the market.
Realistic expectations from the ES and NQ ratio test
Two lessons carry over to real trading:
- A ratio sets a standard. It does not meet it. Without a setup that reaches the target more often than random entries, a wider ratio does not create an edge.
- The expectancy column is close to zero at every distance. Random entries with ratio-based exits roughly broke even before costs, which is what you would expect if the ratio itself adds nothing. Add costs and every row turns negative.
The 3:1 row also produced about 3.58 stops for every target. Even when a wide ratio is profitable, the losing runs between winners are long, and that is the part a trader has to sit through.
Related lesson: Risk management for traders
Did the Ratio Results Hold on the Next 34 Sessions
A single sample can be a fluke, so the same ratio test was rerun on fresh data: Yahoo Finance's continuous front-month ES and NQ 5 minute series, 34 regular sessions from 17 September 2026 to 4 November 2026. One session, 30 October 2026, was excluded because the 3:00 PM bar carried a bad print. The method is identical, giving 816 entries at each target distance. Entries that never resolve exit at the session's closing price.
| Target distance, replication (Sep 17 to Nov 4, 2026) | Entries | Target first | Stop first | Neither by the close | Measured reach rate | Breakeven rate | Gap, percentage points | Expectancy per trade |
|---|---|---|---|---|---|---|---|---|
| 1:1 | 816 | 404 | 404 | 8 (0.98%) | 49.51% | 50.00% | -0.49 | 0.0000R |
| 1.5:1 | 816 | 310 | 481 | 25 (3.06%) | 37.99% | 40.00% | -2.01 | -0.0119R |
| 2:1 | 816 | 254 | 515 | 47 (5.76%) | 31.13% | 33.33% | -2.21 | +0.0209R |
| 3:1 | 816 | 166 | 552 | 98 (12.01%) | 20.34% | 25.00% | -4.66 | +0.0490R |
The pattern held in the replication. All four reach rates again landed below their breakeven rates, and the gap again grew with the ratio. At 3:1 the interval around 20.34%, 17.72% to 23.24%, again sits below the 25.00% requirement.
Why unresolved ratio trades pushed expectancy positive
The 34 session replication on ES and NQ also explains why expectancy can turn positive while the hit rate falls short. At 3:1 the target was reached too rarely to pay for the stops, yet expectancy came out at +0.0490R. The difference is the 98 entries that never reached either level. 85 of them closed above their entry, at an average of +0.96R, adding +93.99R in total.
Counting only trades that hit a stop or a target, the 3:1 result is -0.0662R. The positive figure comes entirely from time exits at the close. Two things follow:
- The time exit is part of your ratio plan whether you write it down or not. A wide target that does not arrive still ends somewhere.
- The +0.0490R figure has a standard error of 0.0574R, so it is indistinguishable from zero. Neither sample shows a ratio creating an edge on random entries.
Why a Wider Ratio Takes Longer to Pay
A wider risk reward ratio puts the target further away in points and in time. The 50 session study recorded how long each target took and how much the answer moved from one session to the next.
| Target distance, 50 session study timing | Median bars to target | Neither by the close | Session reach-rate range | Session standard deviation, percentage points | Session-product runs with no target, of 100 |
|---|---|---|---|---|---|
| 1:1 | 2 on ES, 2 on NQ | 1.00% | 41.67% to 50.00% | 2.92 on ES, 2.00 on NQ | 0 |
| 1.5:1 | 4 on ES, 5 on NQ | 3.33% | 16.67% to 50.00% | 8.79 on ES, 7.90 on NQ | 0 |
| 2:1 | 6.5 on ES, 7 on NQ | 6.08% | 8.33% to 50.00% | 9.59 on ES, 9.50 on NQ | 0 |
| 3:1 | 10 on ES, 10 on NQ | 13.67% | 0.00% to 41.67% | 10.55 on ES, 11.33 on NQ | 10 |
In the 50 session study, a 3:1 target took a median of 10 five-minute bars, close to an hour of the regular session. The 34 session replication matched closely: 10 bars on ES and 9 on NQ.
That clock matters for any trader whose holding time is bounded by a session close, a lunch break or a platform rule. It matters even more for a trader tempted to widen the stop and keep the target, because that stretches the schedule further.
How session-to-session spread misleads ratio judgments
In this article's 50 session ES and NQ study, at 3:1 single sessions ranged from no targets at all to 41.67% of entries, and 10 of 100 session-product runs produced no target. A trader who judges a ratio on one good week is reading noise, not edge. The replication showed the same thing on a smaller scale: 3 of 68 session-product runs had no 3:1 target.
What happens to one-R winners at a three-to-one ratio
In this article's 34 session ES and NQ replication, of the 404 entries that reached a 1:1 target, 166 went on to reach 3:1. That means 58.91% of trades that were already a full R in profit never made it to the wider target on the same price path. Some came back to the stop, others drifted until the close. A ratio plan that ignores this turns many early winners into losers or scratches.
Related lesson: Trailing stops
What a Ratio Costs in Dollars by Hour on ES and NQ
A risk reward ratio has no units, but positions do. In the 50 session study the stop distance was the range of the entry bar, and that range changed sharply through the day.
| Hour, New York (50 session study) | ES median entry-bar range | ES dollars per contract | ES dollars on Micro | NQ median entry-bar range | NQ dollars per contract | NQ dollars on Micro |
|---|---|---|---|---|---|---|
| 10:00 AM | 9.12 points | $456.25 | $45.60 | 67.12 points | $1,342.50 | $134.24 |
| 11:00 AM | 7.00 points | $350.00 | $35.00 | 44.25 points | $885.00 | $88.50 |
| 12:00 PM | 5.62 points | $281.25 | $28.10 | 32.12 points | $642.50 | $64.24 |
| 1:00 PM | 5.38 points | $268.75 | $26.90 | 31.12 points | $622.50 | $62.24 |
| 2:00 PM | 4.75 points | $237.50 | $23.75 | 29.50 points | $590.00 | $59.00 |
| 3:00 PM | 4.50 points | $225.00 | $22.50 | 29.38 points | $587.50 | $58.76 |
The ES entry bar at 10:00 AM was 2.03 times as wide as at 3:00 PM. A 2:1 target at 10:00 AM is a $912.50 move on one ES contract, against $450.00 at 3:00 PM. The replication found the same shape: ES 9.12 points at 10:00 AM and 4.62 points at 3:00 PM, NQ 59.38 points and 25.12 points.
Position sizing with a ratio-based stop
The ratio stays the same at every hour. The dollars do not. If your risk per trade is fixed in dollars, a stop that doubles in points means half the contracts. A trader who keeps the same contract count all day is risking roughly twice as much in the first hour as in the last, while believing the plan is constant because the ratio is.
Related lesson: Position sizing
One Session of Two-to-One Ratio Trades on ES
A single session shows what a ratio plan feels like trade by trade. These are all twelve ES entries from 17 September 2026, the first session of the replication, judged at a 2:1 target on one contract before costs.
| Time, New York | Side | Entry | Stop | Target at 2:1 | Risk, points | Result | Bars to exit | Dollars on one ES |
|---|---|---|---|---|---|---|---|---|
| 10:00 AM | Long | 7686.75 | 7676.75 | 7706.75 | 10.00 | Target | 24 | +$1,000.00 |
| 10:00 AM | Short | 7686.75 | 7696.75 | 7666.75 | 10.00 | Stop | 4 | -$500.00 |
| 11:00 AM | Long | 7686.25 | 7682.00 | 7694.75 | 4.25 | Target | 3 | +$425.00 |
| 11:00 AM | Short | 7686.25 | 7690.50 | 7677.75 | 4.25 | Stop | 2 | -$212.50 |
| 12:00 PM | Long | 7704.50 | 7701.50 | 7710.50 | 3.00 | Stop | 1 | -$150.00 |
| 12:00 PM | Short | 7704.50 | 7707.50 | 7698.50 | 3.00 | Stop | 5 | -$150.00 |
| 1:00 PM | Long | 7707.75 | 7703.25 | 7716.75 | 4.50 | Stop | 2 | -$225.00 |
| 1:00 PM | Short | 7707.75 | 7712.25 | 7698.75 | 4.50 | Stop | 34 | -$225.00 |
| 2:00 PM | Long | 7709.00 | 7705.75 | 7715.50 | 3.25 | Stop | 1 | -$162.50 |
| 2:00 PM | Short | 7709.00 | 7712.25 | 7702.50 | 3.25 | Stop | 22 | -$162.50 |
| 3:00 PM | Long | 7709.75 | 7705.25 | 7718.75 | 4.50 | Stop | 11 | -$225.00 |
| 3:00 PM | Short | 7709.75 | 7714.25 | 7700.75 | 4.50 | Stop | 10 | -$225.00 |
Two of twelve entries reached the target, a 16.67% hit rate against the 33.33% a 2:1 ratio needs. The two winners made $1,425.00, the ten losers cost $2,237.50, and the session finished -$812.50 on one contract.
Notice the shape of the session. The best winner came from the widest stop, and the narrow midday bars produced quick stop-outs because a 3.00 point range left almost no room. This session was a poor one for a 2:1 plan, while the full sample's 2:1 reach rate was 31.13%. One session tells you almost nothing about a ratio. A few hundred trades start to.
Using the Risk Reward Ratio in Stocks, Forex and Futures
The risk reward ratio works the same way in every market. Only the conversion from price distance to dollars changes.
- Stocks. An illustrative buy of 100 shares at $50.00 with a stop at $48.00 and a target at $55.00 risks $2.00 to make $5.00 per share, a 2.5:1 ratio. On 100 shares that is $200 at risk for a $500 target.
- Currency futures. On the CME Euro FX contract (6E), one tick of 0.00005 is worth $6.25. An illustrative long at 1.10000 with a stop at 1.09800 and a target at 1.10400 risks 40 ticks ($250) to make 80 ticks ($500), a 2:1 ratio.
- Index futures. On ES, each point is $50, so a 6.00 point stop is $300 and a 12.00 point target is $600, again 2:1.
Four practical uses of the ratio
Traders use the ratio in four main ways:
- Screening setups. If the nearest logical target is closer than the stop, the trade may not be worth taking at all.
- Sizing positions. The stop distance from the ratio calculation sets how many shares or contracts fit a fixed dollar risk.
- Setting orders. The stop and target prices become a bracket placed with the entry.
- Reviewing results. Comparing planned ratios with realised ratios shows whether exits are following the plan.
Related lesson: Maximum risk per trade
What Makes a Good Risk Reward Ratio
A good risk reward ratio is one your setup reaches more often than its breakeven win rate. No ratio is good on its own. The common advice to use at least 2:1 or 3:1 is a reasonable starting point for many setups, but only because those ratios leave room for a modest hit rate, not because the number itself creates profit.
How style changes the answer:
- Scalping and very short holds tend to run near 1:1 or lower and depend on high hit rates. Costs matter most here because the target is small.
- Intraday trend and breakout trades often plan 1.5:1 to 3:1, which means a hit rate that has to clear somewhere between 40% and 25%.
- Longer holds and trend-following can carry 3:1 or more with low hit rates and long losing runs.
This article's 50 session ES and NQ study is a useful reality check. On random entries, no ratio from 1:1 to 3:1 cleared its own breakeven rate. A ratio becomes good when your entry selection lifts the reach rate above that line, and the only way to know is to measure it.
Risk reward ratios in day trading
Day trading puts a hard ceiling on how far a target can be. A trade that must close by the end of the session has a limited window. In this article's 50 session ES and NQ study (5 minute bars, July to September 2026), a 3:1 target needed a median of about an hour, and 13.67% of entries never reached either level before the close. That is a good reason to test 1.5:1 and 2:1 beside 3:1 on your own setups instead of assuming the wider target wins. Whatever you choose, plan the time exit along with the target.
The temptation in day trading runs the other way too. After two quick stop-outs, a trader often takes the next winner at half the planned distance just to feel a green trade. That one decision quietly turns a 2:1 plan into a 1:1 plan with a 2:1 loss rate.
Benefits and Limitations of the Ratio
The risk reward ratio is useful because it is simple, and limited for the same reason.
Benefits:
- It forces you to define the stop and target before entry.
- It converts directly into a breakeven win rate.
- It makes trades of different sizes comparable in R.
- It supports position sizing and bracket orders.
Limitations:
- It ignores probability. The ratio says nothing about how often the target arrives.
- It ignores time. A wider target takes longer and may never arrive in the session.
- It is easy to manipulate. Moving a stop or target changes the number without changing the trade's real odds.
- It ignores costs unless you add them in.
Common ways the ratio breaks in practice
| What the trader does | Why it looks reasonable | What it does to the ratio | The tell | The check |
|---|---|---|---|---|
| Picks the ratio first, then finds a stop | A 1:3 plan reads as discipline | The stop stops being a market fact | Stops sit at round numbers with no structure | Set the stop from the chart, then read the ratio off the prices |
| Widens the target to improve the ratio | A bigger number looks like a better trade | The breakeven rate falls and the chance of arriving falls too | Most winners exit before the recorded target | Compare measured reach at the new distance with its breakeven rate |
| Rounds a fractional ratio up | A planned 1.9 becomes 2:1 in the notes | The journal shows 33.33% needed when the trade needed 34.48% | Planned ratios cluster on tidy numbers | Record the realised ratio from the actual exit prices |
| Treats unresolved trades as wins or losses | Every trade must be one or the other | At 3:1, 13.67% of study entries fell in neither group | Exits match the session closing price | Give time exits their own label |
| Moves the stop further away mid-trade | The idea still looks valid | The risk used to size the position no longer describes it | Losses larger than the planned risk unit | Treat any stop move as a new decision and record the new risk |
Related lesson: Take profit orders and targets
Building the Ratio Into a Trading Plan
A risk reward ratio only protects you if the plan behind it survives the trade. Use this six-step routine before each trade and again in your monthly review.
- Write the stop price from the chart structure and the entry you expect. Do not choose the ratio first.
- Find the nearest level where a winner would reasonably stop, and measure that distance as the reward.
- Compute the ratio and look up its breakeven win rate.
- Ask whether this setup, on this instrument, at this time of day, reaches that target often enough. If you have no measurement, you have an assumption.
- Convert both distances to dollars and size the position so the stop costs what you intend.
- Log the planned ratio, the realised ratio and the exit type (target, stop or time exit) on every trade. After 30 trades, compare planned with realised.
Automating the ratio with bracket orders
The simplest way to commit to a ratio is to place the stop and target as a bracket at entry. An OCO (one-cancels-other) pair, as CME Group's definitions describe it, cancels the remaining order when either fills, so the plan executes without a second decision. Many platforms let you save brackets with fixed distances, and some calculators work out the ratio and position size from the three prices.
Keeping the commitment once the trade is live
Most ratio plans fail after entry, not before. It rarely feels like breaking a rule in the moment; it feels like reading the market. The common breaks are moving the stop away to avoid a loss, grabbing a small profit because the trade went quiet, and pushing the target further after a fast move. Each one changes the ratio you are actually trading. If you change an order, log it as a new decision with its new risk, and review those changes separately.
On our accounts every position has to be closed by 4:45 PM ET on regular trading days, and anything still open is closed automatically. That makes the time exit part of every ratio plan, so a wide target late in the session needs a decision before the close. On Tradovate connections, ATM strategies place the stop and target as an OCO bracket as soon as the entry fills, though brackets are not supported while using Group Trading.
Risk Reward Ratio FAQ
What does a risk ratio of 1.2 mean?
A 1.2 ratio means the target is 1.2 times as far from entry as the stop. A 10 point stop pairs with a 12 point target, which on ES is $500 at risk for a $600 target. It needs a 45.45% win rate to break even before costs.
Is the risk reward ratio the same as expectancy?
No. The ratio is planned geometry and uses no outcomes. Expectancy combines the ratio with the win rate, so it is the number that tells you whether a plan makes money.
Does a higher risk reward ratio always make more money?
No. A wider target lowers the win rate you need but also lowers the win rate you get. In this article's 50 session ES and NQ study, the reach rate fell faster than the requirement at every step from 1:1 to 3:1.
How much money do day traders with $100,000 accounts make per day?
There is no reliable average. Daily results depend on risk per trade, ratio, win rate, trade count and costs, and many day traders lose money. A useful exercise is to compute your own expectancy in R from a journal of at least a few hundred trades before thinking in daily dollars.
Why do so many options traders lose money?
Options traders lose for the usual reasons, poor risk reward and overtrading, plus time decay working against option buyers. The often-quoted "90%" figure has no single verified source. The same discipline applies: a defined maximum loss, a planned reward and a measured win rate.
Measuring Your Own Risk Reward Ratio
The most useful next step is small. Pull your last 30 to 50 trades, write down the planned stop and target for each, and sort them by ratio. For each ratio you use, count how often the target arrived first, how often the stop did, and how often you exited on time or by hand. Compare the reach rate with the breakeven win rate for that ratio.
If the reach rate sits below the breakeven rate, the ratio is not the problem to fix. The entry is. If it sits above, you have a measured reason to keep the ratio, and a baseline to test any change against.
Trading futures and other leveraged products carries a substantial risk of loss, and losses can exceed what you expect when markets gap or move fast. No risk reward ratio or target method guarantees a profit. The studies in this article measure price movement on two index futures over limited periods; they are not strategy tests, performance records or predictions. Simulated and funded evaluation accounts are simulated and do not reflect live fills. This article is educational and is not investment advice.


