



TL;DR: Volume profile shows how much volume traded at each price, so the levels to read are the POC, value area and volume nodes. Those levels depend on settings: across 47 ES sessions, switching 5 minute for 30 minute source bars moved the POC on 38. Use the profile as context with a defined stop, not as an entry signal.
You mark a point of control from a chart someone shared, price comes back to it, and it slices straight through. Sometimes the level failed. Sometimes it was never the same level on your chart in the first place.
A volume profile is a sideways histogram that shows how many contracts traded at each price over a window you choose. It answers where the market did business, not when. This guide covers how a volume profile is built, how to read the point of control, value area and volume nodes, how shapes and profile types differ, and which strategies use it. It also tests what most guides skip: how far your own settings move the levels you are about to trade against.
What a Volume Profile Shows
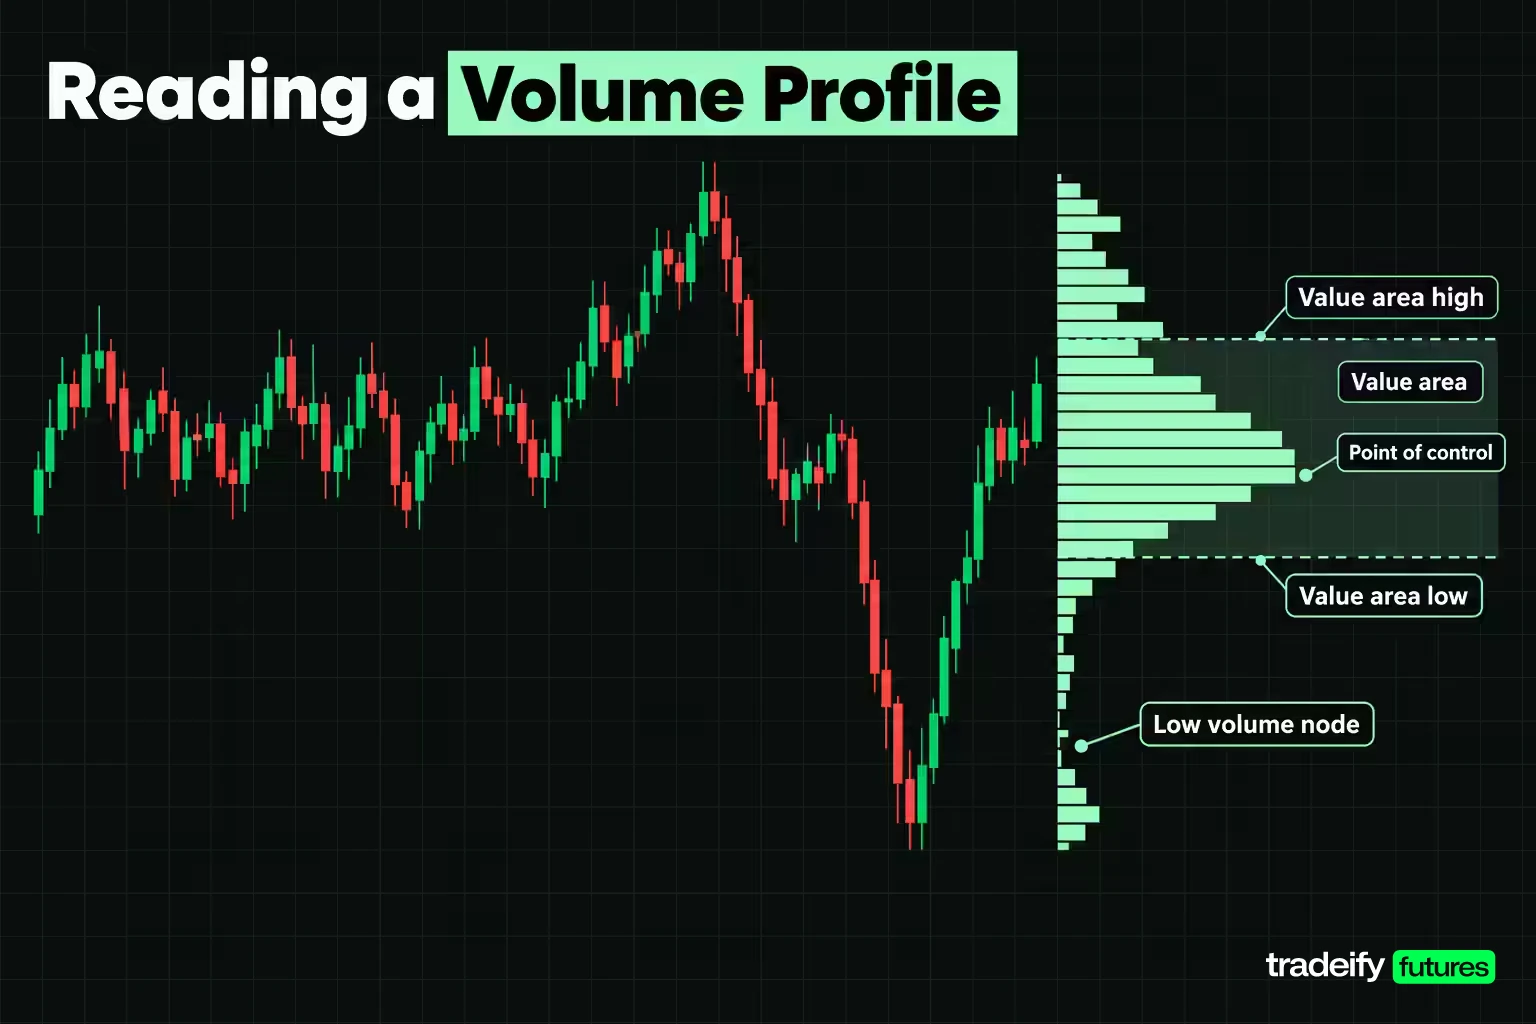
A volume profile turns the volume axis sideways. A normal volume bar gives one number per time bucket, such as how many contracts traded in a 5 minute candle, and says nothing about where inside that candle the business happened. A volume profile files the same volume into price rows, so each horizontal bar shows how much traded at that price during the whole window.
Related lesson: What is volume
That difference matters when price stalls. A volume bar cannot tell you whether 7,700 was heavily traded and defended or barely traded and passed through. The profile can, because a fat row means the market spent volume there and a thin row means it did not.
TradingView describes volume profile as an indicator that displays trading activity over a specified time period at specified price levels, plotted as a histogram. The levels traders read from it are:
- Point of control (POC): the price row with the highest traded volume in the window.
- Value area (VA): the band of rows around the POC that holds a set share of the window's volume, typically 70%.
- Value area high and low (VAH and VAL): the top and bottom of that band.
- High volume nodes (HVNs): fat rows where price was accepted.
- Low volume nodes (LVNs): thin rows where price moved through quickly.
Each of those is a description of what already happened. TradingView calls volume profile a reactive tool for that reason: it shows where activity took place rather than predicting the next move.
How a Volume Profile Is Built
A volume profile is built from smaller bars inside the window. TradingView's documentation gives the example of a daily session profile that loads all the 1-minute bars traded in that session, checks the prices each bar covered, and adds its volume to the histogram. Three choices in that process change the output.
Which bars feed the volume profile
Source bar size is the lower timeframe that feeds a volume profile. TradingView's Visible Range and Fixed Range profiles step through 1, 5, 15, 30, 60, 240 minute and daily bars to stay under 5,000 bars, and on futures charts they use the timeframe one step lower than the chart's own timeframe. So the same futures contract can produce a different profile on a 30 minute chart than on a 5 minute chart, because the indicator is fed different bars.
A bar only reports its open, high, low, close and volume. When a 30 minute bar spans 10 points, the platform has to spread its volume across the rows it touched, and it cannot know which prices inside the bar were busiest. Smaller source bars give the profile more detail to work with.
Row height
Row height is how tall each price row of a volume profile is, also called ticks per row, ticks per level or price per row. TradingView offers either a fixed number of rows, with ticks per row calculated from the range, or a fixed number of ticks per row. NinjaTrader's Order Flow Volume Profile defaults to 1 tick per level, and Quantower's custom profile defaults to a custom step of 1 tick. A row height of 1 tick on ES is 0.25 points; a row height of 4 points merges 16 ticks into one row.
How a volume profile splits up and down volume
Up and down volume is how a volume profile colours each row into buying and selling. Bar-based profiles usually do not know which trades were buyers lifting the offer. TradingView uses up and down volume instead: if a source bar closes at or above its open, its volume counts as up volume, otherwise as down volume. That records where volume printed, not what anyone intended, so treat the colour split as a rough guide.
Point of Control in a Volume Profile
The point of control is the price row where the most volume traded in the window. Traders often call it fair value for that window, because it is the price both sides were most willing to transact at.
The POC is a reference, not a wall. On the 4 November 2026 ES session (the full CME trading day from 6:00 PM ET on 3 November to 5:00 PM ET on 4 November), 2,327,707 contracts traded in Yahoo Finance's continuous front-month bars. Profiled at 4 point rows from 5 minute bars, the POC was the 7,728.00 to 7,732.00 row with 238,214 contracts, 10.23% of the session. At 1 tick rows the POC held 0.74%. A level that carries one contract in every hundred is precise, and it is also a thin reason to expect price to stop there.
Many platforms can also draw a developing POC, which shows where the POC sat at each point during the session. Sierra Chart's Volume Value Area Lines study, for example, has a Draw Developing Value Area Lines input that plots the current value area and POC bar by bar. A developing POC that keeps migrating higher during the day tells you value is being built at higher prices. One that flips back and forth tells you the session is rotating with no agreement yet.
How traders use the POC:
- As a magnet in balance. When price is inside a balanced range, it often rotates back to the POC.
- As a retest level in trend. After value migrates, the prior POC is a common place for a pullback to pause.
- As a target. A trade taken at the value area edge often uses the POC as its first target.
Each use needs confirmation from price, because the POC is just the busiest row. The temptation is to fade every touch of it. Price reaching the POC is an observation; price holding there with selling or buying drying up is the confirmation, and those are two different moments.
Value Area and Market Acceptance
The value area is the band of price rows around the POC that holds a chosen share of the window's volume. TradingView, Quantower and Sierra Chart default to 70%. NinjaTrader's Order Flow Volume Profile defaults to 68%, which its help guide describes as a 1 standard deviation range. Both are settings, not laws.
Traders read the value area through acceptance and rejection:
- Acceptance: price trades outside the prior value area and keeps building volume there. The market is agreeing to a new price.
- Rejection: price probes outside the value area, fails to build volume, and returns inside. The market refused the new price.
The test is time and volume, not a single print. A spike through VAH that reverses inside one bar is a probe. Several bars closing above VAH with volume building is acceptance.
How the value area is calculated
TradingView publishes its procedure. Multiply total volume by the value area percentage to get the target. Start at the POC. Compare the next row above with the next row below, and add the larger one. If adding the chosen row would exceed the target, stop. Ties go to the row closer to the POC, then to the row above.
Read literally, that procedure stops before the target, so a 70% value area holds a little under 70% of volume. Some tools include the row that crosses the target instead. Across the 47 ES sessions in this guide's settings audit, the literal stop held a median 69.35% of session volume and the crossing version a median 70.58%. That gap explains why two platforms can disagree by a row on one edge.
Building the 4 November 2026 ES value area by hand
Here is the value area built row by row so every number can be checked on a calculator. The session total was 2,327,707 contracts, so the 70% target was 1,629,395. Rows are 4 points tall, from 5 minute bars, with each bar's volume spread evenly across every tick price from its low to its high.
| Step | ES price row | Side added | Row volume | Share of session | Running total | Share of 70% target |
|---|---|---|---|---|---|---|
| 0 | 7,728.00 to 7,732.00 | POC | 238,214 | 10.23% | 238,214 | 14.62% |
| 1 | 7,732.00 to 7,736.00 | Above | 228,820 | 9.83% | 467,034 | 28.66% |
| 2 | 7,724.00 to 7,728.00 | Below | 204,297 | 8.78% | 671,331 | 41.20% |
| 3 | 7,736.00 to 7,740.00 | Above | 154,181 | 6.62% | 825,512 | 50.66% |
| 4 | 7,720.00 to 7,724.00 | Below | 124,909 | 5.37% | 950,421 | 58.33% |
| 5 | 7,716.00 to 7,720.00 | Below | 152,738 | 6.56% | 1,103,159 | 67.70% |
| 6 | 7,712.00 to 7,716.00 | Below | 148,576 | 6.38% | 1,251,735 | 76.82% |
| 7 | 7,708.00 to 7,712.00 | Below | 93,980 | 4.04% | 1,345,715 | 82.59% |
| 8 | 7,740.00 to 7,744.00 | Above | 70,803 | 3.04% | 1,416,518 | 86.94% |
| 9 | 7,704.00 to 7,708.00 | Below | 65,640 | 2.82% | 1,482,157 | 90.96% |
| 10 | 7,700.00 to 7,704.00 | Below | 37,816 | 1.62% | 1,519,974 | 93.28% |
| 11 | 7,696.00 to 7,700.00 | Below | 41,081 | 1.76% | 1,561,055 | 95.81% |
| 12 | 7,692.00 to 7,696.00 | Below | 38,463 | 1.65% | 1,599,518 | 98.17% |
After step 12 the next candidates were 9,654 contracts above (7,744.00 to 7,748.00) and 39,539 below (7,688.00 to 7,692.00). The larger row would have taken the total to 1,639,057, past the target, so the procedure stops. The value area is 7,692.00 to 7,744.00, holding 68.72% of the session's volume across 13 of 65 rows.
Two lessons sit in that table. The value area edge is where a running total ran out, not a line where volume suddenly stops. And the band would move if you changed the percentage, the row height or the source bars, even though the session itself did not change.
High and Low Volume Nodes
High and low volume nodes describe the bumps and valleys inside a volume profile. A high volume node is a peak where the market traded heavily and spent time; TradingView describes HVNs as consolidation zones and says price returning to one often slows down and moves sideways. A low volume node is a valley where little traded, usually because price moved through quickly during a breakout or breakdown; TradingView says price approaching an LVN is more likely to either move through fast or reject quickly.
How to read them in practice:
- HVN ahead of price: expect slower, two-way trade. Targets placed beyond a big HVN often take longer to reach.
- LVN ahead of price: expect a quick move through or a sharp rejection. LVNs are where breakouts tend to travel fastest.
- LVN between two HVNs: this is the classic double distribution. Price often moves quickly from one node to the other once it leaves one.
What confirms the reading is how price behaves when it arrives. If price reaches an LVN and starts building volume there instead of moving through, the node is being filled in and the "fast move" reading is invalidated.
On the 4 November 2026 ES profile, the overnight selloff to 7,490.00 left a long, thin tail: only 12.95% of the session's volume traded below 7,600. That entire tail is a low volume area, and the speed of the rally back up through it later in the session is what thin volume suggests can happen.
Reading Volume Profile Shapes
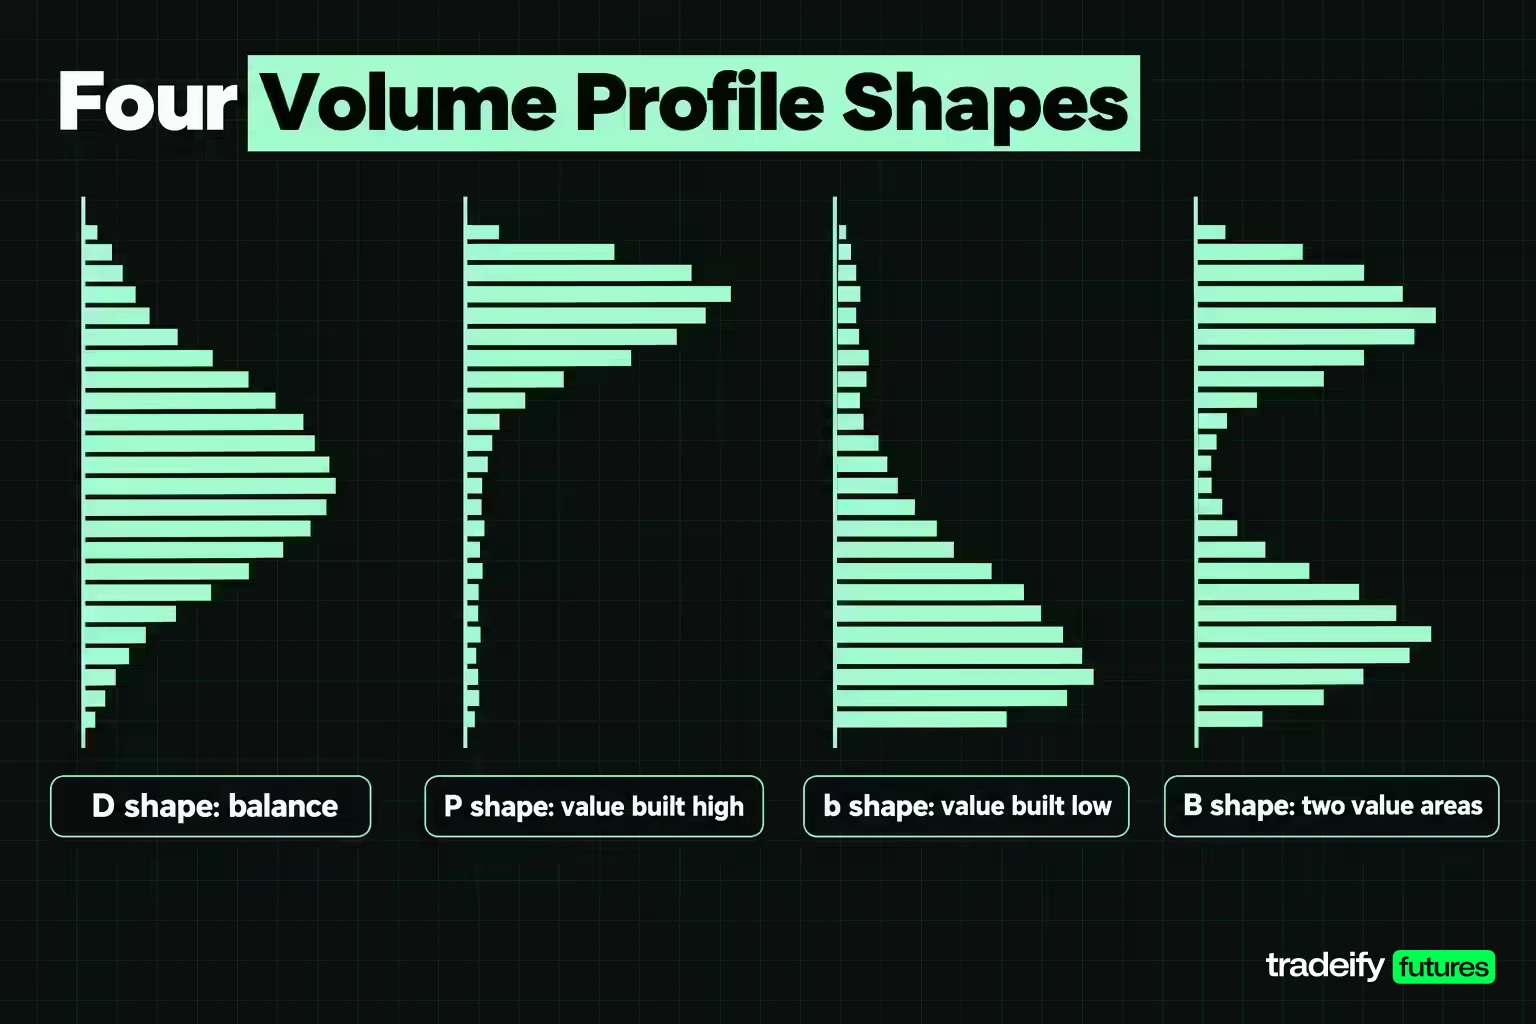
The shape of a volume profile summarises who controlled the window. Traders use letters for the four common shapes:
| Volume profile shape | What it looks like | Common reading | What would change it |
|---|---|---|---|
| D shape | One fat node in the middle, thinner tails on both ends | Balance. Two-way trade around a fair price | A sustained move away from the node with volume building outside it |
| P shape | Fat node near the top, thin tail below | Value built at higher prices after a drop or short covering | Price falling back into the thin tail and building volume there |
| b shape | Fat node near the bottom, thin tail above | Value built at lower prices after a rally or long liquidation | Price returning into the thin upper tail and holding |
| B shape (double distribution) | Two fat nodes with an LVN between them | The market moved from one value area to another | A third node forming, or the LVN filling in |
The 4 November 2026 ES session is a clear P shape. The full range ran from 7,490.00 to 7,746.25, a 256.25 point day, yet the value area sat at 7,692.00 to 7,744.00, in the top 52 points of that range. The market sold off overnight, found no acceptance in the lows, and built its value near the highs.
Shapes are descriptions of the window just finished. A P shape does not guarantee the next session goes higher. It tells you where the market agreed on value, which is useful when deciding which levels to watch next.
Related lesson: Market profile
Balanced and Trending Markets on a Volume Profile
A volume profile helps separate a balanced market from a trending one by comparing value areas across sessions.
- Balance: value areas overlap from one session to the next and the POC stays in roughly the same place. Price rotates between the edges. Fading the edges back toward the POC is the usual approach.
- Trend: value areas migrate. Each session's value area sits higher (or lower) than the last, often with little overlap. Fading edges in that condition means trading against the move.
A practical check is where the next session opens. In this guide's own calculation on Yahoo Finance ES and NQ futures data (45 back-to-back full sessions, August to November 2026), the open landed inside the prior session's value area in 33 of 45 back-to-back pairs, and NQ did so in 29 of 45. Opening inside value tells you the market starts in balance relative to yesterday. Opening outside raises the question that matters: will price be accepted out there, or pulled back in?
The answer comes from the first hours, not the first tick. If price opens above the prior VAH and holds above it with volume building, value is migrating higher. If it drifts back inside and stays, the market has rejected the new prices and balance is likely.
Related lesson: Multiple timeframe analysis
Volume Profile Support and Resistance
Volume profile turns past volume into price levels you can plan around. The usual roles:
- HVNs and the POC act as support from above and resistance from below, because the market traded heavily there and many positions were opened at those prices.
- VAH and VAL act as the edges of fair value. Price often reacts at them on the first test.
- LVNs act less like walls and more like trapdoors: price tends to move through them or reject them fast.
The same row can switch roles. A node above price behaves like resistance until price is accepted through it; after that, the same node often behaves like support on a pullback.
This guide's own calculation on Yahoo Finance ES and NQ futures data (45 back-to-back full sessions, August to November 2026) also says not to treat these levels as fixed barriers. In that sample, the next session traded through the prior session's POC in 38 of 45 ES pairs (84.4%) and 37 of 45 NQ pairs (82.2%). The median distance from the next open to the prior POC was 6.75 ES points and 63.5 NQ points. In plain terms: the prior POC usually gets visited, which makes it a reasonable place for a pullback to pause and a poor reason to assume price will stop.
Related lesson: Support and resistance
Volume Profile Types by Range
The window you profile decides what question the volume profile answers. Mixing levels from different windows is a common source of a level that keeps failing.
| Volume profile type | Window | Best for | Watch out for |
|---|---|---|---|
| Session | One trading session, repeated for each session | Daily POC and value area, balance versus trend | Whether the session is the full 23 hour day or regular hours only |
| Visible range | Whatever bars are on screen | Quick context on the current view | Levels change every time you scroll or zoom |
| Fixed range | A start and end you choose | Profiling one move, one range or one week | The result depends entirely on where you anchor it |
| Composite | Many sessions merged into one profile | Longer-term HVNs and LVNs | Older volume can dominate current structure |
| Developing | The current window, updated bar by bar | Watching where value is being built today | It is unfinished until the window closes |
On TradingView these appear as the Session Volume Profile (and Session Volume Profile HD, which adjusts detail as you zoom), Visible Range Volume Profile and Fixed Range Volume Profile. NinjaTrader's Order Flow Volume Profile offers Session, Bars and Composite periods. Session choice matters most on futures: a full CME trading day from 6:00 PM ET includes the overnight trade, while a regular-hours profile covers only 9:30 AM to 4:00 PM ET, and the two can give very different value areas on the same date.
Volume Profile Settings Audit
This is the test most volume profile guides never run. Hold the data fixed, change only the settings that build the profile, and measure how far the levels move. If two traders can draw different POCs from the same tape, the settings belong in the trade plan.
Method. E-mini S&P 500 (ES) and E-mini Nasdaq-100 (NQ) continuous front-month bars from Yahoo Finance, 47 complete CME trading days (6:00 PM to 5:00 PM ET) from 28 August to 4 November 2026. Each profile spreads every source bar's volume evenly across each tick price between its low and high, files it into rows, and builds a 70% value area with TradingView's published procedure. Row height was 1 point on ES and 5 points on NQ unless stated.
How source bar size moves the volume profile
Session volume was identical at 5 minute and 30 minute bars on every day, because both are aggregations of the same trades. The levels still moved.
| Market | Sessions | POC moved, 5 min vs 30 min bars | Median POC shift | Largest POC shift | VAL moved | VAH moved |
|---|---|---|---|---|---|---|
| ES (1 point rows) | 47 | 38 (80.9%) | 2.0 points | 6.0 points | 30 | 29 |
| NQ (5 point rows) | 47 | 40 (85.1%) | 10.0 points | 100.0 points | 26 | 33 |
Most ES shifts were a point or two, which is noise for a level you plan around. The tail is what matters. On 27 October 2026 the ES POC was 7,763.00 from 5 minute bars and 7,757.00 from 30 minute bars, 6 points apart on identical volume of 1,508,505 contracts. On NQ the worst case was 21 September 2026, when the POC sat at 30,680 from 5 minute bars and 30,780 from 30 minute bars, 100 points apart on 525,149 contracts. A two-node session can flip its POC from one node to the other when coarser bars smear the volume.
How row height moves the volume profile
Row height changes the character of the POC more than its location, until the rows get coarse. Here is the 27 October 2026 ES session profiled from 5 minute bars at six row heights:
| Row height | Rows | POC row | POC volume | POC share of session | Value area | Value area share of session |
|---|---|---|---|---|---|---|
| 0.25 pt | 293 | 7,763.75 to 7,764.00 | 16,937 | 1.12% | 7,734.25 to 7,773.00 | 69.79% |
| 0.50 pt | 147 | 7,763.50 to 7,764.00 | 33,297 | 2.21% | 7,734.50 to 7,772.50 | 69.13% |
| 1.00 pt | 74 | 7,763.00 to 7,764.00 | 64,998 | 4.31% | 7,735.00 to 7,773.00 | 68.28% |
| 2.00 pt | 38 | 7,762.00 to 7,764.00 | 118,599 | 7.86% | 7,734.00 to 7,772.00 | 69.82% |
| 4.00 pt | 20 | 7,756.00 to 7,760.00 | 218,001 | 14.45% | 7,736.00 to 7,772.00 | 65.72% |
| 8.00 pt | 10 | 7,752.00 to 7,760.00 | 384,422 | 25.48% | 7,736.00 to 7,768.00 | 61.44% |
From 1 tick up to 2 point rows, the POC stayed at roughly 7,763 to 7,764. At 4 points it jumped to the 7,756.00 to 7,760.00 row, because merging rows let a cluster of moderately busy prices outweigh one sharp peak. At 8 points the "POC" was an 8 point zone holding 25.48% of the session, which is a broad area rather than a level you can put a stop behind. The value area also drifted further below 70% as rows got coarser, falling to 61.44%, because big rows overshoot the target and the procedure stops early.
Volume profile settings checklist
- Fix the window first, then read the levels. A session level and a fixed range level answer different questions.
- Write the source bar size and row height next to any level you plan to trade. A level quoted without them cannot be reproduced.
- Use fine rows (1 to 4 ticks) to locate a precise POC and coarser rows only to see broad nodes.
- Know your value area convention: 68% or 70%, and whether the row that crosses the target is included.
- Treat a 1 or 2 point difference between platforms as noise. Treat a jump from one node to another as a sign the session had two competing value areas.
- On futures, check whether the profile is built from the full trading day or regular hours only.
Volume Profile Trading Strategies
Volume profile does not create entries on its own. It tells you where the important prices are, and a strategy decides what price has to do at those prices before you act. Below are three common setups, using round illustrative ES levels, not live prices. One ES point is $50 per contract and one MES point is $5.
Value area rejection back toward the POC
The setup: price probes above the prior VAH, fails to build volume there and closes back inside the value area.
- Context: prior VAH 7,740.00, prior POC 7,725.00 (illustrative).
- Trigger: a 5 minute close back below 7,740.00 after a probe to 7,746.00.
- Entry: short near 7,738.00.
- Stop: above the probe high, at 7,747.00. Risk 9 points, $450 per ES or $45 per MES.
- First target: the POC at 7,725.00, 13 points away.
- Invalidation: price builds volume back above 7,740.00 and holds. That is acceptance, and the trade idea is wrong.
Low volume node traverse
The setup: price breaks into a thin LVN between two HVNs and is expected to travel quickly to the next node.
- Context: HVN at 7,700.00, LVN from 7,705.00 to 7,715.00, next HVN at 7,720.00 (illustrative).
- Trigger: price closes above 7,705.00 with volume rising, out of the lower node.
- Entry: long near 7,706.00.
- Stop: back inside the lower node, at 7,700.00. Risk 6 points, $300 per ES or $30 per MES.
- Target: the edge of the next HVN at 7,720.00.
- Invalidation: price stalls inside the LVN and starts trading volume there. The node is filling in, so the "fast move" premise is gone.
POC retest in a trending market
The setup: value has migrated higher, and price pulls back to the prior session's POC.
- Context: today's value area sits above yesterday's; prior POC at 7,725.00 (illustrative).
- Trigger: price tests 7,725.00 and holds, with selling drying up.
- Entry: long near 7,727.00.
- Stop: below the prior value area low or the nearest LVN under the POC, for example 7,717.00. Risk 10 points.
- Target: the current session's high or the next HVN above.
- Invalidation: price trades back through the POC and accepts below it. The trend read was wrong.
If you miss the trigger and price is already well past it, the original stop and target no longer fit. Chasing it is a different trade with worse numbers, and waiting for the next qualified setup is a valid decision.
In every case the profile names the level and price action decides. Size so that a stop at your invalidation point is a loss you have planned for, and remember that a well-placed stop can still be hit.
Does Volume Profile Work in Practice
Volume profile works as a map of where volume traded. Whether it makes money depends on the rules you attach to it, and those rules deserve the same testing as any other strategy. A statistic that circulates without its definition is a story, not evidence, so here is one popular rule tested with its definition written out.
Testing the 80% rule on ES and NQ
The 80% rule says that when the market opens outside the prior value area and then trades back inside for two consecutive 30 minute periods, it has an 80% chance of reaching the other side of the value area.
Source and test definition. This is this guide's own calculation on Yahoo Finance continuous ES and NQ futures bars, not a published study. Regular trading hours only, 9:30 AM to 4:00 PM ET. Prior value area from the previous regular session's 70% profile, 5 minute source bars, 1 point ES rows and 5 point NQ rows. The open is outside the prior value area. Two consecutive 30 minute closes inside it count as acceptance. Success means touching the opposite value area edge later that same session. Sample: 46 back-to-back sessions per market, 27 August to 4 November 2026.
| Market | Back-to-back sessions | Opened outside prior value area | Two 30 minute closes back inside | Reached opposite edge | Hit rate on accepted setups |
|---|---|---|---|---|---|
| ES | 46 | 36 | 12 | 4 | 33.3% |
| NQ | 46 | 34 | 12 | 3 | 25.0% |
In this guide's Yahoo Finance sample the rule reached the far side 4 of 12 times on ES and 3 of 12 on NQ. Twelve events per market is a small sample, so the honest conclusion is narrow: this window gave no support for an 80% hit rate, and anyone sizing trades on that number should first test it on their own definition and data.
That is the general answer to whether volume profile is profitable. Traders who report success with it usually use it to pick locations and then wait for price confirmation, with risk defined before entry. The profile helps you decide where to look. It does not tell you what price will do next.
Volume Profile Limitations and Common Mistakes
Volume profile is useful, and it has limits. Most of the trades blamed on the tool come from reading it as more precise, or more predictive, than it is. The measurements in the table below come from this guide's own calculation on Yahoo Finance ES and NQ futures data, August to November 2026.
| Volume profile mistake | Why it happens | What the measurements show |
|---|---|---|
| Treating the POC as a wall | It is the busiest row, so it looks like a barrier | The next session traded through the prior POC in 38 of 45 ES pairs |
| Quoting a level without its settings | Platforms use different source bars and row heights | Switching 5 minute for 30 minute bars moved the ES POC on 38 of 47 sessions |
| Assuming the value area holds exactly 70% | The setting is labelled 70% | The literal procedure held a median 69.35% on ES, as low as 66.01% |
| Trusting coarse rows as precise levels | A big row still draws as one line | At 8 point rows the 27 October 2026 POC was a zone holding 25.48% of volume |
| Sizing on the 80% rule | The figure circulates without its definition | It reached the opposite edge 4 of 12 times on ES and 3 of 12 on NQ in this sample |
| Expecting two platforms to match | Both are called volume profile | Value area defaults differ (68% vs 70%) and so do stop rules |
Other limits to keep in mind:
- It is backward-looking. The profile describes finished trade. New information can make an old node irrelevant.
- Bar-based profiles estimate. Unless the profile is built from tick data, the volume inside each bar is spread by assumption.
- Volume type varies by market. TradingView notes that it uses trade volume for stocks but tick volume (number of price updates) for index, forex and crypto CFDs. Futures traders should check that their chart uses exchange-traded contract volume.
- Context changes the meaning. The same HVN means something different in a trend than in balance.
Volume Profile vs Market Profile
Volume profile and market profile both draw horizontal distributions and both produce a POC and value area, but they count different things.
| Tool | What it counts | Built from | Best used for | Main limitation |
|---|---|---|---|---|
| Volume profile | Contracts traded at each price | Lower timeframe bars or ticks in a chosen window | Finding prices where volume concentrated | Levels move with source bars and row height |
| Market profile (TPO) | Time periods that traded at each price | Letters or blocks per time period, 30 minutes by default on TradingView | Session structure, balance versus trend | Time at price is not volume at price |
| Order flow | Aggressor side of individual trades | Live tick-by-tick data | Judging whether a level is being defended right now | Needs tick data and practice to read |
TradingView's TPO indicator uses 30 minute blocks by default and a 70% value area, and its POC is where price spent the most time. A market profile POC and a volume profile POC often sit close together on a balanced day and can separate on a day with a fast, high-volume spike, because a spike adds a lot of volume but little time.
A practical split: volume profile for level selection, market profile for session structure, order flow for live confirmation at the level.
Related lesson: Order flow analysis
Volume Profile Platforms and Tools
Most futures charting platforms include a volume profile, but the defaults differ, which is one reason two traders can quote different levels for the same session.
| Platform | Volume profile tools | Value area default | Row height setting |
|---|---|---|---|
| TradingView | Session, Session HD, Visible Range, Fixed Range | 70% | Number of rows or ticks per row |
| NinjaTrader 8 | Order Flow Volume Profile (indicator and drawing tool), Session, Bars, Composite | 68% | Ticks per level, default 1 |
| Quantower | Step, left and right, and custom profiles | 70% | Custom step, default 1 tick |
| Sierra Chart | Volume by Price and Volume Value Area Lines studies | 70% | Set per study, and the chart tick size must be correct |
NinjaTrader states that its Order Flow Volume Profile is part of the Order Flow + suite available only to NinjaTrader lifetime license holders. TradingView's profiles on futures charts use a lower timeframe than the chart, so the chart timeframe you choose also changes the profile's source bars.
On our accounts, a volume profile can be charted on the supported platforms: NinjaTrader and TradingView through a Tradovate account, and Quantower or Sierra Chart (which needs its own Sierra Chart subscription) through a Rithmic account. A volume profile is built from traded volume rather than order book depth, so it works with the Level 1 data included with our accounts. Positions on our accounts are closed by 4:45 PM ET each day, so the prior session's POC and value area are reference levels for a fresh session rather than levels you carry a position through.
Volume Profile FAQ
What is the 80 percent rule in volume profile?
It says that if price opens outside the prior value area and then holds inside for two consecutive 30 minute periods, it tends to reach the other side of the value area 80% of the time. In this guide's own test on Yahoo Finance data for 46 regular sessions, the setup reached the opposite edge 4 of 12 times on ES and 3 of 12 on NQ. Treat it as a pattern to test, not a probability to size on.
Is volume profile on TradingView accurate?
It is an accurate summary of the bars it is fed, with two caveats. On futures charts it builds the profile from a timeframe one step below the chart's, so levels can change when you change chart timeframe. It also splits up and down volume by whether each source bar closed above or below its open, not by actual buyer and seller orders.
How many rows should a volume profile have?
A volume profile should have as many rows as the precision you need, which on ES usually means a row height of 1 to 4 ticks for a precise POC. Row height decides the row count, so set the height first. On the 27 October 2026 ES session, 1 point rows gave 74 rows and a POC holding 4.31% of volume, while 8 point rows gave 10 rows and a POC zone holding 25.48%.
Is volume profile a good indicator?
It is good at showing where volume traded and weak as a stand-alone signal. Use it to choose levels, then wait for price to confirm at those levels with a stop already defined.
What is the difference between volume profile and VWAP?
VWAP is a single line showing the average price paid, weighted by volume, from a chosen starting point. Volume profile shows the whole distribution of volume across prices. VWAP tells you the average, and the profile tells you where the volume clustered.
Volume Profile Risk Note
This article is for education only and is not financial advice or a recommendation to trade any instrument. Futures are leveraged, and losses can build quickly and exceed what you planned to risk. The ES and NQ figures are historical measurements from a stated sample and are not a forecast. Funded and evaluation accounts are simulated, and results there do not reflect live market fills.


