



TL;DR: Order flow analysis reads resting limit orders and the market orders that hit them, so it shows what a fill will cost. On 49 sessions of ES and NQ bars, reconstructed bar aggression predicted the next bar less than half the time. Session aggression matched the day's direction 75.51% and 81.63% of the time, partly by construction. Use order flow to judge execution and levels, not as a standalone forecast.
What order flow analysis measures
If you have ever sent a market order at the price on your screen and been filled a tick or two worse, you have already met order flow. Order flow analysis is the study of the orders that trade in a market: which orders are resting, which ones arrive and consume them, and at what prices. A candlestick chart summarizes the result. Order flow analysis looks at the trades that produced it.
Two kinds of order are involved. A limit order rests at a chosen price and waits, accepting the risk of never filling. A market order does not wait. It trades immediately against the best resting limit order on the other side. Price only moves when market orders use up the resting orders at a level, or when the resting orders are cancelled.
That is why "more buyers than sellers" is a poor explanation for a rally. Every contract that trades has exactly one buyer and one seller. What differs is which side was willing to cross the spread and accept the worse price. Order flow analysis is the attempt to measure that willingness.
Related lesson: Market orders
Order flow data from the book and the tape
Order flow analysis draws on two different data streams, and mixing them up is where most beginners first go wrong.
The order book, shown on a depth of market (DOM) ladder, lists the limit orders waiting at each price. Every number there is intent that has not been tested. A resting order can fill, shrink or disappear before anyone reaches it.
The tape, also called time and sales, records what actually traded: the time, the price and the size of each execution. A print at the ask means a buyer crossed the spread; a print at the bid means a seller did. The book shows where people say they want to trade. The tape shows where they did.
On CME futures, the exchange publishes both in detail. Its MDP 3.0 market data includes a Market By Order full depth feed, which shows individual orders at every price level, and a 10-deep Market By Price feed, which aggregates the size at each of the ten best levels. Its trade summary messages carry an aggressor side for each match, flagging whether the buyer or the seller initiated it. That aggressor flag is the raw material behind any honest footprint or delta reading.
Reading the tape at a marked level
Tape reading is less about any single print and more about pace and location. At a level you marked in advance, a few questions do most of the work:
- Are large prints hitting the bid repeatedly while price refuses to go lower?
- Is price moving through a level on light, scattered prints, which suggests little resistance there?
- Does the pace of prints speed up as price approaches the level, then stall?
None of those answers is a signal on its own. They describe how the auction is behaving at a price you already cared about, which is a different job from predicting it.
Related lesson: Time and sales
How a market order walks the order book
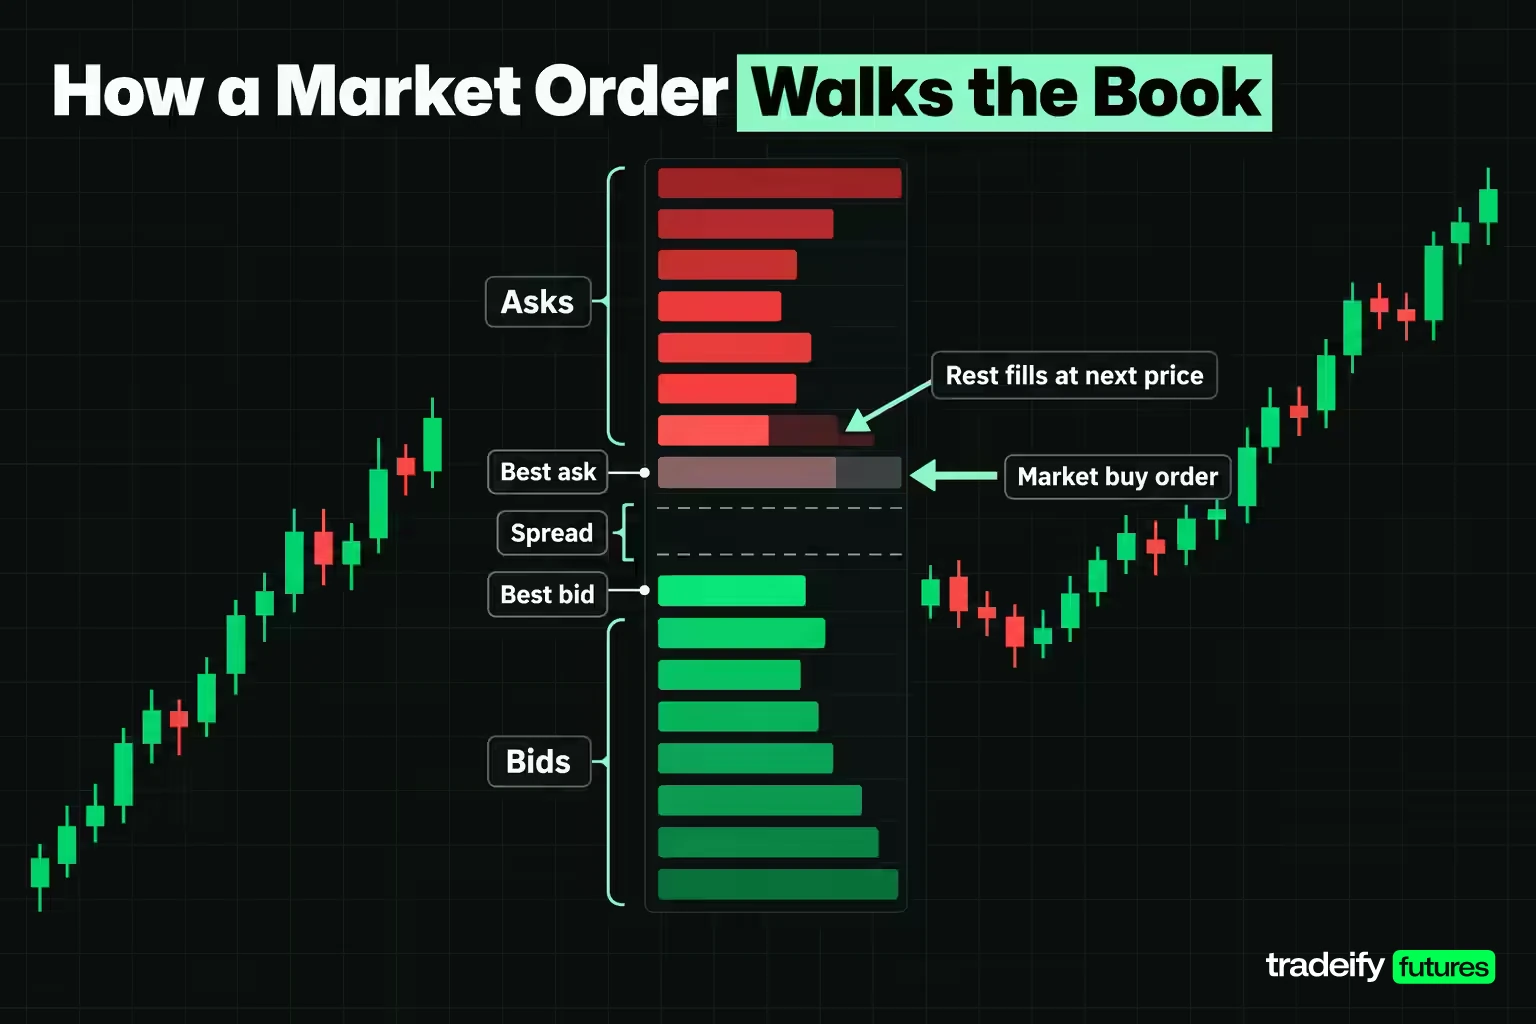
The arithmetic of a market order moving through the book is the most practical part of order flow analysis, because it tells you what your own fill will cost. The example uses the E-mini S&P 500 (ES), where one tick is 0.25 index points worth $12.50 and one full point is $50. The prices are illustrative and round.
| Price | Bid contracts | Ask contracts | Note |
|---|---|---|---|
| 7600.75 | none | 48 | Fourth ask |
| 7600.50 | none | 63 | Third ask |
| 7600.25 | none | 9 | Second ask |
| 7600.00 | none | 17 | Best ask |
| 7599.75 | 22 | none | Best bid |
| 7599.50 | 41 | none | Second bid |
| 7599.25 | 128 | none | Third bid |
The best bid is 7599.75 and the best ask is 7600.00, a normal one tick spread. Now send a market order to buy 20 contracts. It cannot trade against bids, so it takes from the ask side, cheapest first. The 17 contracts at 7600.00 fill completely, leaving 3. The next level, 7600.25, holds 9, so the order takes 3 there and stops.
The average fill is total cost divided by contracts. That is 17 at 7600.00, or 129,200.00, plus 3 at 7600.25, or 22,800.75, for 152,000.75. Divided by 20, the average fill is 7600.0375. That is 0.0375 points above the best ask, or 0.15 of a tick, about $1.875 per contract and $37.50 across the 20 contracts.
The same order against a thinner book
Now run the same 20 contract ES buy a moment later, after most of the near asks have been pulled. The book shows 4 at 7600.00, 6 at 7600.25, then 63 and 48 behind them.
| Fill step | Book as first displayed | Book after near asks are pulled |
|---|---|---|
| First level | 17 at 7600.00 | 4 at 7600.00 |
| Second level | 3 at 7600.25 | 6 at 7600.25 |
| Third level | not needed | 10 at 7600.50 |
| Average fill | 7600.0375 | 7600.325 |
| Slippage past best ask | 0.15 tick | 1.3 ticks |
| Slippage in dollars on 20 contracts | $37.50 | $325 |
The quoted price never changed. The best ask was 7600.00 both times. Yet the second fill cost 0.2875 points more on average, $287.50 more across 20 contracts, because the depth in front of the order was thinner than it had looked.
That is the most defensible edge order flow analysis offers. It is not a forecast. It is a better estimate of what your execution will cost before you send the order, and that alone can change whether you use a limit or a market order.
Why displayed depth can vanish
Resting orders can be cancelled at any time, and most legitimate ones are. Some are not legitimate. The CFTC treats spoofing, defined in the Commodity Exchange Act as "bidding or offering with the intent to cancel the bid or offer before execution," as a prohibited disruptive practice, and its guidance includes orders placed to create an appearance of false market depth. The practical lesson is simple. Size on the DOM is a claim until a trade prints against it.
Related lesson: The order book
Reading order flow on a footprint chart
A footprint chart is a candle split open. Instead of one body and two wicks, it shows how much volume traded at each price inside the bar, separated into contracts that traded at the bid (sellers crossing) and contracts that traded at the ask (buyers crossing). Platforms name it differently: volumetric bars, cluster charts, numbers bars. The structure is the same.
Here is one illustrative five minute ES bar.
| Bar price | Traded at bid | Traded at ask |
|---|---|---|
| 7605.00 | 30 | 15 |
| 7604.75 | 120 | 410 |
| 7604.50 | 95 | 380 |
| 7604.25 | 260 | 240 |
| 7604.00 | 210 | 55 |
Delta on a single bar
Delta is ask volume minus bid volume. In this bar, 1,100 contracts traded at the ask and 715 at the bid, so delta is +385 on 1,815 contracts, or 21.2% of the bar's volume. Buyers were the more aggressive side overall.
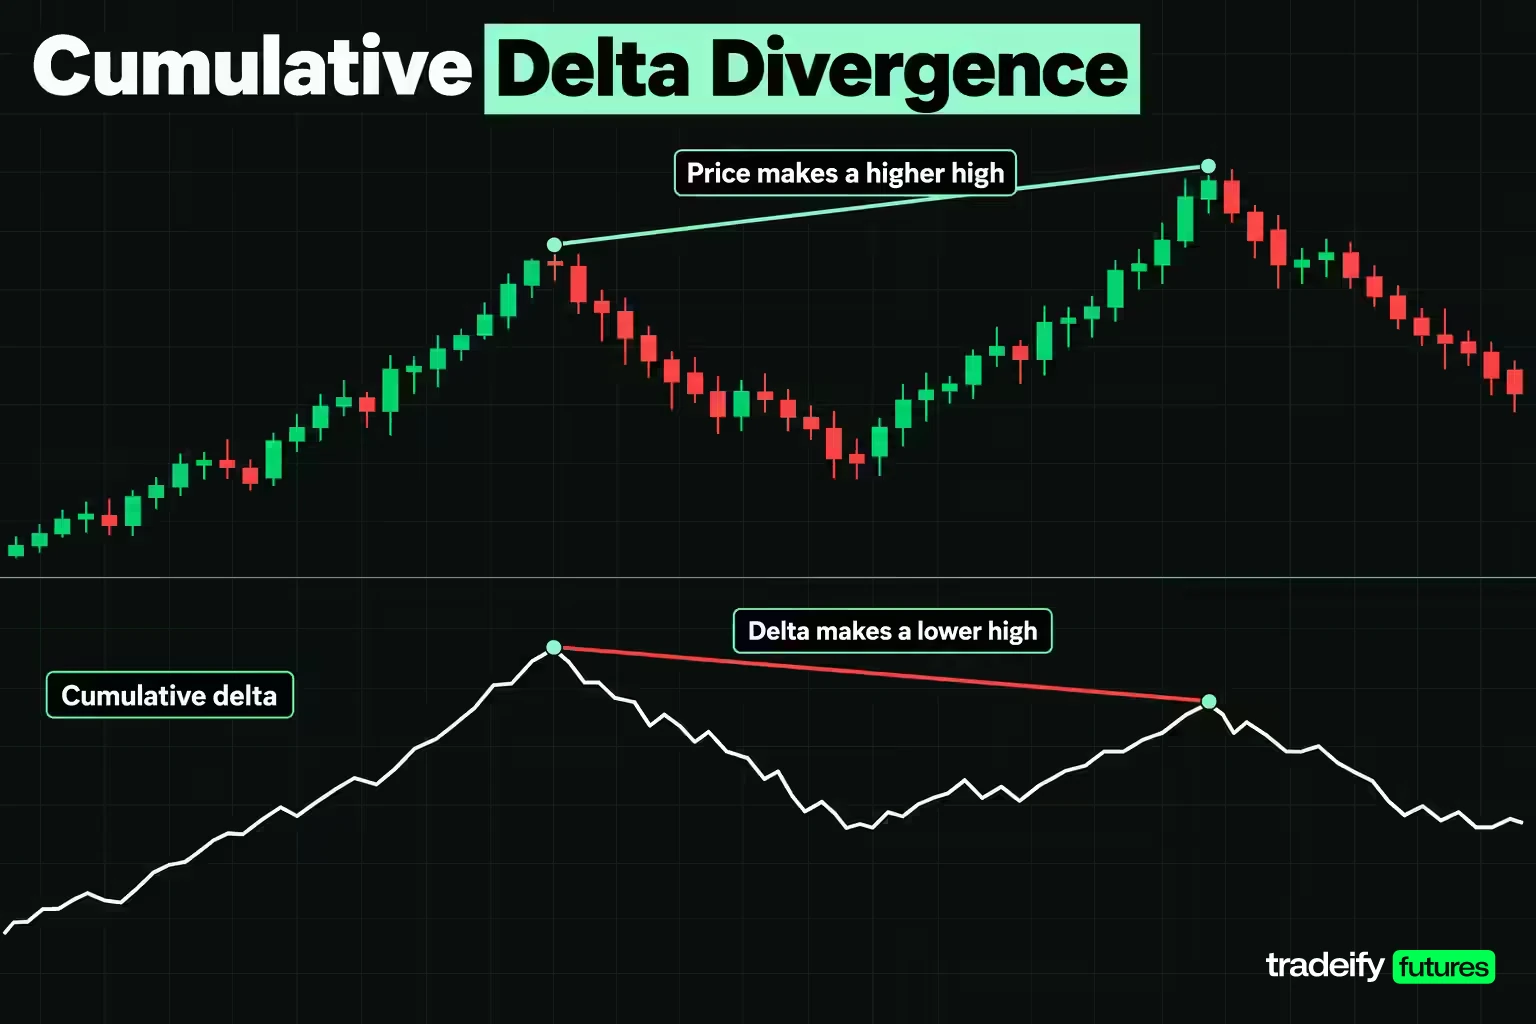
Cumulative delta adds each bar's delta to a running total through the session. It is useful for spotting divergence, such as price making a new high while cumulative delta does not. Divergence is an observation, not a confirmation. It says aggressive buying did not expand with the new high; it does not say the high will hold.
Related lesson: Cumulative delta
Bid and ask imbalances on the diagonal
Imbalances on most footprint tools are compared diagonally, because a buyer lifting the ask at one price is trading against the bid one tick lower. A buy imbalance compares ask volume at a price with bid volume one tick below it. A sell imbalance compares bid volume at a price with ask volume one tick above.
With an illustrative 3 to 1 threshold, this bar shows one of each. At 7604.75, 410 contracts were bought at the ask against 95 sold at the bid one tick lower, about 4.3 to 1. At the top, 120 contracts were sold at the bid at 7604.75 against only 15 bought at the ask at 7605.00, 8 to 1.
So a bar with clearly positive delta also shows sellers in control at its very top. That is what an honest footprint reading usually looks like. Several facts at once, some pointing in opposite directions, and none of them a trade on its own.
Why bar data only approximates order flow
A true footprint needs every trade with its aggressor side. If your chart is built from ordinary bars, which carry only open, high, low, close and volume, any buy and sell split on it is a reconstruction based on an assumption.
Two assumptions are common.
- The tick rule. If a bar closes above the previous bar's close, all of its volume is counted as buying; below, selling; unchanged, it keeps the previous sign.
- The close location value. Each bar gets a score from +1 (close at the high) to -1 (close at the low), and that score is multiplied by volume.
Both produce a number people call net buying. To see how much they agree, this guide applied both to 49 sessions of five minute E-mini S&P 500 (ES) and E-mini Nasdaq-100 (NQ) bars, using the 9:30 AM to 4:00 PM ET window. On ES they agreed on the sign of the day's net flow in 33 of 49 sessions, 67.35%. On NQ they agreed in 37 of 49, 75.51%.
Put the other way, the two standard reconstructions disagreed about which side dominated in 16 of 49 ES sessions and 12 of 49 NQ sessions. A platform that changes convention would flip roughly one session in three on ES and one in four on NQ. Before trusting a delta panel built on bars, find out which rule your platform uses.
Order flow tested on 49 sessions of ES and NQ
Most order flow content describes what the tools show. Very little reports how often a reading worked. This guide's own study measured that on Yahoo Finance's continuous ES and NQ futures bars, data anyone can reproduce, and it is plain about its limits.
Order flow study method and data
- Markets. Yahoo Finance's ES and NQ continuous front-month futures series, which roll from the September to the December contract inside the window.
- Sessions. 49 completed sessions per market, August 27 to November 4, 2026, using five minute bars stamped 9:30 AM to 3:55 PM ET. That is 3,820 bars per market.
- One data defect. On October 30, 2026 the feed skipped the 2:55 PM bar and printed a corrupted 3:00 PM bar, so that bar was dropped and the session kept 76 bars.
- A one minute set. Five completed ES sessions of one minute bars (October 28 and 29, and November 2, 3 and 4, 2026), 1,950 bars. October 30 was left out for the same feed gap.
- Aggression. The tick rule for the main tests, with the close location value as a check.
- Session direction. The 4:00 PM close minus the 9:30 AM open.
This is bar data, not exchange aggressor data. Every result below is a statement about the reconstruction a bar chart user actually sees.
Session order flow vs session direction
In this guide's study, the tick rule gave these session level results.
| Market | Sessions | Median net aggression | Sessions beyond 2% | Aggression matched direction | Rank correlation |
|---|---|---|---|---|---|
| ES | 49 | 0.87% | 42 of 49 | 37 of 49, 75.51% | 0.62 |
| NQ | 49 | 3.97% | 45 of 49 | 40 of 49, 81.63% | 0.86 |
At first glance that looks strong. Read it carefully, though. The tick rule labels any bar that closed higher as buying, so adding it up across a session partly restates where the session went. Some of that agreement is built into the method.
In the same study, the close location value, which does not use the previous close, matched session direction less often, 33 of 49 on ES (67.35%) and 32 of 49 on NQ (65.31%).
The wrong-way sessions in this guide's study are the ones that cost money: 12 of 49 on ES and 9 of 49 on NQ. On September 14, 2026, ES showed net aggression of -4.90% of 1,595,177 contracts and still finished 86.00 points higher. On September 16, 2026, NQ showed +3.72% and finished 132.50 points lower.
Bar order flow vs the next bar
The more useful question for a day trader is whether one bar's aggression says anything about the next bar. If it did, a bar dominated by buying should be followed by a higher close more often than not, especially on the heaviest bars.
This guide's bar level test on the same Yahoo Finance data produced these rates.
| Data set | Bars tested | Next bar agreed | Agreement rate | Strongest 20% of bars | Strongest 20% rate |
|---|---|---|---|---|---|
| ES five minute | 3,654 | 1,763 | 48.25% | 366 of 731 | 50.07% |
| NQ five minute | 3,747 | 1,806 | 48.20% | 390 of 750 | 52.00% |
| ES one minute | 1,828 | 873 | 47.76% | 183 of 366 | 50.00% |
In this guide's test, every full-sample rate sits just under 50%. The heaviest bars did no better than a coin flip. The best figure, 52.00% on 750 NQ bars, is about 1.1 standard errors from 50%, well inside normal noise. Bars where either bar closed unchanged were skipped.
This guide's close location value version gave the same answer: 47.94% on 3,569 ES bars and 48.50% on 3,728 NQ bars, with the strongest 20% at 48.74% and 47.99%.
On this sample, reconstructed bar level aggression carried no usable information about the next bar.
Limits of the 49 session order flow sample
The 49 session ES and NQ order flow results are limited by their inputs, and four changes could move them.
- Real aggressor data. Exchange-flagged trades would replace the bar proxy, and the bar level test could come out differently.
- A longer window. 49 sessions covers one stretch of market conditions; a different volatility regime could change the session level results.
- Different markets. These are two large equity index futures contracts on one exchange. Thinner markets may behave differently.
- A different question. The session and bar tests ask about direction. They say nothing against using order flow for execution, such as estimating the cost of a fill against visible depth.
Related lesson: Footprint charts
How often order flow absorption shows up
Absorption is one of the most cited ideas in order flow analysis. Heavy volume trades at a price and price fails to move, suggesting a large passive participant is filling the aggressive orders arriving there. Exhaustion is the mirror image: aggressive orders keep arriving but in shrinking size at the extreme of a move, until there is nobody left to push.
Absorption can be tested on bars. Define an absorbing bar as one in the heaviest 20% of bars by volume that also sits in the narrowest 40% by range. Then check whether the close three bars later moved in the direction of the bar's aggression.
This guide's absorption test on Yahoo Finance ES and NQ bars found the following.
| Data set | Volume threshold | Range threshold | Absorbing bars found | Follow-through | Baseline follow-through |
|---|---|---|---|---|---|
| ES five minute | 21,760 contracts | 4.75 points | 8 of 3,613, 0.22% | 3 of 8 | 49.40% |
| NQ five minute | 7,845 contracts | 26.25 points | 0 of 3,667 | none to test | 49.11% |
| ES one minute | 4,650 contracts | 2.50 points | 5 of 1,861, 0.27% | 3 of 5 | 50.40% |
Heavy volume and a narrow range almost never came together. Heavy bars are usually wide bars, because volume and volatility rise together. NQ produced none at all in 49 sessions.
With 8 and 5 cases, the follow-through numbers mean very little either way. The fair conclusion is narrower than most marketing. Absorption at these thresholds is rare, so if you see it called out several times a day, the definition being used is far looser than this one.
Order flow indicators, volume profile and VWAP
Order flow indicators summarize the tape or the book into something you can watch. The common ones are delta and cumulative delta, the footprint itself, volume profile, VWAP and, more loosely, bar-based volume oscillators such as the Money Flow Index. That last group uses only price and volume from bars, so it is closer to the reconstruction problem than to true order flow.
Volume profile and where volume concentrates
A volume profile ranks price levels by how much traded there. The busiest level is the point of control, and the cluster around it is the value area. Using the five one minute ES sessions, each bar's volume was spread evenly across the ticks it traded, which is itself an approximation because bars carry no volume at price.
| Session | Price levels traded | Contracts | Five busiest levels | Busiest 10% of levels | Range in points |
|---|---|---|---|---|---|
| October 28, 2026 | 172 | 1,199,240 | 7.79% | 26.20% | 42.75 |
| October 29, 2026 | 169 | 1,426,298 | 6.73% | 20.84% | 42.00 |
| November 2, 2026 | 493 | 1,520,392 | 3.38% | 23.29% | 123.00 |
| November 3, 2026 | 190 | 1,054,636 | 6.56% | 21.81% | 47.25 |
| November 4, 2026 | 267 | 1,614,792 | 5.06% | 25.03% | 66.50 |
On average the five busiest ticks held 5.90% of the day's contracts and the busiest 10% of traded levels held 23.43%. On October 28 the five busiest levels sat within 1.75 points, from 7771.00 to 7772.75, each holding between 1.51% and 1.61% of the day's volume.
The more useful comparison is volume against distance. November 2 traded about 7% more contracts than October 29 but covered about 2.9 times the range. Heavy trade without travel marks a price both sides accepted. Light trade over a wide range marks prices the market passed through quickly, which is where a later return often moves fast again.
Related lesson: Volume profile
VWAP as a participation benchmark
VWAP, the volume weighted average price, is the order flow indicator most traders already have. In this guide's 49 session study of Yahoo Finance five minute bars, the ES close sat above the running VWAP on 1,985 of 3,820 bars (51.96%), and 25 of 49 sessions closed above it. On NQ it was 2,122 of 3,820 bars (55.55%), again with 25 of 49 sessions closing above.
Price above or below VWAP was close to an even split. It tells you who is ahead of the day's average price, not what happens next. VWAP is better used as an execution benchmark and a reference level than as a directional filter.
Related lesson: VWAP
Order flow analysis vs technical analysis
Order flow analysis and technical analysis answer different questions, so "which is better" is the wrong frame.
| Question | Technical analysis | Order flow analysis |
|---|---|---|
| Where has price been | Strong, from the chart | Indirect |
| Where are the reference levels | Prior highs, lows, ranges | Volume profile, high-volume nodes |
| Who is crossing the spread right now | Not visible | Tape and footprint |
| What will my fill cost | Not visible | Order book depth |
| Data needed | Bars | Tick data, ideally with aggressor flags |
The common combination is to let technical analysis choose the location and let order flow describe the behavior there. A trader marks a prior day high in advance, then watches whether aggressive buying at that level lifts price through it or gets absorbed. The chart supplies the question. The order flow supplies some of the answer.
Order flow trading strategies and where they fail
Most order flow trading strategies are variations of three ideas. Each needs a level chosen in advance and a stated invalidation.
- Breakout confirmation. Price reaches a marked level and trades through it with aggressive prints and expanding delta. The read is invalidated if price slips back inside the level on light volume.
- Reversal at a level. Heavy aggressive selling hits a marked support level and price stops falling, a possible absorption. The read is invalidated if the level breaks on the next push.
- Execution timing. No directional call at all. The trader already has a plan and uses the DOM and tape to choose between a limit order and a market order, and to avoid sending size into thin depth.
Is order flow trading profitable
There is no reliable public base rate for order flow strategies, and a 49 session test of ES and NQ bars gives no reason to assume one. Bar level aggression did not predict the next bar, and absorption at strict thresholds was rare. That does not make order flow useless. It means the claim that a delta panel shows you where price is going is not supported by this data.
The realistic expectation is smaller and more useful. Order flow can help with where to act and how to fill. Results depend on the trader's own rules, sample size, costs and discipline, and many traders lose money with or without these tools.
The failure modes are predictable:
- Treating displayed depth as real until it is tested.
- Trusting a delta panel without knowing whether it uses aggressor flags or a bar rule.
- Seeing absorption everywhere because the definition is loose.
- Reading session aggression as a forecast, when it pointed the wrong way on 12 of 49 ES sessions in this guide's 49 session test.
Related lesson: Position sizing
Which markets suit order flow trading
Order flow analysis works best where all trading happens in one place. Exchange-traded futures fit that description: a contract such as ES trades on one exchange, so the volume, the book and the aggressor flags all come from a single source. NinjaTrader's own order flow page makes the same point, that futures trade data is centralized at the exchange, which makes bid and ask volume standardized.
US stocks are different. The same share can trade on many exchanges and off-exchange venues, so any one book shows only part of the trading. Spot forex is an over-the-counter market with no single consolidated tape, and crypto trades on many separate exchanges at once. Order flow tools exist for all of them, but each book shows only part of the market.
Order flow software and the data it needs
Order flow software is less about brand than about data. Every tool can only show what its feed delivers, so ask what data a feature needs before paying for it.
| Feature | What it needs | Examples |
|---|---|---|
| DOM ladder | Market depth, usually several levels | Most futures platforms |
| Time and sales | Trade-by-trade data | Most futures platforms |
| Footprint chart | Tick data with bid and ask side | NinjaTrader volumetric bars, ATAS clusters, Sierra Chart numbers bars |
| Liquidity heatmap | Full depth history over time | Bookmap, ATAS |
| Iceberg and stop tracking | Market by order data | Bookmap MBO add-ons, ATAS MBO bundle |
| Volume profile and VWAP | Trade data, or bars as an approximation | Nearly all charting platforms |
Bookmap, for example, says its iceberg and stop-run trackers need a market by order feed. A heatmap running on top-of-book data alone shows far less than its marketing images. Before choosing a platform, check which data level your account and broker actually deliver.
On our accounts, Tradovate-based accounts include Level 1 CME data and a Time and Sales module, and Level 2 depth is a paid add-on bought from Tradovate. Rithmic-based accounts (Tradesea, Quantower, Sierra Chart and R Trader Pro) are Level 1 only for now, so DOM depth and heatmap features there run on top-of-book data. Bookmap and ATAS are not on our supported platform list.
Related lesson: Market depth and level II data
How to learn order flow analysis
Order flow analysis is not hard to understand, but it is slow to learn well, because the skill is recognizing behavior at a level while the clock is running. A structured routine makes that practice deliberate instead of random screen time.
- Do the book arithmetic by hand first. Copy a ladder from your own platform and walk a market order through it. This costs nothing and shows the depth, size and fill relationship no subscription changes.
- Mark levels before the session. Use the prior day's high-volume prices and the opening range. These are the places you will watch, not signals.
- Watch the tape only at those levels. Note whether prints are trading heavily without progress, or whether price is moving through on light volume.
- Practise on replay or simulation. Replay the same session several times and write down what you expected before each level was tested.
- Journal the outcome, not the hope. Record whether the level held, broke or was never tested. Over enough entries, you build your own base rate instead of borrowing someone else's claim.
Order flow analysis FAQ
What is order flow analysis in simple terms?
It is the study of the orders that move a market rather than the chart they leave behind. You read the limit orders resting at each price and the market orders trading against them. Price moves when one side's resting orders are used up or pulled.
Is a footprint chart the same as order flow?
A footprint chart is one way to display order flow. It shows executed volume at each price split by bid and ask, but not resting orders. If it is built from bars rather than tick data, the split is a reconstruction.
Does order flow predict the next move?
Not on its own, and not at bar level in this guide's 49 session study of ES and NQ bars. Reconstructed aggression agreed with the next five minute bar 48.25% of the time on ES and 48.20% on NQ, and the heaviest bars did no better. Its stronger use is judging execution and behavior at levels.
What is absorption in order flow?
Absorption is heavy volume at a price with little price movement, suggesting a large passive participant is taking the other side. It is real but rare at strict definitions. In this guide's 49 session bar study it appeared on 0.22% of five minute ES bars and on no NQ bars.
Which software is best for order flow analysis?
No single order flow software is best; the right one is whichever matches the data your account can supply. Footprint charts need tick data with bid and ask side, heatmaps need full depth, and iceberg tracking needs market by order data. Check that data level before choosing a platform.
Is order flow analysis better than candlestick analysis?
Neither is better, because they answer different questions. Candlesticks describe where price went. Order flow describes how the trading happened and what a fill will cost, so most traders use both together.
Is order flow hard to learn?
The concepts are simple, but reading them quickly takes practice. Start with the book walk arithmetic, then practise on replay at levels you marked in advance. Keep a journal so you build your own base rate.
This article is educational and is not investment advice. Futures trading carries substantial risk, and leverage can make losses larger than expected, including more than your initial deposit in a brokerage account. The study figures come from historical bar data and a reconstruction method, not from live trading, and past results do not indicate future results. The order book and footprint examples are illustrative, not captured market snapshots. Evaluation and funded prop accounts are simulated, and simulated fills can differ from live execution.


