



TL;DR: Trading volume is the number of shares or contracts that changed hands in a period, and it only means something against a comparison. Compare it with the same hour on normal days: in 47 MES sessions, a median 43% of the day's volume had traded by 10:30 AM ET. Volume shows participation, not direction, and it never says whether buyers or sellers were in control. On a 4-contract MES trade, 4 ticks of slippage plus commission lift the 2R break-even win rate from 33.3% to 50.7%.
Trading volume is the row of bars under the price chart that most new traders glance at and never really read. It goes up, it goes down, and somewhere along the way someone told you a big bar means something important happened. Sometimes it did. Often it just means the clock reached 9:30 AM.
This guide treats trading volume as a measurement, not a signal. It covers what trading volume counts, how exchanges report it, how it shows up on a chart, and how to read it in context. The worked examples run on Micro E-mini S&P 500 futures, using a 47-session study of when that contract actually trades during the day and the arithmetic that turns a volume read into a cost you can put in your trading plan.
What Is Trading Volume
Trading volume is the number of units of a market that changed hands during a set period. For a stock, the unit is shares. For a futures contract, the unit is contracts, where each contract is a standardized agreement on a fixed quantity of the underlying. CME Group, which lists the most widely traded U.S. equity index futures, reports volume as the number of contracts traded on a given date across all of its venues, including its Globex electronic platform, its trading floor and privately negotiated trades reported through ClearPort.
Each unit that changes hands is counted once. A buyer and a seller are two sides of the same fill, so a 10-contract trade adds 10 to the day's volume, not 20. That sounds trivial, but it removes one of the most common misreads in trading: a volume bar cannot tell you there were "more buyers than sellers," because every contract bought was also a contract sold.
A plain volume number also has no field for who started the trade. It records that a transaction happened, not whether an aggressive buyer lifted the offer or an aggressive seller hit the bid. Tools such as time and sales or footprint charts try to classify each print by side, but the volume bar itself does not.
Trading Volume Versus Dollar Value Traded
Volume counts units, not money, and that matters the moment you compare two markets. One Micro E-mini S&P 500 contract is $5 times the S&P 500 Index. At an illustrative index level of 7,000, one contract carries $35,000 of index exposure.
Now take the same $35,000 into cash stocks, using hypothetical prices. It buys 100 shares of a $350 stock or 1,000 shares of a $35 stock. Same money, three different volume numbers: 1 contract, 100 shares, 1,000 shares.
That is why a share count cannot be compared with a contract count, and why a stock with ten times the volume of another is not necessarily ten times as active in dollar terms. Read every market's volume against its own history, never against a different instrument's.
Related lesson: What notional value means
How Trading Volume Is Counted and Reported
Trading volume starts as a raw count of units traded and then gets turned into a handful of derived measures. Knowing which one you are looking at stops you comparing two different things.
The raw count is the trading volume the exchange reports. For CME futures, the settlement data splits volume by venue and then gives a total for the date. That total is the number most charting platforms show for a daily bar.
During the session, the number is still moving. Chase's investor education notes that intraday volume is reported as often as once per hour, that those intraday figures are estimates, and that actual volume data is published the following day. So a volume bar you read at 11 AM is a running tally, and any comparison built on it is approximate until the session closes.
Average, Relative and Tick Volume
Trading volume gets turned into a few derived measures, and each one is a different calculation on the same raw count. The common ones are:
- Period volume. The count for one bar, whether that bar is one minute, five minutes or one day. A one-minute bar and a daily bar are both called volume and are not comparable.
- Average volume. Total volume over a lookback window divided by the number of periods in it.
- Relative volume. Current volume divided by average volume for a comparable window. A reading of 1.00 means normal, 2.00 means twice normal.
- Tick volume. The number of price changes in a period rather than the number of units traded. Chase describes it as a surrogate for trade volume, since prices tend to change more often when more is trading.
- Cumulative indicators. Running totals that add or subtract volume depending on price direction, such as on-balance volume and the Trade Volume Index. These are interpretations layered on the raw count, not measurements of it.
A quick worked calculation shows how the first three connect. Five sessions of 1,000,000, 1,200,000, 900,000, 1,100,000 and 1,300,000 contracts sum to 5,500,000, so the five-session average is 1,100,000. A session that finishes at 1,650,000 contracts has a relative volume of 1.50, half again a normal day.
The trap in these calculations is the gap between relative volume and its base, and it catches experienced traders as often as new ones. A relative volume figure is only as good as the average it is divided by, and the most common base, a full day's average, is the wrong one for most of the trading day.
How Volume Appears on a Trading Chart
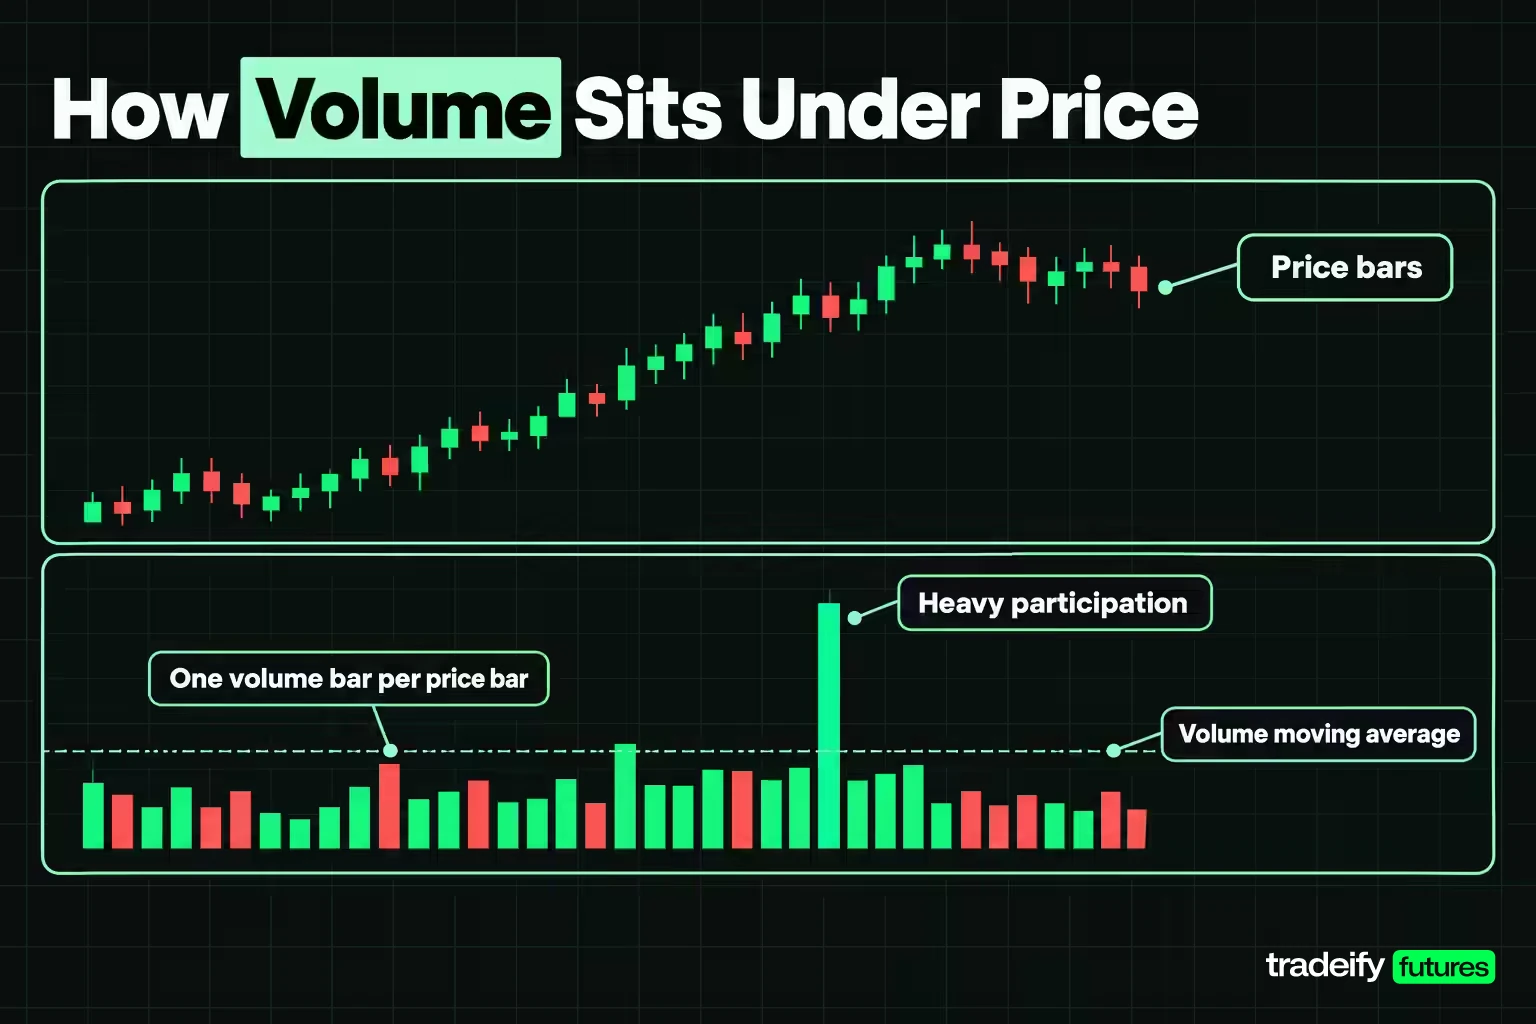
On nearly every charting platform, volume appears as a histogram of vertical bars under the price panel, one volume bar for each price bar. Taller bars mean more units traded in that period. The volume bar lines up in time with the candle above it, so a tall volume bar under a long candle tells you that move happened with heavy participation.
Most platforms color each trading volume bar to match the price bar. A bar is usually green or hollow when price closed up and red or filled when price closed down. Platforms differ on what "up" means: some compare the close with the bar's own open, others with the previous bar's close. Check the setting before you read anything into the colors, because the same bar can be green on one platform and red on another.
The color is a price fact pasted onto a volume bar. It does not mean the volume in a green bar was buying volume. A green bar of 9,000 contracts had 9,000 contracts bought and 9,000 contracts sold, the same as a red one.
Other Ways Platforms Display Volume
Beyond the standard histogram, three other volume displays are worth knowing:
- A moving average of volume. A line drawn across the volume bars over a set number of periods. It gives your eye a baseline so you can see which bars are unusual.
- Time and sales. A running list of individual trades with time, price and size. It shows the same volume the bars show, but print by print, so you can see whether a tall bar came from one large trade or thousands of small ones.
- Volume at price. A sideways histogram showing how much traded at each price level rather than in each time period. This is the volume profile, an indicator in its own right.
To add volume on TradingView, open a chart, click Indicators, search for "Volume" and add the built-in Volume indicator. TradingView's help center lists it under its built-in indicators. Most other platforms show volume by default or list it in the same kind of indicator menu.
How to Read Trading Volume in Context
Trading volume carries information only when you compare it with something. On its own, 550,000 contracts is just a number. Three comparisons do most of the work: the market's own recent history, the time of day, and the contract month. Skip any of them and a perfectly normal session can look dead or frantic.
What counts as "good" trading volume follows from this. There is no universal number. A good reading is one that is normal or better for that instrument at that hour, in the contract you are actually trading.
Relative Volume and the Time-of-Day Problem
Relative volume compares what has traded so far with what usually trades. The mistake is dividing a partial session by a full day.
Imagine a trader who checks Micro E-mini S&P 500 futures (MES) mid-morning and sees 550,000 contracts traded so far. Against an average session of about 1.1 million contracts, that is 0.50. Half a normal day. It looks quiet, the trader decides nobody is interested, and a perfectly good setup gets skipped.
The problem is that half the day has not elapsed in volume terms. A full-day average is the right base only at the close. At any earlier hour, the fair comparison is the volume a normal session has usually done by that same hour, which is something you can measure for your own market.
When Futures Volume Trades During the Session
Futures volume is not spread evenly across the Globex session, and the shape is measurable. This guide's own study used five-minute Micro E-mini S&P 500 (MES) bars for the continuous front-month contract from Yahoo Finance, grouped into CME Globex sessions (6:00 PM ET to 5:00 PM ET). The sample is 47 complete sessions from August 27 to November 3, 2026, excluding the shortened Labor Day session. For each session, the share of that session's volume traded before each clock time was calculated, then the median was taken across sessions. As a cross-check, the Yahoo total for the November 3 session landed within 0.3% of CME's own settlement volume for the December contract.
| Time (ET) | Share of MES session volume already traded (median of 47 sessions) |
|---|---|
| Before 8:30 AM | 18% |
| Before 9:30 AM | 22% |
| Before 10:30 AM | 43% |
| Before 12:00 PM | 63% |
| Before 2:00 PM | 81% |
| Before 4:00 PM | 98% |
Read that table slowly, because it changes how trading volume should be judged at almost every hour. In this guide's MES study, more than 14 hours of the Globex session run from 6:00 PM to 8:30 AM ET, and they produced about 18% of the volume. The single hour from 9:30 to 10:30 AM produced about 20%. The busiest five-minute bars in the sample were the 3:55 PM bar at 2.6% of the whole session and the 9:30 AM bar at 2.4%. That matches Chase's general observation that volume clusters right after the open and right before the close.
The spread around those medians is wide. In the same MES study, the share already traded by 12:00 PM ranged from 38% to 71% across the 47 sessions, which is why one day's read is a data point and not a verdict.
Now take a reading of 550,000 MES contracts traded so far, against an average session of 1,100,000. The time-adjusted base is that average multiplied by the share usually done by that hour.
| Clock time of the read (ET) | Expected volume by then | Unadjusted relative volume | Time-adjusted relative volume |
|---|---|---|---|
| 9:30 AM | 242,000 | 0.50 | 2.27 |
| 10:30 AM | 473,000 | 0.50 | 1.16 |
| 12:00 PM | 693,000 | 0.50 | 0.79 |
| 2:00 PM | 891,000 | 0.50 | 0.62 |
The same 550,000 contracts reads as more than double normal at 9:30 AM, slightly busy at 10:30 AM, and genuinely light at 2:00 PM. The unadjusted column says 0.50 every time, which is why it misleads. If your platform's relative volume tool divides by a full day, it is giving you the unadjusted column.
These shares come from one contract over one autumn sample. Your market and your season will differ, so treat the table as a demonstration of the method and measure your own instrument's profile.
Front-Month Volume and the Contract Roll
Futures add a third comparison stocks do not have: which contract month you are looking at. Volume concentrates in one month, and it moves.
As of the November 3, 2026 session, CME's settlement data showed 1,061,439 MES contracts traded in the December 2026 contract and 1,607 in March 2027. The December contract carried 99.8% of the day's MES volume. For the full-size E-mini S&P 500, December traded 1,579,232 contracts against 5,104 in March, a 99.7% share.
That concentration flips around the roll. CME sets the customary equity index roll date as the Monday before the third Friday of the expiration month, and says the expiring contract will have a less liquid market after it. For the December 2026 contracts, CME lists the expiration as December 18, 2026 and the roll date as December 14, 2026.
So if you keep watching the December contract after mid-December and volume seems to collapse, nothing is wrong with the market. The participants moved to March. Always read volume on the contract you intend to trade, and check that your chart is not quietly showing a different month.
Related lesson: When to roll a futures contract
Using Volume to Confirm or Question a Trend
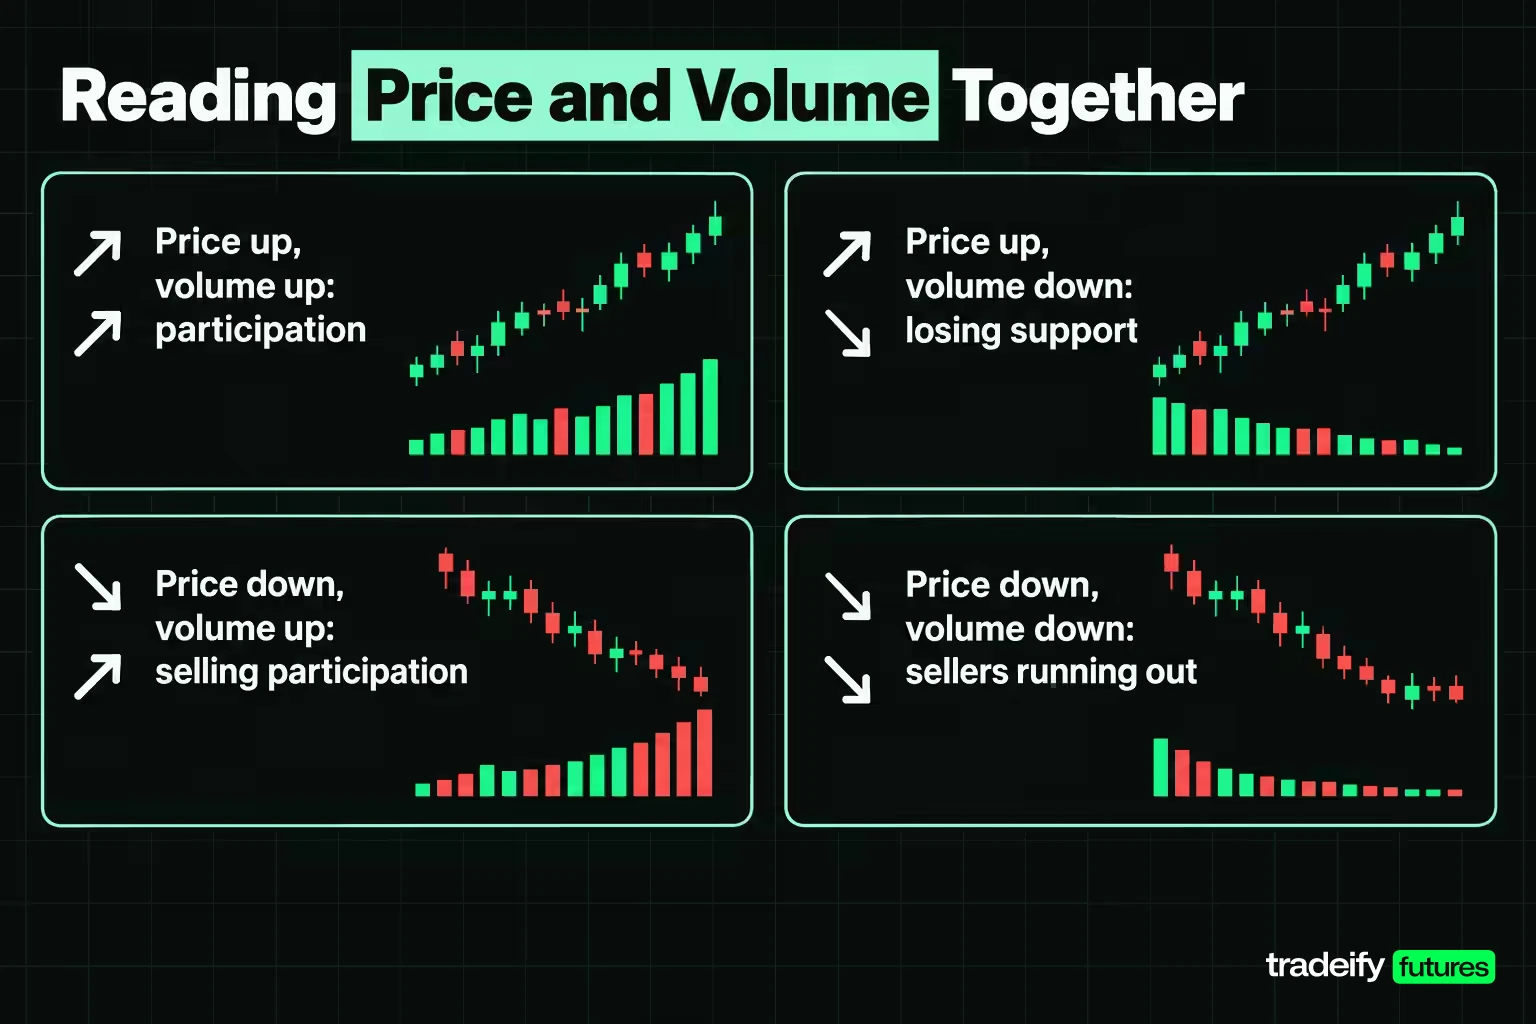
Trading volume is most often used as a second opinion on a price move. The logic is simple: a move that attracted heavy participation is harder to dismiss than one that happened while most participants were absent. The key word is "harder." Volume adds weight to a read; it does not make the read true.
TradingView's guidance on its Volume indicator summarizes the conventional reading: a breakout from a range with rising volume suggests strength, while a breakout on flat or falling volume carries more potential to fail. New highs or lows on shrinking volume can warn that a move is losing support.
| Price action | Volume | Conventional reading | What would change the read |
|---|---|---|---|
| Rising | Rising | Trend has participation behind it | Price stalls while volume stays high |
| Rising | Falling | Advance may be losing support | Volume returns on the next push higher |
| Falling | Rising | Selling has participation behind it | Heavy volume with price refusing to fall further |
| Falling | Falling | Decline may be running out of sellers | Volume expands on a new low |
The last column is the part most guides leave out. Every row is a hypothesis, and each one has a condition that would tell you it is wrong. If you cannot name that condition before the trade, you are using volume to feel better about a decision you already made.
Breakouts and Volume Confirmation
The breakout case is where volume earns its keep, and where traders most often misuse it. Price pushes through a level, a tall volume bar prints, and the urge to buy before it runs away is strong. The question that matters is whether the bar is tall for that time of day.
A breakout at 9:31 AM ET will almost always print a tall volume bar, because the first minutes of the cash session are among the busiest of the day. A breakout at 1:15 PM on the same relative bar height is a much stronger statement. Compare the breakout bar with the bars at the same time on prior sessions, or at least with the bars around it, before calling it confirmed.
The observation is the breakout. The confirmation is volume that is unusual for that hour, followed by price holding the level. The invalidation is price returning inside the old range, whatever the volume did.
Divergence and Exhaustion
Divergence is price making a new high or low while volume, or a volume indicator, does not. It is a warning, not a timing tool. Trends can run a long way on fading volume, and a trader who shorts every divergence will be early many times.
Exhaustion runs the other way. TradingView describes exhaustion moves as sharp price moves combined with a jump in volume that can mark the end of a trend: late participants pile in, and once they are in there is no one left to push. The tell is a climactic bar followed by price failing to extend. Without that failure, a big volume bar in a trend is just a big volume bar in a trend.
What Volume Reveals About Market Strength and Large Participants
Trading volume is often described as a window into what large participants are doing. It is a narrower window than that. Volume tells you how much participation a price move attracted. It does not tell you who participated, which side was the aggressor, or whether the large players were buying, selling or simply swapping inventory with each other.
Strength and weakness are where volume is most useful. A market that rallies on expanding volume and pulls back on shrinking volume is behaving the way a healthy advance usually behaves: participation shows up for the moves in the trend's direction and drifts away on the counter-moves. When that pattern inverts, with heavier volume on the pullbacks, the trend is at least being tested.
Accumulation and distribution are the classic stories told over volume. Accumulation is large buyers building a position without pushing the price far, which can show up as heavy volume while price moves sideways. Distribution is the reverse. The honest problem is that heavy volume in a sideways market looks the same either way on a volume bar. You find out which it was when price leaves the range.
Futures Volume Versus Open Interest and Micro Contracts
It helps to know how much of a futures market's volume is short-term turnover. As of the November 3, 2026 session, the December MES contract traded 1,061,439 contracts against open interest of 267,778, so the day's volume was about four times the number of contracts held open at the end of the session. Most of what trades in a day is positions opened and closed inside it.
Retail-sized contracts are not a sideshow either. CME reported that in October 2026, Micro E-mini equity index futures and options averaged 4.4 million contracts a day, 50% of its 8.8 million contracts of daily equity index volume. Those figures say nothing about who traded each micro contract, but they are a reminder that a volume spike in a micro contract is not automatically an institution moving.
Institutional activity does leave traces, mainly in where volume builds up by price and how price reacts when it returns to those areas. That is the job of the volume profile and VWAP, not the plain volume bar.
Volume Indicators and What Each One Measures
Volume indicators are formulas that combine trading volume with price. Each one answers a different question, and each one has a trap. Knowing the formula is how you tell the indicator's opinion apart from a measurement.
On-Balance Volume
On-balance volume (OBV), developed by Joseph Granville in 1963, is a running total. When a period closes higher than the previous close, that period's volume is added. When it closes lower, the volume is subtracted. When the close is unchanged, OBV stays flat.
A quick illustration with made-up numbers: day one closes up on 1,000,000 units, so OBV is 1,000,000. Day two closes down on 600,000, so OBV drops to 400,000. Day three closes up on 800,000, so OBV rises to 1,200,000.
The trap is that the absolute value means nothing. It depends entirely on the start date. Traders read the direction of OBV, especially when it disagrees with price, and a whole day's volume gets assigned to one side because of a one-tick change in the close.
Volume-Weighted Average Price
VWAP is the average price traded during the session, weighted by how much traded at each price. The formula divides the sum of price times volume by total volume, and it resets at the start of every session. Charting packages often approximate it with the typical price, (high + low + close) / 3, for each bar.
A small illustration: 100 contracts trade at 7,000, 300 at 7,002 and 100 at 7,004. Price times contracts sums to 3,501,000, divided by 500 contracts, so VWAP is 7,002. The simple average of the three prices is also 7,002 here, but only because the volume is symmetrical. Shift more volume to one price and VWAP moves toward it.
The trap is treating VWAP as a level the market must respect. Price often reacts near it intraday, but VWAP is still a description of what already traded, and it lags more as the session goes on.
Related lesson: VWAP explained
Volume Profile
A volume profile turns volume on its side. Instead of showing how much traded in each time period, it shows how much traded at each price over a chosen range. TradingView defines the point of control (POC) as the price with the highest traded volume in that period, and the value area as the range holding a set share of the volume, typically 70%.
Profiles are useful because they show where the market spent its time and effort. A price where a lot of volume traded is often a price where participants agreed on value, and price can stall there on a return. A thin area with little volume is often crossed quickly.
The trap is the range you choose. A profile anchored to today, this week or a hand-drawn swing will produce different POCs from the same data. Decide the anchor before you look, or you will pick the one that agrees with you.
Trade Volume Index
The Trade Volume Index (TVI) is a close cousin of OBV built on intraday price changes. It uses a minimum tick value (MTV), which Investopedia notes is typically set at 0.5. If the price change is larger than the MTV, the period's volume is added. If it is smaller than minus the MTV, the volume is subtracted. If the change falls between the two, TVI stays unchanged.
The trap is that TVI formulas vary between software packages, and the MTV setting changes the output. Two traders looking at "the TVI" on the same chart can see different lines. Check the setting, and treat TVI as one more opinion on the same raw volume, not new information.
Trading Volume in Entry, Exit and Sizing Decisions
Trading volume feeds three practical decisions: when to act, how much to trade, and what the trade will really cost. The first is the one everyone talks about. The other two are where volume quietly saves money.
For entries, volume is a filter on the setup you already have. A pullback entry in an uptrend is more interesting when the pullback happens on lighter volume than the push before it. A breakout entry is more interesting when the breakout volume is unusual for that hour. Neither is a reason to trade a setup you would otherwise skip.
For exits, volume is a warning light. A climactic volume bar after a long run, followed by price failing to extend, is a reason to tighten a stop or take part of a position. It is not proof that the trend is over.
For size, trading volume answers a simpler question: can the market absorb my order without moving against me? For most retail traders in a liquid front-month futures contract, the answer is plainly yes. Four MES contracts against a session that typically trades about 1.1 million contracts is 0.00036% of a day. Even 100 contracts is 0.009%. Your order is a rounding error in the flow.
That changes when you trade a thin contract, an expiring month, the overnight session or the minutes around a major data release. Volume and depth shrink, spreads can widen, and your fills get worse. That is where the cost side matters.
What Slippage Costs Against Your Risk
Slippage is the gap between the price you expected and the price you got. Thin volume is one of its causes. The useful move is to express it in R, the same unit as the risk you take on each trade.
Take an illustrative trade in MES. The contract moves in ticks of 0.25 index points, worth $1.25 each. On a $5,000 account risking 1%, the risk allowance is $50. A 10-tick stop is 2.5 points, worth $12.50 per contract, so the size is 4 contracts. A 20-tick target is worth $25.00 per contract, or $100.00 on 4 contracts, which is 2R. Assume $1.50 per contract round-turn commission, an illustrative figure rather than any broker's quote, so $6.00 on the trade, or 0.12R.
| Cost against the 2R target | Total on 4 contracts | Cost in R | Break-even win rate |
|---|---|---|---|
| No costs | $0.00 | 0R | 33.3% |
| Commission only | $6.00 | 0.12R | 37.3% |
| Commission plus 1 tick of slippage in total | $11.00 | 0.22R | 40.7% |
| Commission plus 2 ticks of slippage in total | $16.00 | 0.32R | 44.0% |
| Commission plus 4 ticks of slippage in total | $26.00 | 0.52R | 50.7% |
The break-even win rate is (1 + costs in R) divided by (1 + the target in R). With no costs, a 2R target breaks even at 33.3%. Four ticks of total slippage, which a stop can hit in a fast market, pushes the bar past 50%.
Over a sample, that compounds. A strategy that wins 45% of the time at 2R, with no costs, makes 35R over 100 trades. With 0.22R of friction per trade it makes 13R. At 0.32R it makes 3R. At 0.52R it makes -17R. The setup did not change. The cost of trading it did.
This is why trading volume belongs in a pre-trade check rather than only in chart analysis. A thin session does not have to change your direction call. It can still change whether the trade is worth taking at your size.
Related lesson: Slippage explained
A Worked Volume Example on Micro E-mini S&P 500 Futures
This worked trading volume example is hypothetical. It strings the pieces of a volume read into one decision so you can see the order the questions come in.
Imagine a trader watching MES at 10:30 AM ET. The December contract has traded 550,000 contracts so far. Price has spent the morning inside a range and has just pushed above the range high on a five-minute bar that is visibly taller than the bars around it.
The first instinct is to call the session quiet, because 550,000 is half of a 1.1 million contract average. The time adjustment says otherwise. By 10:30 AM, a typical session in the 47-session sample had done about 43% of its volume, so the expected figure is about 473,000. Adjusted relative volume is 1.16, a slightly busy morning rather than a dead one.
Next comes the breakout bar. At 10:30 AM, the trader compares it with the bars at the same time on the last few sessions rather than with the opening bars, which are always tall. If it is clearly larger, the breakout has unusual participation. If it is about average for that slot, the "volume confirmation" is just the clock.
Then cost. With a 10-tick stop at $12.50 per contract and a 4-contract size, each tick of slippage is $5.00 across the position, or 0.10R. At mid-morning in the front month, the trader expects fills close to the plan. The same setup at 2:00 AM ET, inside the overnight stretch that produced about 18% of the volume across more than 14 hours, would deserve a smaller size or a pass.
Finally, the invalidation. If price slips back inside the range, the breakout read is wrong, whatever the volume bar said. That is the moment to take the stop, not to argue that the volume was strong. The volume read informed the decision; it did not replace the stop.
A Five-Step Volume Check Before Sizing a Trade
This check fits in a pre-trade routine and takes about a minute once your chart is set up.
- Confirm the contract. Name the instrument and the contract month. In the days around an equity index roll, check that you are reading the month you intend to trade.
- Fix the time frame. Decide whether you are reading a one-minute bar, a five-minute bar or the running session total, and keep that frame for the rest of the check.
- Compare with the same hour. Divide current volume by the volume normally done by this time of day, not by a full day's average.
- Price the friction. Multiply your expected slippage in ticks by the tick value and your size, add commission, and divide by your dollar risk to get the cost in R.
- Decide what changes. If volume is normal or better and the cost is small in R, volume is not your problem. If volume is thin for the hour, reduce size or wait, before entry rather than on the exit.
If those five steps feel like less analysis than you expected, that is the point. Volume is a check on whether the market can hold your order at the price you planned. It is rarely a signal on its own.
Related lesson: Position sizing
What a Volume Number Cannot Tell You
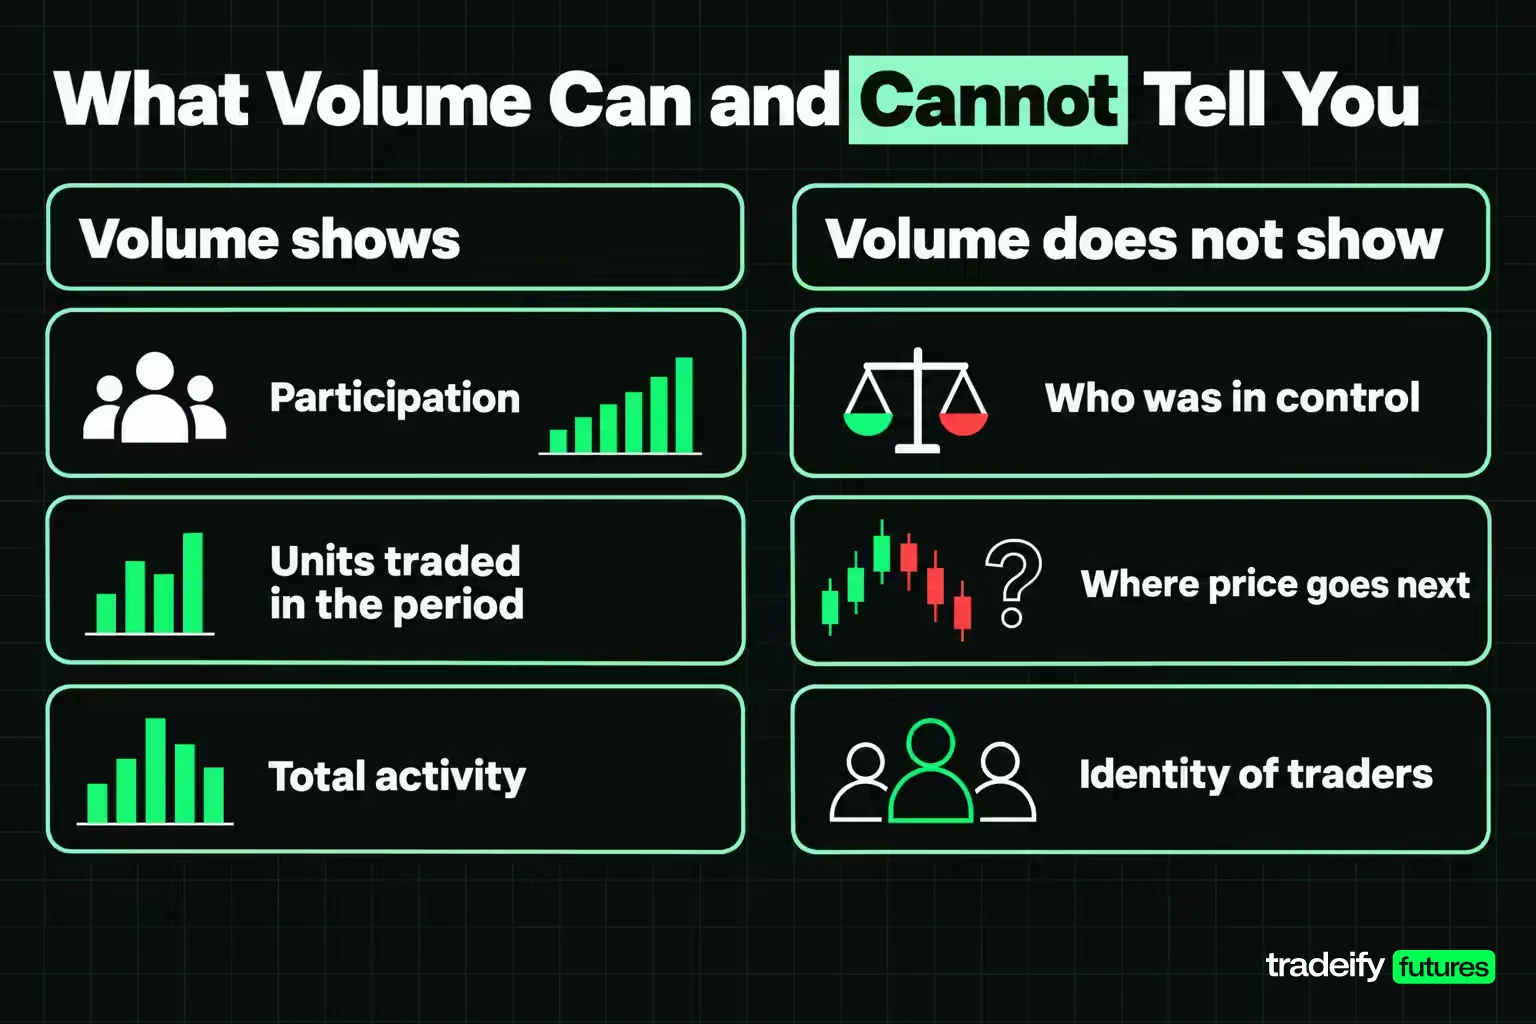
Every row in this table is something volume is widely said to reveal, next to what the number actually contains. Most bad volume analysis lives in the gap between the two columns.
| What volume is said to reveal | What the volume number actually contains |
|---|---|
| How many buyers were in the market | One count per unit traded, with a buyer and a seller on every fill |
| Whether buyers or sellers were in control | No aggressor field; the count is identical either way |
| That a move is confirmed | Participation in a move that already happened |
| Where price goes next | Nothing; volume is recorded after trades are matched |
| That the market can absorb any size | A total for the period; depth and spread at each price are separate readings |
| That institutions are active | Total participation, with no identity attached |
The pattern across every row is the same. Trading volume measures participation. It does not measure intent, direction or follow-through. It becomes genuinely useful when you read it against price location, against the clock and against the size of your own order.
That is also why volume does not predict price. A big volume bar often marks a reaction to news that has already been published. By the time it prints, the information that caused it is in the price.
Related lesson: How the order book works
Common Questions About Trading Volume
What is a good trading volume?
A good trading volume is volume that is normal or better for that instrument at that time of day, in the contract you trade. It also needs to be large enough that your order is a tiny fraction of what trades. There is no universal threshold, because a share count and a contract count are different units.
Is high trading volume bullish or bearish?
Neither. Every unit traded has a buyer and a seller, so a heavy session can be accumulation, liquidation or large participants swapping inventory. High volume tells you a price move had participation behind it, which is a statement about the move that already happened.
How do you check volume in TradingView?
Open a chart, click Indicators, search for "Volume" and add the built-in Volume indicator. It appears as bars under the price panel. You can add a moving average of volume in the indicator settings to see which bars are unusual.
How much do day traders with $100,000 accounts make per day on average?
There is no reliable published average, and any single daily figure would be misleading. The best long-run evidence points the other way: a study by Chague, De-Losso and Giovannetti of Brazilian equity index futures day traders found that 97% of the 1,551 who kept trading for more than 300 days lost money. Treat any per-day income figure you see online as marketing rather than data.
Who owns 88% of the stock market?
The wealthiest 10% of U.S. households. As of the second quarter of 2026, Federal Reserve Distributional Financial Accounts data put the top 10% share of corporate equities and mutual fund shares at about 88%, against 0.6% for the bottom half. Ownership is not trading volume; a small group can own most shares while a much wider group trades them.
What is the 7% rule in stocks?
It is a stock-selling rule popularized by Investor's Business Daily: sell a stock if it falls 7% to 8% below your purchase price. IBD says the rule comes from its study of over 130 years of market history. It is a loss-cutting rule for stock positions, not a volume rule, and it does not translate directly to intraday futures stops.
How to Track Trading Volume in Your Trading Journal
Trading volume becomes useful once you stop reading it by eye and start comparing it with a baseline you measured. Before the session, write down the instrument, the contract month, the time frame you read and the hour-of-day base you compare against. Then log the adjusted relative volume next to every trade in your journal.
After 20 or 30 sessions, two things usually show up. Most days the adjusted read lands near normal, and the volume bar tells you nothing your plan did not already know. That is a real answer, and a better one than a signal you talked yourself into. The genuinely unusual sessions stand out, and those are the ones worth studying, because participation changed and your size may need to change with it.
On our accounts, the Help Center guidance follows the same logic: trade the front-month contract, which carries the highest volume and tightest spreads, and treat a contract trading under 1,000 contracts a day, or with spreads wider than 1-2 ticks, as a red flag. On Tradovate, the Time & Sales module shows each trade's size, the session's total volume and a volume filter for larger prints. Level 2 depth is a paid add-on bought from Tradovate and is not available on Rithmic accounts. Every position closes by 4:45 PM ET, so the volume that matters is the session you are trading in.
Related lesson: Time and sales
This guide is educational and is not financial advice or a recommendation to trade any instrument. Futures are leveraged, and losses can exceed what you expect or what you planned to risk. Volume, slippage and cost figures here are illustrative or dated measurements, not quotes, and evaluation and funded accounts are simulated. Past patterns in volume, including the intraday study shown, do not guarantee how any future session will trade.


