




TL;DR: Market price meaning: the price of the most recent trade, like a stock's last sale, not a quote you can still get. Order books, opening and closing auctions and dealers set it, while supply, demand, costs, rates and news move it. A market buy pays the offer, so 4 MES contracts in a thin illustrative book paid 0.1875 points over the mid. It differs from market value, fair value (an IFRS 13 exit price), the settlement price and the retail price.
The number in the corner of a trading screen is a receipt, not a quote. It tells you what someone paid a moment ago. It does not tell you what you will pay if you click now, and in a fast market those two numbers can sit several ticks apart.
That gap is where good plans leak money. A trader reads 7000.25 on the chart, buys at market and gets 7000.50. Or a buy limit sits at the last printed price, which was actually the offer, so it never fills while the market walks away. Neither mistake is exotic. Both come from treating one number as if it were the whole price.
This guide covers the market price meaning in plain terms, how markets determine a price, how the arithmetic works in an auction and an order book, what moves prices in stocks, futures, bonds, currencies and commodities, how businesses use market-based pricing, and how market price differs from market value, fair value and retail price. Nothing here is a recommendation to buy or sell anything.
Market Price Meaning in Plain Terms
Market price is the price at which an asset, good or service most recently changed hands between a willing buyer and a willing seller. Nasdaq's glossary puts it in one line for securities: the last reported price at which a security was traded on an exchange.
Two parts of that definition do the work.
Market price is historical. It records a trade that already happened. The SEC's investor education site makes the consequence explicit: the last-traded price is not necessarily the price at which a market order will be executed. Your order is a new transaction, priced against whatever buyers and sellers are showing when it arrives.
Market price is specific. It belongs to one asset, one place and one moment. The same share can print slightly different prices on different venues within a second. On futures the contract month matters as much as the symbol, so the December and March contracts on the same index carry different market prices.
Market price is also not a fixed property of the thing being traded. The CFTC's glossary describes how a price level gets found: through the interaction of buyers and sellers, based on supply and demand conditions. When buyers become more eager, offers get taken and the market price rises. When sellers press, bids get hit and it falls.
The phrase also turns up far from trading floors. A restaurant menu that lists a lobster at "market price" means the same thing in a looser form: the kitchen charges whatever that week's catch costs, because supply moves too much to print a fixed number. Same idea, less precision.
Related lesson: How financial markets work
The Prices Behind One Market Price Quote
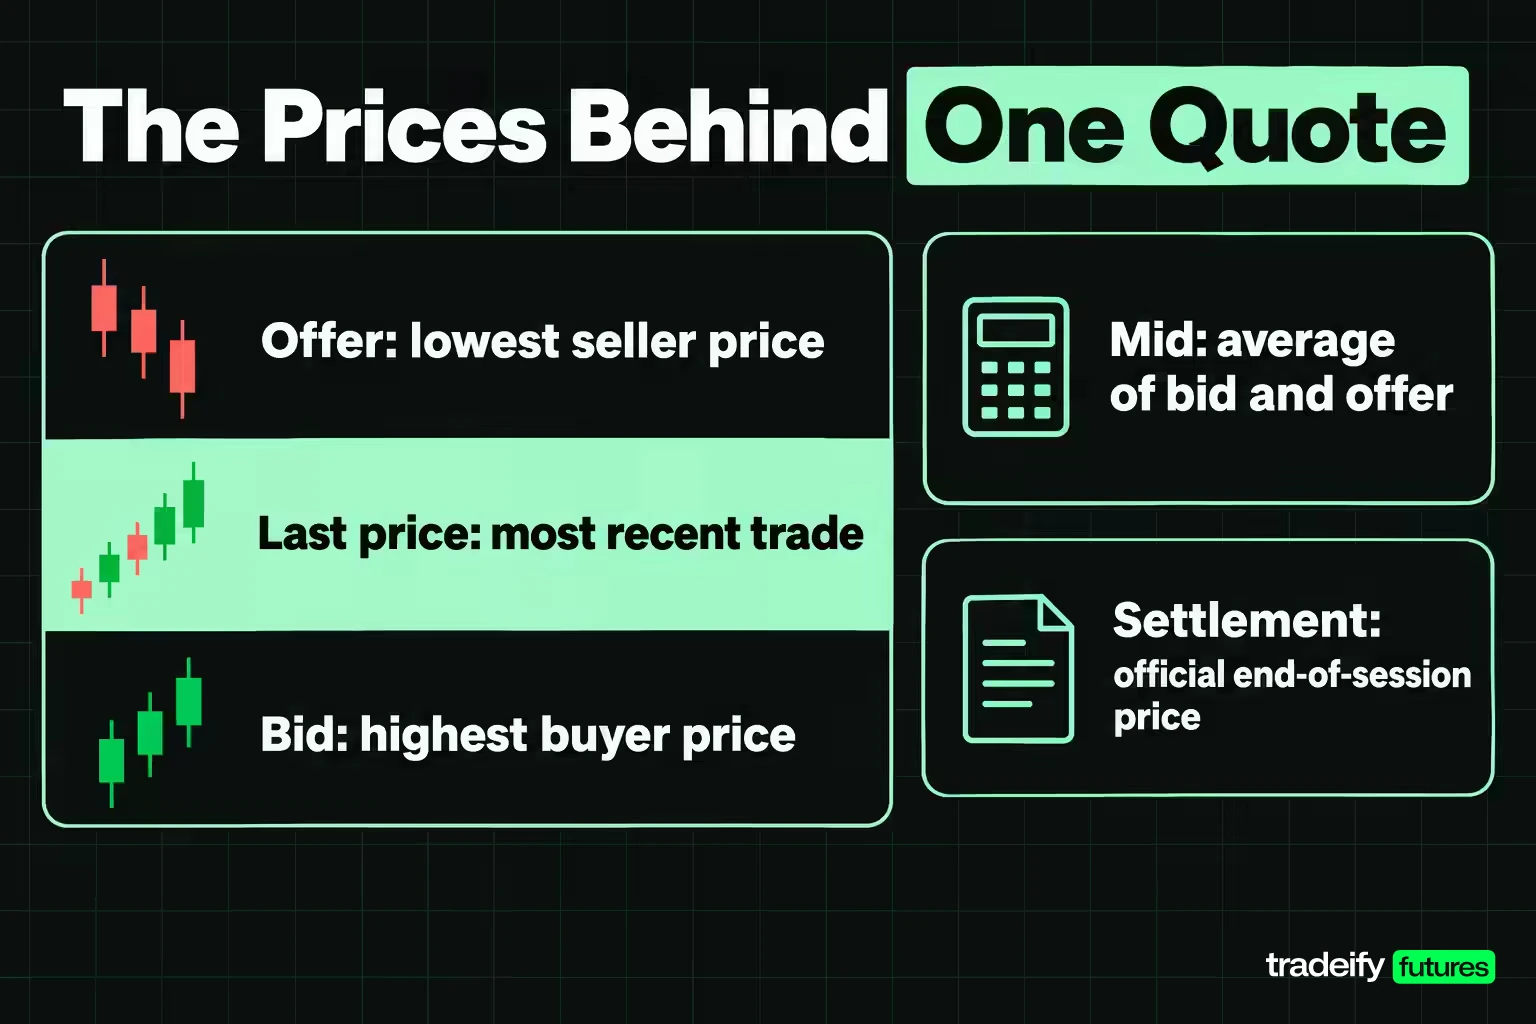
A trading platform shows several prices at once, and they carry different labels because they mean different things. Reading the market price correctly starts with knowing which number is which.
| Price on the screen | What it is | What it decides for you |
|---|---|---|
| Last price (market price) | The price of the most recent executed trade | What the chart draws and what your result is measured against |
| Bid | The highest price a buyer is currently showing | Roughly what a market sell order can get |
| Offer (ask) | The lowest price a seller is currently showing | Roughly what a market buy order will pay |
| Mid | The average of the best bid and best offer | A yardstick for execution quality, not an order price |
| Mark price | A platform's valuation of an open position | How unrealized profit and loss is shown while you hold |
| Daily settlement price | The official end-of-session price set by the exchange | Daily margin, variation and the official daily change |
The CFTC's glossary defines a bid as an offer to buy a specific quantity at a stated price, an offer as an indication of willingness to sell at a given price (also called the ask), and the bid-ask spread as the difference between the two. Those are orders. Only a trade between them produces a market price.
Settlement and mark-to-market prices
The settlement price belongs to a different job. The CFTC defines it as the daily price at which the clearing organization clears all trades and settles all accounts between clearing members, and it is used for margin calls and delivery invoices. Mark-to-market is the daily cash flow system that uses those end-of-session prices to add gains to, or subtract losses from, each account.
Here is the important part. The market price tells you where trading happened. The bid and offer tell you where you can trade next. The mid tells you how well you traded. The mark and the settlement tell you how the account is valued. Keeping those roles apart heads off most "the platform is wrong" complaints before they start.
Related lesson: Last price mark price and mid price
How the Market Determines a Price
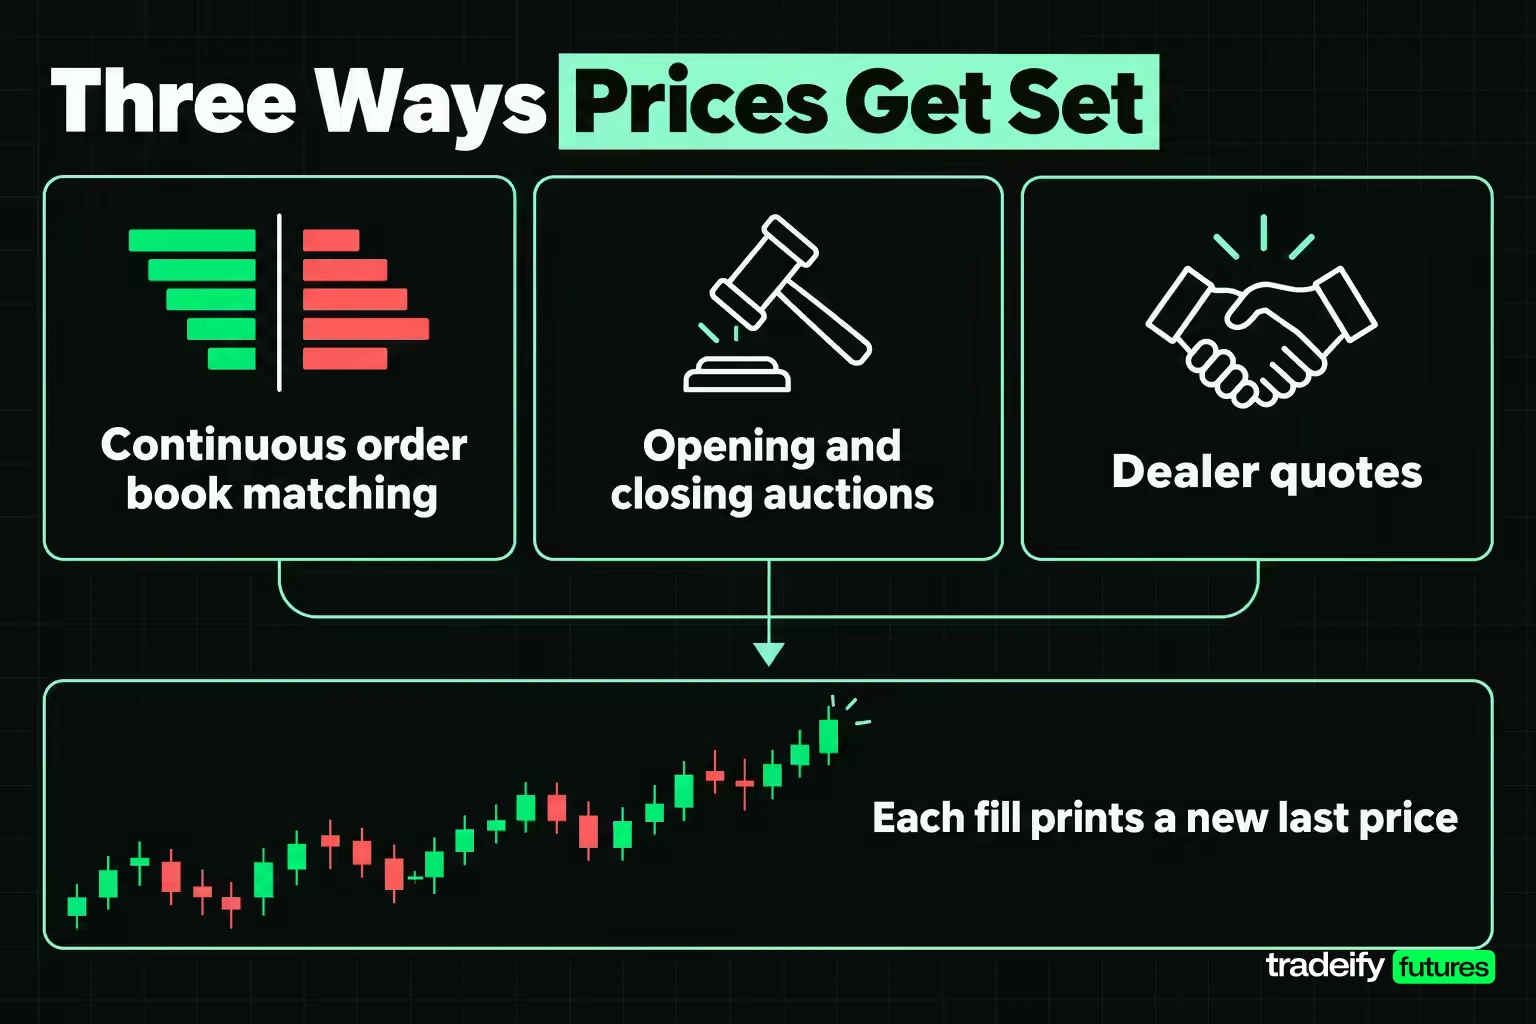
Markets determine a price through a few distinct mechanisms, and the same asset can pass through more than one of them in a single day. If you only ever look at the chart, they all look alike. Knowing which one is in charge at a given moment explains why prices behave differently at the open, mid-session and at the close.
Continuous order book matching
Most futures and listed stocks trade on electronic order books for most of the day. Buyers post bids, sellers post offers, and a matching engine pairs them. The CFTC calls this a matching algorithm: a set of rules, encoded in software on electronic markets, that decides when and if bids and offers are matched.
In a continuous book, a market price is set every time someone accepts a resting order. A buyer who wants to trade now pays the lowest offer. A seller who wants out now hits the highest bid. Each of those fills prints a new last price, so the market price drifts toward whichever side is more impatient.
Opening and closing auctions
At certain moments exchanges stop matching orders one by one and run a single-price auction instead. Orders gather, and the exchange looks for the one price at which the most volume can trade.
CME Globex publishes an Indicative Opening Price during its pre-open, which it describes as the probable price where most volume will occur at the open. Its first rule is to pick the price level with the maximum matching quantity, with tie-break rules that look at leftover quantity and, if needed, the prior settlement price.
The New York Stock Exchange runs the same kind of auction for listed stocks. On its published timeline the opening auction process begins at 9:30 AM, market-on-close and limit-on-close entry is cut off at 3:50 PM, and the closing auction executes at 4:00 PM. Its Indicative Match Price is the best price at which the maximum volume of shares can trade in that auction.
Dealer markets and negotiation
Not every price comes from a central book. In many bond and currency markets, and in private deals, a dealer quotes a bid and an offer and the customer accepts or negotiates. For stocks, the SEC notes that a broker may route an order to an exchange, a market maker, an electronic network or its own inventory. The market price that results is still a real trade price, but it may never appear on a single public screen.
Floor trading and posted prices
The CFTC describes open outcry as a public auction on a trading floor, which at most exchanges has been largely replaced by electronic trading. Retail markets work the other way: the seller posts a price, and buyers decide whether to pay it. That posted price becomes a market price only when someone actually buys at it, which is why stores mark goods down when shelves stop clearing.
Official settlement prices
The exchange also sets a price after trading winds down. CME Rule 813 says daily settlement prices are determined each business day by one or more procedures, including the volume-weighted average price of the settlement period and the bid/ask midpoint at the settlement time. The result must be a valid tick, rounded to the nearest tick or the tick closer to the previous day's settlement. Which procedure applies depends on the product, its activity and its liquidity during the settlement window.
Related lesson: How trade execution works
How Market Price Is Calculated From Buyers and Sellers
The market price is not calculated with a formula you can solve in advance. It comes from matching real orders, and the arithmetic of that matching is easy to follow on a small example. The examples here use the Micro E-mini S&P 500 (MES) future, which CME specifies as $5 times the S&P 500 Index, with a minimum tick of 0.25 index points worth $1.25 per contract. All prices are illustrative round numbers near 7,000, not quotes.
Market price in an opening auction
Supply and demand curves in a textbook are just lists of how much people will buy or sell at each price. An auction book is that list made real. Here is an illustrative pre-open book.
| Auction price | Buy orders willing to pay this or more | Sell orders willing to accept this or less | Contracts that can trade |
|---|---|---|---|
| 6999 | 60 | 15 | 15 |
| 7000 | 60 | 35 | 35 |
| 7001 | 30 | 60 | 30 |
| 7002 | 10 | 60 | 10 |
The buy side holds limits of 10 contracts at 7002, 20 at 7001 and 30 at 7000. The sell side holds 15 at 6999, 20 at 7000 and 25 at 7001. At each candidate price, the tradable quantity is the smaller of willing buyers and willing sellers.
Applying the CME rule of maximum matching quantity, the opening price is 7000, where 35 contracts trade. At 6999 sellers are scarce. At 7001 buyers thin out. The market price is the point where the two lists overlap most, which is the textbook equilibrium price showing up in an actual order book.
Notice what is left over. At 7000, 60 contracts were bid but only 35 traded, so 25 contracts of buy orders remain unfilled. That leftover demand is information. It tells the next seller there are buyers waiting at 7000, and it often shapes the first few minutes of continuous trading.
Market price in a continuous order book
Once continuous trading starts, the book looks like this illustrative MES ladder.
| Bid price | Bid size | Offer price | Offer size |
|---|---|---|---|
| 7000.00 | 5 | 7000.25 | 3 |
| 6999.75 | 18 | 7000.50 | 12 |
| 6999.50 | 30 | 7000.75 | 25 |
| 6999.25 | 60 | 7001.00 | 40 |
The best bid is 7000.00 for 5 contracts and the best offer is 7000.25 for 3. The spread is 0.25 points, one tick, worth $1.25 per contract. The mid is 7000.125, half a tick between the quotes, which is a measuring stick rather than a price anyone can trade.
Now send market orders into that book. Each one walks the offers until it is filled, and the average price depends on size.
| Market order | How it fills | Average price | Cost versus the mid |
|---|---|---|---|
| Buy 1 | 1 at 7000.25 | 7000.25 | 0.125 points, $0.625 per contract |
| Buy 4 | 3 at 7000.25, 1 at 7000.50 | 7000.3125 | 0.1875 points, $3.75 on the order |
| Buy 12 | 3 at 7000.25, 9 at 7000.50 | 7000.4375 | 0.3125 points, $18.75 on the order |
| Buy 20 | 3 at 7000.25, 12 at 7000.50, 5 at 7000.75 | 7000.525 | 0.40 points, $40.00 on the order |
| Buy 25 | 3 at 7000.25, 12 at 7000.50, 10 at 7000.75 | 7000.57 | 0.445 points, $55.63 on the order |
| Sell 25 | 5 at 7000.00, 18 at 6999.75, 2 at 6999.50 | 6999.78 | 0.345 points, $43.13 on the order |
Two lessons come out of that table. Size is a price decision, not only a risk decision: one contract pays half a tick against the mid, while 25 contracts pay about 1.78 ticks before the trade has gone anywhere. And the market price printed after each order is your own last fill. When the chart shows a two-tick jump, it is fair to ask who paid for it. Sometimes the answer is you.
That is also the plain answer to what selling at market price means. A market sell does not get the last price. It takes the bids from the top down, 7000.00 first, then 6999.75, and its average lands wherever the size runs out.
What a round trip costs against the chart price
Take the 4-contract buy. The entry averages 7000.3125. The mid then rises exactly one point, to 7001.125, and the best bid moves to 7001.00. You close all 4 at market at 7001.00, assuming at least 4 contracts are bid there.
| Line | Measured at the mid | Measured at the fills |
|---|---|---|
| Entry | 7000.125 | 7000.3125 |
| Exit | 7001.125 | 7001.00 |
| Move per contract | 1.00 point, $5.00 | 0.6875 points, $3.4375 |
| Gross on 4 contracts | $20.00 | $13.75 |
| Illustrative cost at $2.00 per round turn | $8.00 | $8.00 |
| Net | $12.00 | $5.75 |
| Share of the chart move kept | 60% | 28.75% |
The chart said one point. The account got 0.6875 of it. Nothing was mispriced. The trader crossed the spread twice and took one extra level on the entry, and that cost $6.25, or $1.5625 per contract, which is 1.25 ticks.
Three lessons from the round trip
Three things are worth keeping from the 4-contract MES round trip.
- Execution drag ($6.25) was close to the illustrative cost on the same trade ($8.00). Fees appear on a schedule and are easy to plan for. The price of crossing the book does not, and it is the cost most traders never measure.
- The illustrative $2.00 round turn equals 1.6 MES ticks. A one-tick winner at $1.25 per contract does not cover it, so tick value and cost have to be compared in the same units.
- A passive buy limit at 7000.00 would have been 0.3125 points better than the market average, $6.25 across the order. The tradeoff is real: that limit may never fill if the market leaves without it.
What would change the conclusion: more size resting at the best offer makes the market order cheaper, a wider spread or faster tape makes it worse, and bigger orders make depth a larger share of the cost than the spread.
Related lesson: The order book
Factors That Influence Market Price
Every market price is the visible result of forces pushing buyers and sellers toward or away from a trade. Some act slowly over months, some within a second of a headline. These are the main factors that influence market price, and how each one tends to show up.
Supply, demand and cost factors
- Supply. More of something for sale, at the same demand, pushes the price down. A bumper harvest, a new share issue or a flood of sellers into an order book all add supply.
- Demand. More buyers chasing the same supply pushes the price up. In an order book, rising demand looks like offers getting lifted faster than sellers replace them.
- Production costs. For goods and commodities, the cost of producing one more unit sets a soft floor over time. If the market price sits below that cost for long, producers cut output and supply shrinks.
- Competition. The more sellers offering close substitutes, the less pricing power any one of them has. A single seller of something scarce can ask more, and a crowded market drives quotes toward each other.
Market and information factors
The remaining factors come from the market itself rather than from the goods being traded.
- Information and expectations. Prices move on what traders expect, not only on what has happened. Scheduled releases such as inflation or jobs data can reprice markets in seconds, because the new number changes expectations for growth, rates and earnings.
- Interest rates. Rates change what future cash flows are worth today. The SEC's bond guide notes that when rates rise, older bonds paying lower rates sell at a discount. Rate moves also feed into stock valuations and currency prices.
- Liquidity. The CFTC describes a liquid market as one where buying and selling can be done with minimal effect on price. In a thin market, a single order can move the market price several ticks, as the order book example in this guide shows.
- Taxes, subsidies and distribution costs. The Bureau of Labor Statistics notes that the prices sellers receive and the prices buyers pay can differ because of government subsidies, sales and excise taxes and distribution costs.
- Seasonality and events. Weather, harvest cycles, holidays and supply disruptions move commodity and retail prices on a recurring calendar, and one-off events (a strike, a refinery outage) can move them abruptly.
- Sentiment. Fear and greed are not rational inputs, but they move order flow. A market can trade far from where fundamentals suggest for a while because everyone is leaning the same way.
The useful habit is to ask which factor is doing the work right now. A price falling on a supply shock behaves differently from one falling on thin liquidity at lunchtime, even if the chart looks the same.
That distinction matters most when you feel the urge to chase. A sharp move on fresh information may keep going because expectations changed. A sharp move in a thin book can reverse as soon as normal size returns. Same candle, different trade.
Related lesson: What is liquidity
Market Price in Financial Markets
Market price works the same way across financial markets in principle, since it is always the last trade between a buyer and a seller. In practice, each market has its own quoting conventions and its own reasons a screen price can mislead.
Stock market prices
For a listed stock, the market price is the last sale reported on the consolidated tape. The SEC notes that quotes are only good for a specific number of shares, so a larger order may fill at worse prices than the one shown. Brokers may route orders to different venues, which is one reason two traders can buy the same stock in the same second at slightly different prices.
The closing price is often set by an auction rather than the final continuous trade. On the NYSE, the closing auction executes at 4:00 PM, after market-on-close entry is cut off at 3:50 PM.
Futures market prices
A futures market price is the last trade in one specific contract month on the exchange's book. Prices move in fixed ticks set by the contract, so the MES can only trade in steps of 0.25 index points.
Futures add two official prices that matter more than the last trade for account accounting. The daily settlement price, set under exchange rules such as CME Rule 813, drives daily margin and mark-to-market. And on many contracts the CFTC describes price limits, the maximum advance or decline from the previous day's settlement permitted in one session, which can stop the market price from moving further even when orders keep arriving.
Bond market prices
A bond's market price is usually quoted as a percentage of face value, and it moves opposite to interest rates. When new bonds pay more, an older bond with a lower coupon has to sell at a discount to compete, which is the SEC's point about rising rates. Many bonds trade through dealers rather than on a public book, so the market price can be harder to see and less frequently updated than a stock's.
Currency market prices
A currency's market price is always a ratio: how much of one currency buys one unit of another. Most spot currency trading happens through dealer networks rather than one central exchange, so the price you see depends on the venue or dealer quoting it. Currency futures, by contrast, trade on an exchange book with a published last price and a daily settlement, like any other futures contract.
Related lesson: Bond prices vs yields
Market Price in Commodity Markets
Commodity markets carry more than one market price for the same physical good, and the gap between them carries real information. The CFTC's glossary separates them clearly.
- Spot or cash price. The price at which a physical commodity for immediate delivery is selling at a given time and place. A grain elevator's bid for corn delivered today is a cash price.
- Futures price. The price of a standardized contract for delivery in a future month, traded on an exchange. It reflects where buyers and sellers expect value to be at that date, plus storage and financing.
- Basis. The difference between the local cash price and the nearest futures price, usually calculated as cash minus futures.
Here is an illustrative example. A local elevator bids $4.10 per bushel for corn while the nearby futures contract trades at $4.30. The basis is -$0.20, which the grain trade would call "20 cents under". If local supply tightens, the elevator may raise its bid and the basis narrows even if futures do not move. That is why a farmer and a futures trader can both say "the corn price" and mean different numbers.
Commodity prices also respond to factors that stocks rarely feel directly: weather, planting and harvest seasons, storage capacity, shipping costs and quality grades. A barrel of crude in one location and a barrel in another are not identical goods, and their market prices reflect that.
Exchange contracts turn those physical prices into a standard unit. CME's Micro Gold future covers 10 troy ounces with a minimum tick of $0.10 per ounce, worth $1.00, so a $1.00 move in the gold price changes one contract's value by $10.
Related lesson: Commodity spot vs futures prices
Real-World Market Price Examples
The market price meaning becomes clearer when you see the same idea in places that have nothing to do with a chart. Each example below shows who sets the price and what makes it move.
- The "market price" item on a menu. Seafood restaurants list some dishes at market price because the cost of the catch changes week to week. The server tells you tonight's number, which reflects what the kitchen paid at the dock.
- A used car. There is no exchange, so the market price is whatever recent comparable cars actually sold for. Asking prices on listings are offers, not market prices, until someone pays them.
- A house. A home's market price is set when a buyer and seller agree. Appraisals and listing prices are estimates of value; the recorded sale is the market price.
- Gasoline at the pump. A station posts a price and drivers either fill up or drive on. That posted retail price sits on top of wholesale fuel costs, taxes and the station's margin, so it moves after wholesale prices, not with them.
- A share of stock. The last sale on the tape is the market price, but a buyer pays the offer and a seller gets the bid.
- A futures contract. The last trade in one contract month is its market price, while the exchange's daily settlement price is the one that moves money between accounts.
The common thread is that a market price is always an agreed transaction. Listing prices, appraisals and screen quotes are invitations to trade. They become market prices only when someone accepts.
Market-Based Pricing Strategy for Businesses
Market-based pricing, also called market-oriented or competitive pricing, is a strategy where a business sets its price by looking at what customers already pay for similar products, rather than starting from its own costs. It answers a simple question: what is the going rate, and where do we want to sit relative to it?
Here is an illustrative example. A new coffee shop finds that three nearby cafes charge $4.50, $5.00 and $5.50 for a latte. Pricing at $5.00 places it in the middle of the range, where customers are unlikely to see it as either cheap or expensive. Pricing at $4.50 competes on price; pricing at $5.50 signals a premium and has to be backed by quality, speed or experience.
The strategy usually runs in four steps.
- Find comparable products and the prices customers actually pay for them.
- Decide on a position: below, at, or above the market.
- Check that the chosen price still covers costs with an acceptable margin.
- Watch competitors and demand, and adjust when the market moves.
The upside is real. Prices feel familiar to customers, the business is less likely to price itself out of the market, and it is quick to set up because the market has already done much of the research.
So is the downside. A business that copies the market can end up below its own costs if its costs are higher than competitors'. It can start price wars when everyone reacts to everyone else. And it can leave money on the table if its product is genuinely better but priced as if it were average.
Traders meet the same logic from the other side. An exchange order book is market-based pricing at full speed: every seller decides whether to sit at the best offer, undercut it by a tick, or wait higher, based entirely on what others are quoting.
Market Price vs Market Value, Fair Value and Retail Price
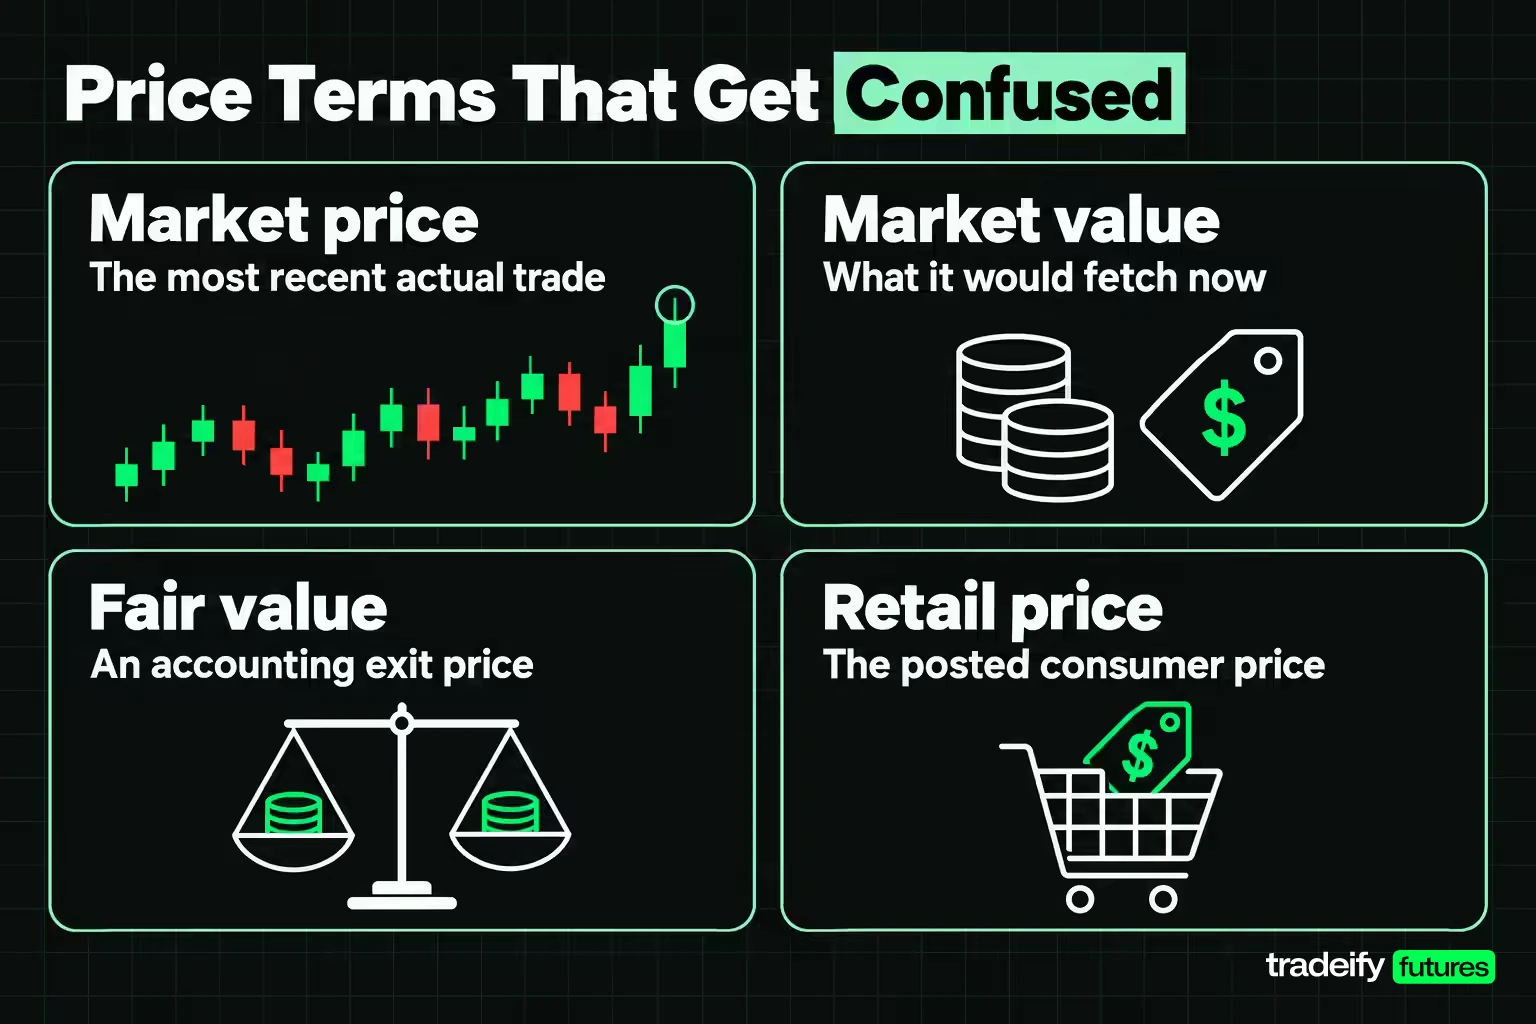
Market price is easy to confuse with several neighboring terms, and the difference often changes a decision. These comparisons answer the common question of how price differs from market value.
| Term | What it means | How it relates to market price |
|---|---|---|
| Market price | The price of the most recent actual trade | The observed transaction |
| Market value | What an asset would fetch if sold now | For a liquid security, usually estimated from the market price |
| Fair value | An accounting exit price in an orderly transaction between market participants | Equals a quoted market price when one exists for the identical asset |
| Equilibrium price | The theoretical price where supply equals demand | Where the market price tends to settle in a stable market |
| Retail price | The posted price a consumer pays at the end of a supply chain | Sits above wholesale market prices by taxes, distribution and margin |
Market price vs market value and fair value
Market price vs market value. For a liquid stock or future, the last trade is the best available estimate of what you could sell for, so the two numbers are usually close. For a house, a private business or a large block of shares, market value depends on assumptions, and two people can agree on the last sale price yet disagree on the value.
Market price vs fair value. IFRS 13 defines fair value as the price that would be received to sell an asset or paid to transfer a liability in an orderly transaction between market participants at the measurement date, an exit price. Where a quoted market price exists for the identical asset, it is the strongest evidence of fair value. Where it does not, fair value is estimated with models and inputs.
Market price vs equilibrium and retail price
Market price vs equilibrium price. Equilibrium is the price at which the quantity buyers want equals the quantity sellers offer. The opening auction example in this guide finds exactly that point in an order book. In continuous trading the market price can sit away from equilibrium for a while, when news, emotion or thin liquidity push it around.
Market price vs retail price. The BLS draws this line in how it measures prices. Its Producer Price Index tracks selling prices received by domestic producers, from the seller's perspective, while the Consumer Price Index tracks prices from the purchaser's perspective. The two differ because of subsidies, sales and excise taxes and distribution costs. A wholesale market price for coffee beans and the retail price of a bag on a store shelf are both real, but they are different prices at different points in the chain.
A Market Price Check Before You Place an Order
A market price only becomes useful when it changes what you do. This six-line check takes under a minute and answers the question the chart cannot: what price will this order actually trade at?
| Check | What you look at | A pass means |
|---|---|---|
| Spread in ticks | Best bid and best offer | One tick on a liquid index future; wider means a thinner book or a worse moment |
| Size at the touch | Contracts resting at the best bid and offer | Your size fits at the best price, or you already know how far it will walk |
| Your size against the book | Order size versus displayed size | A market order of your size takes one level, not four |
| The last trade | Time and price of the most recent print | The print is recent and sits inside the current spread |
| Order type against the reference | A limit against the bid or offer, a stop against its trigger | A buy limit is at or below the bid, and a stop is understood as a trigger, not a fill |
| Cost against target | Round-turn cost versus target, both in dollars | The target is clearly worth more than the round trip costs |
Run that on your next five trades. If entries keep landing worse than the price on the chart, the fix is usually size or order type rather than another indicator.
Market price data on the screen
What you can check depends on the market data your platform shows. On our accounts, every trader gets Level 1 CME data, which shows the best bid, best offer and last trade. Level 2 depth is a paid add-on bought from Tradovate on Tradovate accounts, and it is not yet available on Rithmic accounts, so many traders see the top of the book rather than the full ladder. Our evaluations and funded accounts are simulated, so treat fills there as modeled rather than live.
Related lesson: Market depth and Level II data
Market Price FAQ
What is its market price?
An asset's market price is the price at which it last traded between a buyer and a seller. For a stock or future, it is the last trade shown on the quote. It is a record of the most recent deal, not a promise that the next trade will happen at the same number.
What is selling at market price?
Selling at market price means sending a market order to sell, which accepts the best bids available right now. The SEC notes that a market order guarantees execution but not price. A small sell in a liquid market usually fills at or near the best bid, while a larger one can fill at several lower bids.
What is price vs market value?
Price is what was actually paid in a transaction, while market value is an estimate of what something would sell for now. For a liquid stock the two are usually close, because the last trade is the best estimate. For a house or a private business, value depends on assumptions and can differ from any recent price.
How does the market determine prices?
Markets determine prices by matching buyers and sellers, either continuously in an order book, in single-price opening and closing auctions, or through dealers and negotiation. Supply and demand set how eager each side is. The market price is wherever the latest trade happens between them.
What is market-oriented pricing?
Market-oriented pricing is a business strategy that sets prices from what competitors charge and what customers already pay, rather than from cost alone. A business decides whether to price below, at or above the going rate, then checks that the price still covers its costs.
Is the settlement price the same as the market price?
No, although they are often close. The settlement price is the official end-of-session price the exchange sets under its own rules, and it drives daily margin. The market price is simply the most recent trade, which can differ from settlement by a tick or more on a volatile day.
Using the Market Price Meaning on Your Next Trade
The market price meaning comes down to one discipline: treat the last price as a receipt, and price your own order from the bid, the offer and the size resting there. Before your next entry, note the spread, the size at the touch and your order type, then compare your fill with the mid afterward. Five trades of that habit will show you whether your costs come from the market or from how you meet it.
This article is educational and is not investment advice or a recommendation to buy or sell any instrument. Futures and other leveraged products can lose money quickly, and losses can exceed what you expected when markets move fast or liquidity thins. All prices, order books and costs here are illustrative. Contract specifications, fees and rules depend on the exchange, broker and account you use, and simulated or funded accounts are simulated, so their fills can differ from live trading.


