



TL;DR: Williams %R indicator readings show where the latest close sits in the recent high-low range, from 0 to -100. Readings above -20 are called overbought and readings below -80 oversold, but neither is a reversal signal on its own. On a year of E-mini S&P 500 sessions, the overbought zone showed up far more often than the oversold zone. Use %R with a trend filter, a structure-based stop and a reading you have measured on your own market.
You see the Williams %R indicator drop below -80 and the urge is immediate: it's oversold, so it has to bounce. Sometimes it does. Sometimes the market keeps closing near its lows for days and that "oversold" buy turns into the worst trade of the week.
The indicator itself answers one narrow question: where did the last close land inside the range of the last few bars? A reading near 0 means the close finished near the top of that range, and a reading near -100 means it finished near the bottom. This guide covers the formula, how to read the levels as prices, what the default settings actually do, and how %R behaved on a full year of real E-mini S&P 500 daily sessions.
What the Williams %R Indicator Measures
Williams %R (also written %R, or Williams Percent Range) is a momentum oscillator developed by Larry Williams, a commodities trader and author. It measures the level of the close relative to the highest high of a lookback window, usually 14 bars.
The output is bounded. No matter how fast price moves, Williams %R stays between 0 and -100:
- 0 means the close equals the highest high of the window.
- -50 means the close sits at the exact midpoint of the window.
- -100 means the close equals the lowest low of the window.
Why the Williams %R scale is negative
The negative scale trips people up. A reading of -5 looks weak next to -95, but it is the opposite: -5 means the close printed near the top of its range.
The minus sign is housekeeping. The formula measures the distance from the high, then multiplies by -100 so that higher closes produce higher readings. Williams' original book formula multiplied by 100 instead, and software later settled on the negative version, so you will see both conventions in older material.
What Williams %R is for, and what it is not
The indicator describes position, not prediction. It tells you whether buyers or sellers had the upper hand at the close, relative to recent trading. It does not tell you whether a move is finished, whether a level will hold or whether a trade is worth its risk. Every useful strategy built on %R adds those pieces from somewhere else.
Williams %R Formula and Calculation
The Williams %R formula uses three inputs from the lookback window: the highest high, the lowest low and the latest close.
%R = (Highest High - Close) / (Highest High - Lowest Low) x -100
Here is a round illustrative example. Say the last 14 bars had a highest high of 6,000 and a lowest low of 5,900, so the range is 100 points. The latest close is 5,915.
- Highest high minus close: 6,000 - 5,915 = 85.
- Highest high minus lowest low: 6,000 - 5,900 = 100.
- Divide: 85 / 100 = 0.85.
- Multiply by -100: -85.
A reading of -85 is inside the oversold zone. The close sits 15 points above the bottom of a 100-point range.
Two real Williams %R readings on the E-mini S&P 500
The same arithmetic on two real daily windows from the E-mini S&P 500 continuous front-month series shows how far apart readings can get.
| Session | 14-bar highest high | 14-bar lowest low | Close | Williams %R |
|---|---|---|---|---|
| April 13, 2026 | 7,008.00 | 6,353.25 | 7,004.75 | -0.50 |
| December 17, 2025 | 6,928.75 | 6,723.75 | 6,726.50 | -98.66 |
On April 13, 2026, the window range was 654.75 points and the close finished 3.25 points under the high, so the reading was -0.50. On December 17, 2025, the range was 205 points and the close finished 202.25 points under the high, so the reading was -98.66. Those were the strongest and weakest 14-period readings across the full year studied later in this guide.
Why the Williams %R window keeps moving
The window includes the current bar. Every time a bar closes, the oldest bar drops out and the newest one enters, so the highest high and lowest low can both change even when the close barely moves.
This explains most "my chart shows a different number" questions. If two charts use different session times, different contract months or a different period, they are searching different windows and the reading will differ.
How to calculate Williams %R in a spreadsheet
You can build Williams %R in Excel or Google Sheets with two functions. Put dates in column A, opens in column B, highs in column C, lows in column D and closes in column E, with data starting in row 2. In row 15, the first row with 14 bars of history, enter:
=(MAX(C2:C15)-E15)/(MAX(C2:C15)-MIN(D2:D15))*-100
Fill the formula down and the ranges shift one row at a time, which reproduces the rolling 14-bar window. Two checks keep the sheet honest: the first 13 rows have no reading, and a window where the highest high equals the lowest low divides by zero, so wrap the formula in an IFERROR if your data has flat bars.
How to Read Williams %R Levels
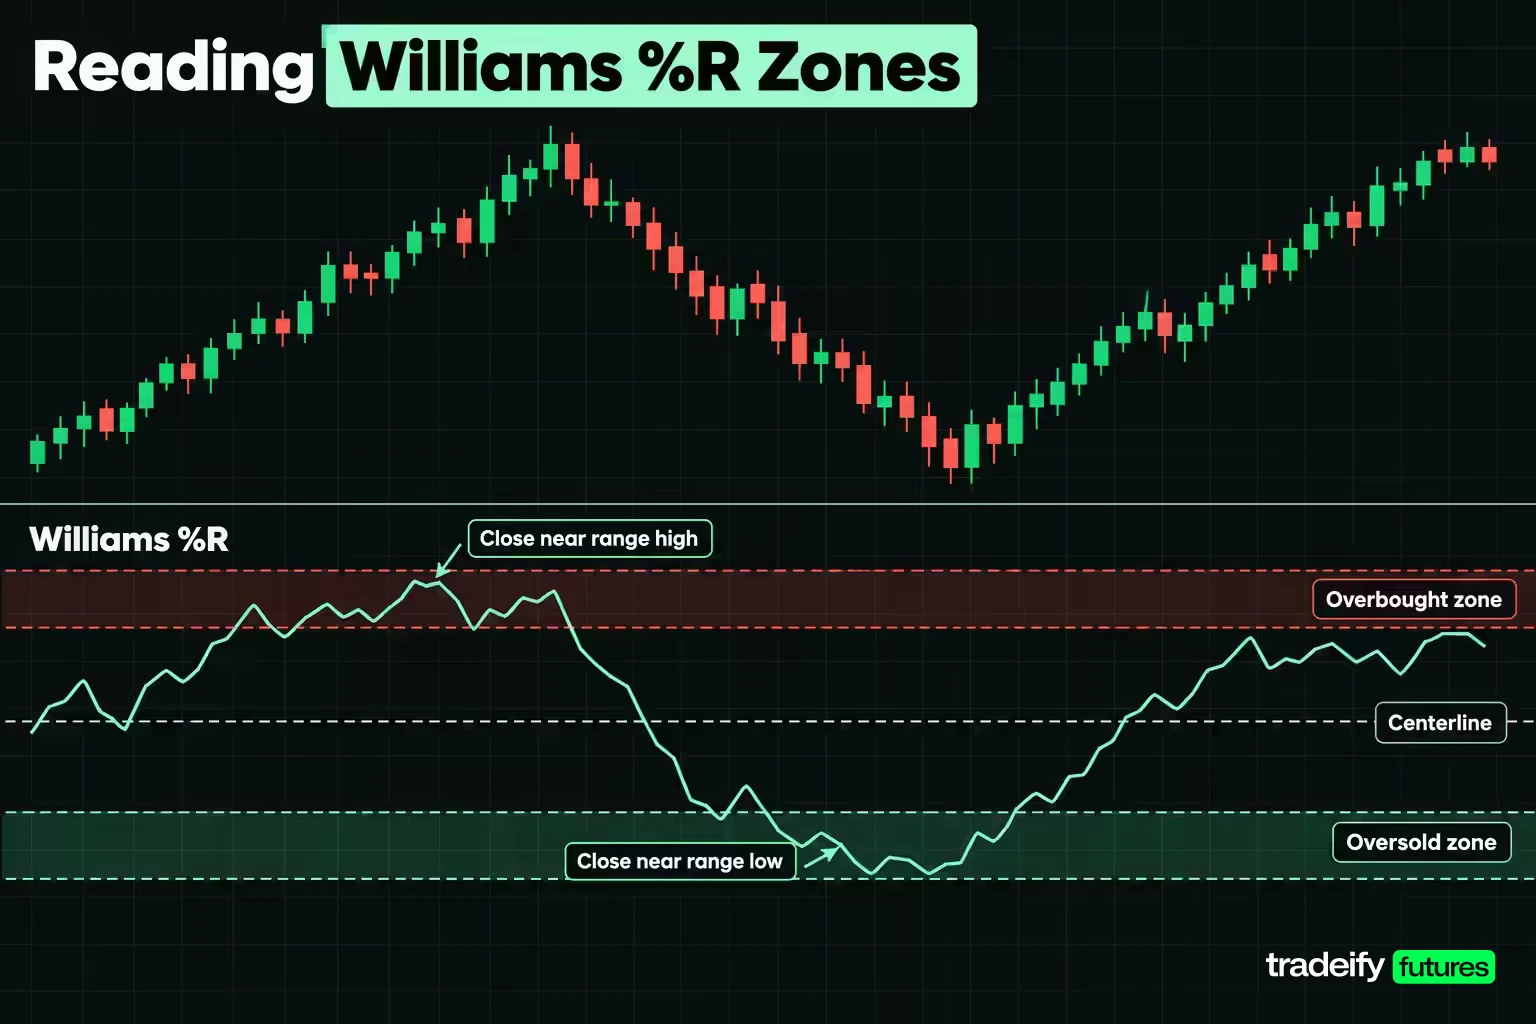
Williams %R levels split the range into four zones. The traditional thresholds of -20 and -80 come from Larry Williams himself, and -50 is the centerline.
| Williams %R zone | Reading | What the close is doing |
|---|---|---|
| Overbought | 0 to -20 | Closing in the top fifth of the range |
| Upper half | -20 to -50 | Closing above the midpoint but off the high |
| Lower half | -50 to -80 | Closing below the midpoint but off the low |
| Oversold | -80 to -100 | Closing in the bottom fifth of the range |
Overbought does not mean "too high," and oversold does not mean "too low." Overbought means price closed near the top of its recent range. In a strong uptrend that can happen day after day.
Turning Williams %R levels into prices
Every reading maps to an exact price, which is the most practical way to read the indicator. Rearranging the formula gives: price = highest high - range x (reading / -100).
Using the December 17, 2025 E-mini S&P 500 window (high 6,928.75, low 6,723.75, range 205 points):
| Williams %R level | Close needed | Points below the window high |
|---|---|---|
| 0 | 6,928.75 | 0 |
| -20 | 6,887.75 | 41 |
| -50 | 6,826.25 | 102.5 |
| -80 | 6,764.75 | 164 |
| -100 | 6,723.75 | 205 |
The close that day was 6,726.50, a reading of -98.66. To get back above the -50 centerline, the close would have needed to rise 99.75 points, assuming the window bounds stayed put. That is the kind of number that turns "it's oversold" into a decision you can plan around.
What the -50 centerline tells you
The -50 line marks the midpoint of the window. Above it, the close is nearer the high than the low; below it, nearer the low. StockCharts' ChartSchool treats a move back above -50 after an oversold reading as confirmation of an upturn, and a move below -50 after an overbought reading as confirmation of a downturn. The centerline matters because it has a real price behind it, and that price moves every bar.
Williams %R Overbought and Oversold Signals
The classic Williams %R strategy buys when the reading is oversold and sells when it is overbought. Before using it, it helps to know how often each zone actually appears on the market you trade.
How often Williams %R zones appeared on a year of E-mini sessions
This illustrative study, computed for this guide from Yahoo Finance ES=F daily data, used 252 completed daily sessions of the E-mini S&P 500 continuous front-month series (Yahoo Finance ES=F, unadjusted for rolls), from November 4, 2025 to November 4, 2026, with a 14-period setting. Over that window the close rose from 6,801.75 to 7,720.50, about 13.5%.
| Williams %R zone, 14 periods | Sessions | Share of 252 |
|---|---|---|
| Above -20 (overbought) | 90 | 35.71% |
| -20 to -50 | 74 | 29.37% |
| -50 to -80 | 54 | 21.43% |
| Below -80 (oversold) | 34 | 13.49% |
| Above -50 in total | 164 | 65.08% |
In that Yahoo Finance ES=F count, the overbought zone appeared on roughly one session in three. The oversold zone appeared on about one in seven. The median reading was -33.06, well above the centerline. That is what a rising year looks like through this indicator: the close spends most of its time in the upper half of its range.
So the two thresholds are not equally strong filters on this contract. A trader shorting every overbought reading would have been busy, and mostly fighting the trend. A trader buying oversold readings would have spent a lot more time waiting, which is exactly when the temptation to loosen the rule shows up.
What followed fresh Williams %R signals
A reading that has been overbought for ten days is different from one that just crossed in. So this guide's count of the same Yahoo Finance ES=F sessions also tracked fresh entries, the sessions where %R crossed into a zone after being outside it the day before, and checked the close ten sessions later.
| Signal on the 14-period setting | Signals | Scored | Higher close 10 sessions later |
|---|---|---|---|
| Fresh cross below -80 | 22 | 20 | 70.00% |
| Fresh cross above -20 | 20 | 20 | 35.00% |
| Any session (base rate) | 252 | 242 | 54.96% |
In that ES=F sample, fresh oversold crosses were followed by a higher close 70.00% of the time, against a 54.96% base rate. Fresh overbought crosses were followed by a higher close only 35.00% of the time. Both lean the way the textbook says. But each row has only 20 scored signals in one market and one year, so treat it as a reason to test the idea on your own data, not as an edge.
Williams %R reversal setup with -50 confirmation
For an overbought or oversold Williams %R reversal, ChartSchool's suggestion is to wait for confirmation rather than act the moment a zone is touched. In practice that gives a three-part setup:
- Condition. %R crosses below -80 (or above -20).
- Confirmation. %R turns back and crosses -50 in the opposite direction, or price closes back through a nearby structure level.
- Invalidation. Price closes beyond the window low (or high) that produced the reading.
Waiting for -50 filters out many false turns. The cost is that by the time %R reaches -50, the close has already traveled half the window's range, so the room left to the opposite extreme shrinks while the distance to your stop grows.
Best Williams %R Settings for Different Timeframes
The best Williams %R setting starts at 14 periods, the default on TradingView and ChartSchool. Williams himself used a 10-day period in his original rule. What the period really controls is the size of the window, and that changes how often the extreme zones trigger.
How the Williams %R period changes signal frequency
Here are the same 252 E-mini S&P 500 sessions at four period settings.
| Period | Above -20 | Below -80 | Above -50 |
|---|---|---|---|
| 7 | 32.14% | 17.86% | 60.32% |
| 14 | 35.71% | 13.49% | 65.08% |
| 28 | 38.10% | 7.54% | 72.62% |
| 125 | 76.98% | 2.38% | 92.06% |
Read the oversold column. Oversold readings fell from 45 sessions at 7 periods to 34 at 14, 19 at 28 and 6 at 125. Lengthening the period to cut false signals did more than smooth the line; it made the oversold signal far rarer in a rising market. Overbought moved the other way, because a long window nearly always contains the current advance.
The 125-period setting has a different job. ChartSchool notes that a 125-day %R covers about six months, so a reading above -50 is consistent with an uptrend and below -50 with a downtrend. Here it read above -50 on 92.06% of sessions, which is a trend description, not a timing tool.
Williams %R settings by trading style
| Trading style | Common starting period | What to watch |
|---|---|---|
| Intraday scalping | 7 to 10 on 1 to 5 minute bars | Very noisy; one bar can swing the reading across zones |
| Intraday swings | 14 on 5 to 15 minute bars | The default window; check readings against session highs and lows |
| Daily-chart context | 14 to 28 on daily bars | Fewer extremes; use for bias, not entries |
| Trend filter | 125 on daily bars | Above or below -50 only |
These are starting points, not answers. Any time you change the period, re-check how often your thresholds trigger. Changing the setting without re-measuring the levels is how traders end up with an oscillator that suddenly "stops working."
Using Williams %R across two timeframes
A common configuration runs a longer %R on a higher timeframe for direction and a shorter one on the trading timeframe for timing. For example, a daily 28-period %R above -50 sets a long bias, and a 14-period %R on a 15-minute chart dipping below -80 and turning back up times the entry. The higher timeframe answers "which way," the lower one answers "when."
Using Williams %R in Trending Markets and Pullbacks
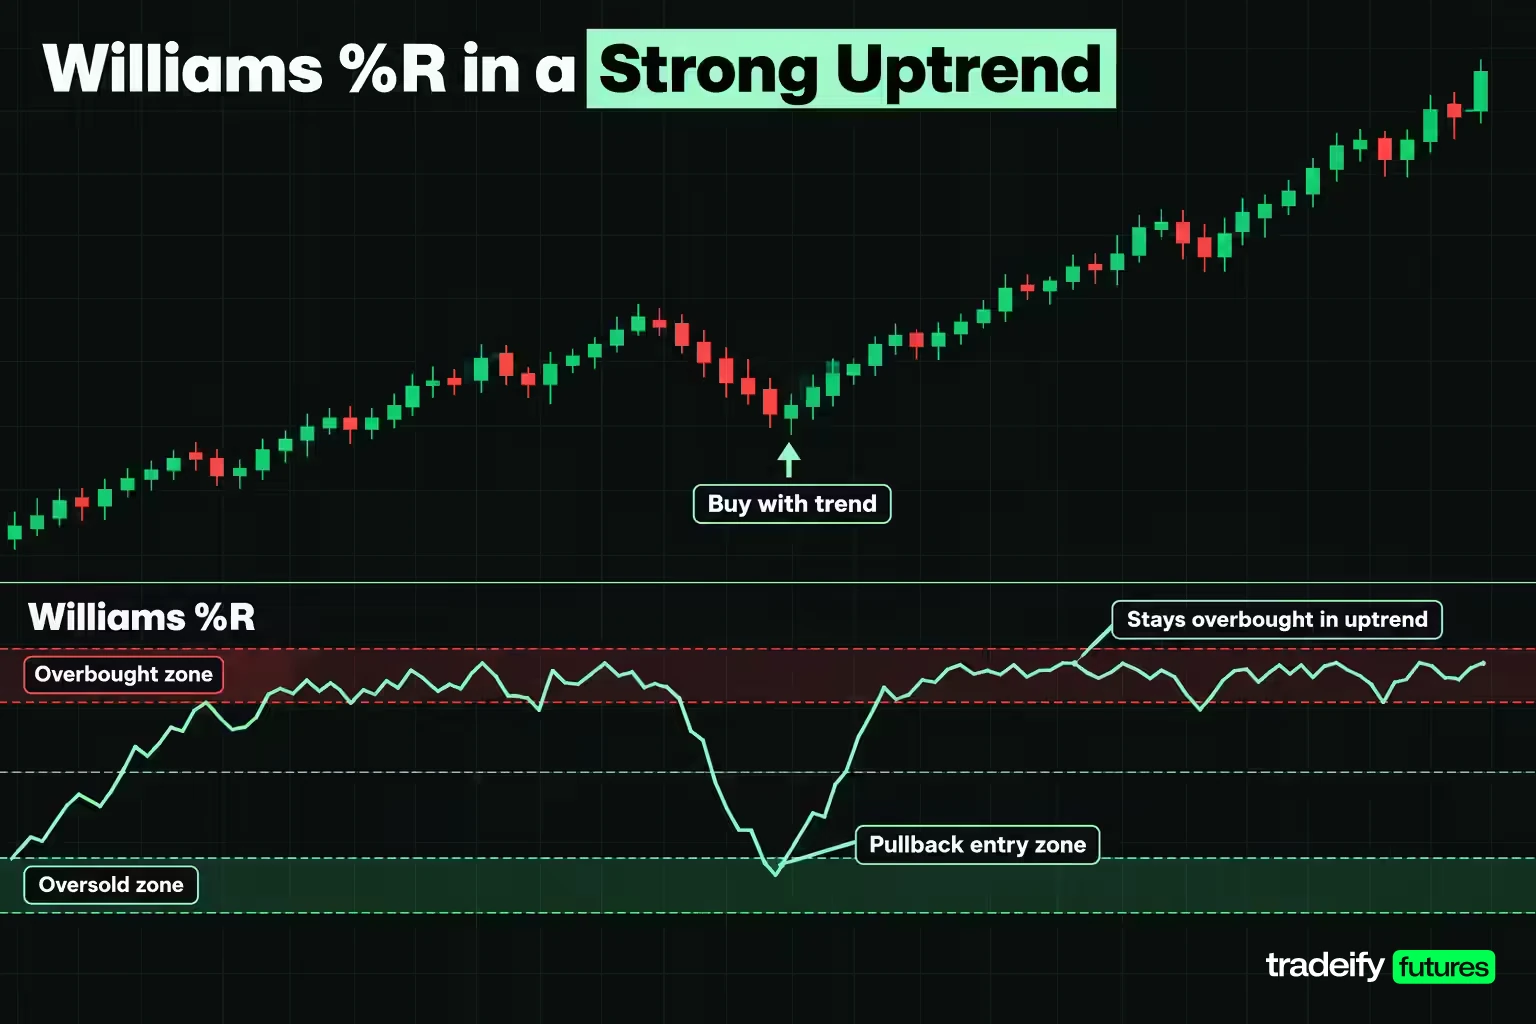
In a strong trend, Williams %R can stay pinned at an extreme for a long time. ChartSchool says it directly: securities can become overbought and remain overbought during a strong uptrend. TradingView adds that overbought or oversold readings frequently indicate a strengthening of the current trend rather than a reversal.
The E-mini study shows what that looks like. The longest unbroken run above -20 lasted 18 sessions. The longest run below -80 lasted only 3. A trader shorting each fresh overbought reading in that stretch would have been fighting closes that kept printing near the top of the range.
Williams %R pullback entries in a trend
In a trend, flip the use of the indicator. Instead of fading extremes, use the opposite extreme as a pullback marker in the trend direction:
- Uptrend. Wait for %R to drop toward -80 (or below -50 for shallow pullbacks), then look for a turn back up near a support level.
- Downtrend. Wait for %R to rise toward -20 (or above -50), then look for a turn back down near resistance.
- Invalidation. A close beyond the swing that defines the trend means the trend read was wrong, regardless of the %R reading.
How do you know which regime you are in? Use something other than %R: a long moving average, a higher-timeframe market structure read, or the 125-period %R above or below -50.
Related lesson: Trend following
Williams %R Divergence and Failure Swings
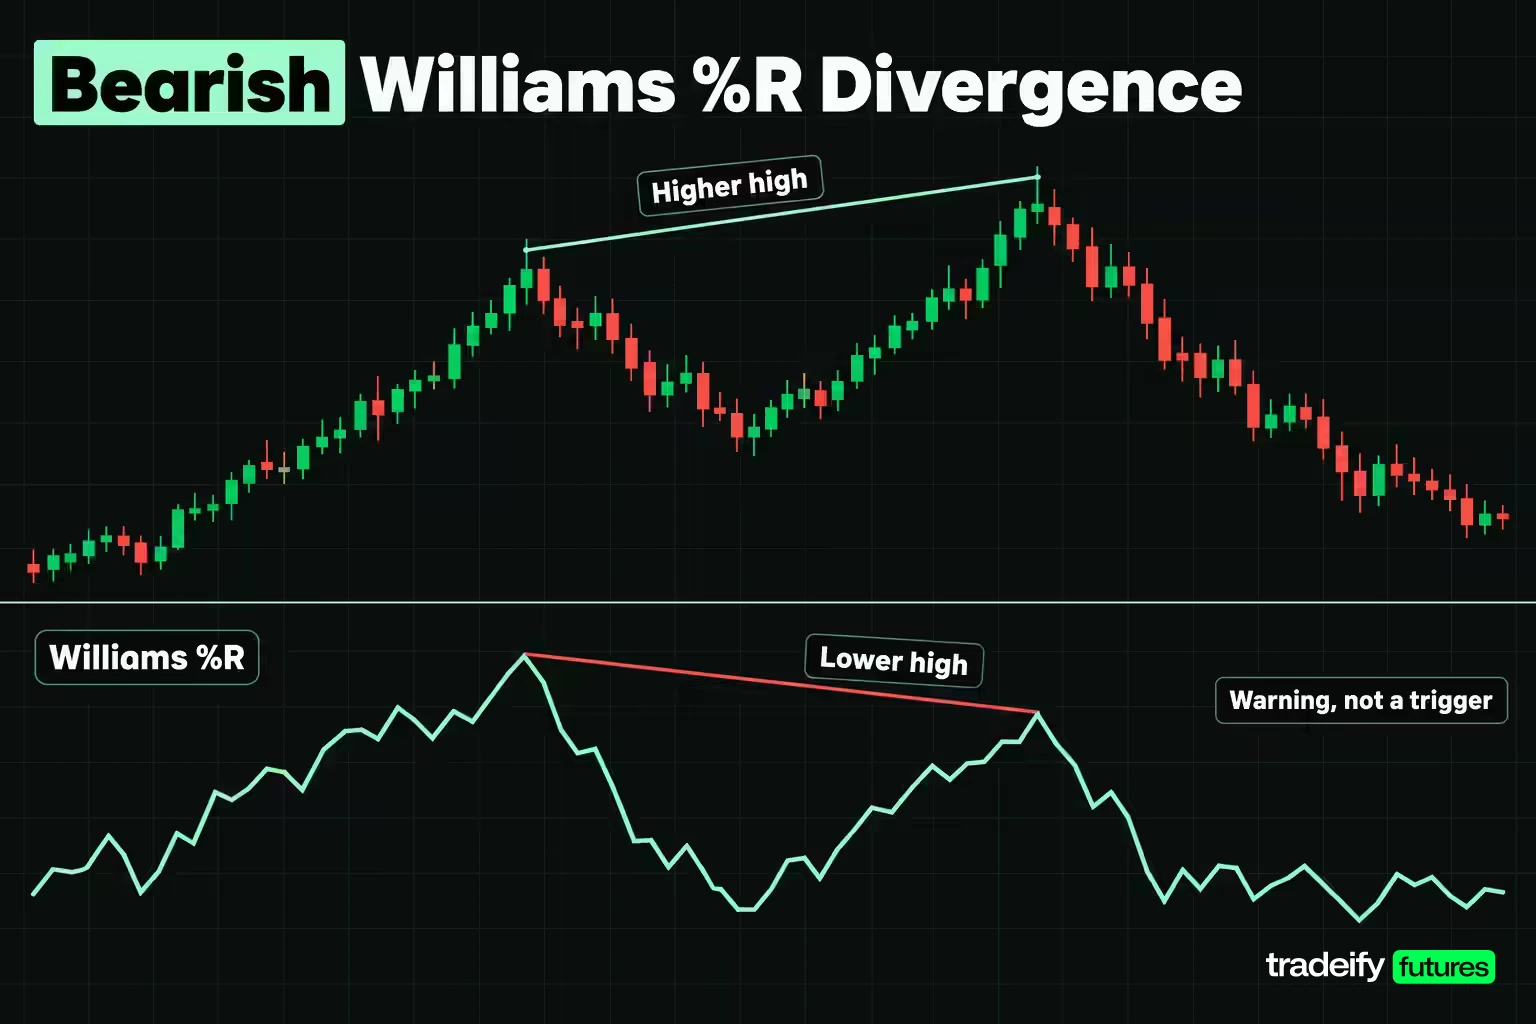
Divergence and failure swings both look for a change in momentum before price confirms it. They are less frequent than zone signals and more prone to being early.
Bullish and bearish Williams %R divergence
- Bearish divergence. Price makes a higher high, but Williams %R makes a lower high. Each push up is closing less firmly within its range.
- Bullish divergence. Price makes a lower low, but %R makes a higher low. Selling is closing less firmly near the bottom of the range.
Divergence is a warning, not a trigger. Price can diverge for weeks while a trend keeps running, especially on a bounded oscillator that sits near an extreme. Treat it as a reason to tighten risk or wait for structure to break, and require confirmation such as a close back through -50 or a break of the most recent swing.
Williams %R momentum failure, or failure swing
A failure swing happens when %R reaches an extreme, pulls back, then rallies again but fails to re-enter the zone. ChartSchool describes it on the bullish side: once a market shows strength by pushing above -20 more than once, a later failure to get back above -20 shows weakening momentum that can come before a decline. The bearish version is the mirror image at -80.
Here is how a bearish Williams %R failure swing plays out in sequence:
- %R pushes above -20, pulls back, and pushes above -20 again. Closes are repeatedly finishing at the top of the range.
- %R drops back toward -50 on a pullback.
- Price rallies, but %R stalls at, say, -30 and turns down without reaching -20. The close is no longer making it to the top of the window.
- %R crosses below -50. This is the trigger, because the close is now in the lower half of the window.
The invalidation is a renewed push above -20, or a close above the swing high from step 3. Without the -50 cross, the pattern is just a lower high on the oscillator, and in a strong trend those form and fail all the time. The bullish failure swing is the mirror image: two pushes below -80, a dip that stalls above -80, then a cross above -50.
Williams %R vs RSI and the Stochastic Oscillator
Williams %R, the stochastic oscillator and RSI all sit in the same chart panel and all flag overbought and oversold. They are built differently, and it shows in how often they trigger.
| Feature | Williams %R | Fast stochastic %K | RSI |
|---|---|---|---|
| What it compares | Close vs highest high of the window | Close vs lowest low of the window | Average gains vs average losses |
| Scale | 0 to -100 | 0 to 100 | 0 to 100 |
| Default period | 14 | 14 | 14 |
| Overbought line | -20 | 80 | 70 |
| Oversold line | -80 | 20 | 30 |
| Smoothing | None | %D is a 3-period average of %K | Wilder smoothing built in |
Williams %R and the stochastic oscillator
Williams %R is the fast stochastic flipped upside down. The stochastic measures the close against the lowest low; %R measures it against the highest high. For the same window, %R + 100 equals fast %K. On April 13, 2026, %R read -0.50 on the E-mini window, so fast %K read 99.50. The difference is that the stochastic is usually shown with a smoothed %D line, while %R is normally plotted raw.
Related lesson: Stochastic oscillator
Williams %R vs RSI on the same sessions
RSI uses smoothed averages of up and down closes, so it reacts more slowly and reaches its extremes less often. On the same 252 E-mini sessions with both set to 14 periods:
| Condition | Both agree | Williams %R only | RSI only |
|---|---|---|---|
| Overbought (%R above -20, RSI above 70) | 23 | 67 | 0 |
| Oversold (%R below -80, RSI below 30) | 2 | 32 | 0 |
Every RSI overbought session was also a %R overbought session, but %R flagged 67 more. On the oversold side, RSI went below 30 on just 2 sessions against 34 for %R. RSI peaked at 78.25 and bottomed at 26.86 over the year. The two series correlate at 0.8594, so they usually move together; they just do not agree on what counts as extreme. In practice, %R is the faster, twitchier read and RSI the slower, more selective one.
Combining Williams %R With Other Indicators
TradingView's own guidance is that %R works best as part of a larger system, not as a stand-alone indicator. The useful pairings each answer a question Williams %R cannot answer.
| Question | Tool type that answers it | Example pairing with Williams %R |
|---|---|---|
| Which direction is the trend? | Moving average or market structure | Only take oversold buys above a rising 50-period average |
| Where is the trade wrong? | Support and resistance, swing highs and lows | Stop beyond the window low that produced the reading |
| How far can price reasonably move? | Average true range | Skip setups where the stop is under half an ATR |
| Is the move being confirmed? | Volume or a second timeframe | Require a higher-timeframe bias that agrees |
Avoid stacking %R with RSI and the stochastic and calling it confirmation. All three are range or momentum oscillators built from the same closes, so agreement between them is mostly the same information counted three times.
Williams %R at support and resistance
Williams %R becomes more useful when a reading lines up with a price level that matters. An oversold reading as price tests a prior swing low or a well-tested support zone gives a defined place to be wrong. An oversold reading in the middle of nowhere gives you nothing to lean on.
The same idea helps with breakouts. If price breaks above resistance and %R pushes above -20 and stays there, the close is holding at the top of its range, which supports the breakout. If price pokes through resistance but %R fails to reach -20, the close is not following, and the break deserves more suspicion.
Related lesson: Support and resistance
How to Trade the Williams %R Indicator Step by Step
Here is a repeatable process for using the Williams %R indicator, followed by a worked example on the Micro E-mini S&P 500 (MES), which is $5 per index point with a 0.25-point tick worth $1.25.
- Set the regime first. Decide whether the market is trending or ranging using a tool other than %R.
- Pick the zone that fits the regime. In a range, watch both extremes. In an uptrend, watch for pullbacks toward -80; in a downtrend, rallies toward -20.
- Convert levels to prices. Work out where -20, -50 and -80 sit on the current window so you know the actual distances.
- Choose the trigger. Either an early turn out of the zone or a confirmation cross of -50.
- Place the stop from structure. Beyond the window extreme or the nearest swing, not at an indicator level.
- Check the math before entering. Reward to risk and break-even win rate decide whether the setup is worth taking.
Worked Williams %R trade example on MES
Use the round illustrative window from the formula section: highest high 6,000, lowest low 5,900. The level prices are 5,980 for -20, 5,950 for -50 and 5,920 for -80. Price closes at 5,915 (a reading of -85), so the market is oversold inside what you have judged to be a range. The stop goes at 5,895, just below the window low.
| Entry choice | Entry price | Reading at entry | Risk per MES | Reward to 6,000 per MES | Reward to risk | Break-even win rate |
|---|---|---|---|---|---|---|
| Early turn out of oversold | 5,925 | -75 | 30 points, $150 | 75 points, $375 | 2.5 | 28.57% |
| Confirmation cross of -50 | 5,950 | -50 | 55 points, $275 | 50 points, $250 | 0.91 | 52.38% |
This is the tradeoff in one table. The early entry needs to be right only 28.57% of the time to break even, but it acts before the turn is confirmed and will catch more failed bounces. The confirmation entry filters those out, but by the time %R reaches -50 the close has already covered half the range, so it needs to win 52.38% of the time just to break even against the same target.
Neither is "correct." What matters is that you pick one before the trade, knowing what it costs, rather than switching to whichever looked better after the fact. On the full-size E-mini (ES, $50 per point), the same 30-point stop is $1,500 per contract, which is why sizing comes from the stop distance, not from how strong the reading looks. Commissions and slippage, which this example leaves out, push both break-even rates higher.
Related lesson: Risk-reward ratio
Williams %R timeframes on intraday-only prop accounts
On our accounts, every position must be closed by 4:45 PM ET and nothing is held overnight or over the weekend, so a daily-chart %R reading works as context while entries and exits happen on intraday charts. If you chart through TradingView, it connects through the Tradovate connection, and WealthCharts' Chart Replay lets you practice reading %R turns on historical data before risking a live session.
Common Williams %R Mistakes and Limitations
Most Williams %R losses don't come from the math. They come from asking the indicator to do a job it was never built for.
- Selling every overbought reading. In the E-mini study the reading sat above -20 for 18 sessions straight. Overbought is a description of strength, not a sell order.
- Using the levels without measuring them. The -20 and -80 lines trigger at very different rates depending on the market, the trend and the period.
- Changing the period and keeping the thresholds. In this guide's count of a year of Yahoo Finance ES=F daily bars, a 28-period setting produced oversold readings on 7.54% of sessions and a 7-period setting on 17.86%. Same lines, different filter.
- Copying the original rule literally. Williams' published rule waited for -100, five trading days, then a move back above -95 or -85. On the 14-period E-mini readings in the study, %R never reached -100 and fell below -95 on only 4 sessions.
- Stacking oscillators as confirmation. %R, the stochastic and RSI share inputs, so agreement adds little.
- Putting the stop at an indicator level. The reading carries no price structure. Stops belong beyond a real swing or window extreme.
- Comparing readings across charts with different windows. Session times, contract months and periods all change the bounds.
Structural limits of Williams %R
Williams %R is built from past highs, lows and closes, so it describes what has already happened. It ignores volume, ignores where the close sits within its own bar, and gives no sense of how large the range is. A -90 reading in a 20-point range and a -90 reading in a 300-point range look identical on the oscillator but carry very different risk. That is why the price conversion and an ATR check belong next to it on every chart.
Williams %R Indicator FAQ
What does the Williams %R indicator represent?
It represents where the latest close sits within the highest high and lowest low of a lookback window, on a scale from 0 to -100. A reading of 0 means the close equals the window high, -100 means it equals the window low, and -50 is the midpoint.
What is the difference between Williams %R and RSI?
Williams %R compares the close to a price range, while RSI compares the average size of up closes to down closes. On 252 E-mini S&P 500 sessions, %R went below -80 on 34 sessions while RSI went below 30 on only 2. They often move together but trigger extremes at very different rates.
What are the best settings for the Williams %R indicator?
Start with the default 14 periods. Shorter settings react faster and hit the extremes more often; longer settings smooth the line and make one of the extremes rarer in a trending market. Whatever you choose, measure how often your thresholds trigger on the market and timeframe you trade.
Is Williams %R the same as the stochastic oscillator?
Mathematically, Williams %R is the fast stochastic %K flipped upside down. For the same window, %R plus 100 equals fast %K. The stochastic is usually shown with a smoothed %D line, while %R is plotted raw.
Is Williams %R good for day trading?
Yes, Williams %R can work for day trading on 1 to 15 minute charts, because the formula applies to any timeframe. Short windows make it flip between zones quickly, so day traders usually pair it with a higher-timeframe trend read and a structure-based stop.
Why does my Williams %R reading differ from another chart?
Usually the windows differ. A different period, session start time or contract month changes the highest high and lowest low, which changes the reading. Check that both charts use the same settings and data.
Williams %R Trading Risk Note
This article is general education about how Williams %R is calculated and used, not investment advice or a recommendation to trade any instrument. The study figures come from one market over one year and are historical frequencies, not forecasts. Futures are leveraged, and losses can exceed what you planned to risk; stop orders do not guarantee your exit price. Evaluation and funded prop accounts are simulated, and simulated results do not reflect live trading.


