



TL;DR: The stochastic oscillator shows where the close sits inside the recent high-low range, on a 0 to 100 scale. The default 14-3-3 setting uses a 14-bar lookback, 3 bars of smoothing on %K and a 3-bar %D signal line. A reading above 80 or below 20 describes location in the range, not a reversal, and it can stay pinned in a trend. The usable signals are the exit from an extreme, a %K and %D cross, divergence and a move through 50, ideally in the direction of the bigger trend.
The stochastic oscillator is one of the first indicators most traders load, and one of the first they misread. The line drops under 20, the word "oversold" shows up, and buying feels like the obvious move. Then price keeps falling, because a low reading never promised a bounce.
This guide treats the stochastic oscillator as a measurement you can check by hand. You will see the formula worked bar by bar on an illustrative futures series, what 14-3-3 actually changes, which signals have a reason behind them, and what a signal costs once a stop, a target and fees are attached.
What the Stochastic Oscillator Measures
The stochastic oscillator answers one narrow question. Over the last N bars, where did the latest close finish inside the range between the highest high and the lowest low? A close at the very top of that range reads 100, a close at the very bottom reads 0, and a close in the middle reads 50.
George C. Lane developed the indicator in the late 1950s. He described it as a momentum tool rather than a price tool, saying it "doesn't follow price, it doesn't follow volume or anything like that. It follows the speed or the momentum of price."
That framing tells you what a reading is and what it is not.
- A reading of 85 says the close finished near the top of the recent range. That is also what a healthy advance looks like.
- A reading of 10 says the close finished near the bottom of the recent range. That is also what a steady decline looks like.
- Neither reading says what the next bar will do.
So the stochastic oscillator tells you about position and pressure. Closes that keep landing near the top of the range point to sustained buying pressure, and closes that keep landing near the bottom point to sustained selling pressure. The decision you still have to make is whether that pressure is building, fading or about to turn.
Related lesson: Relative strength index
Stochastic Momentum and the 50 Centerline
Momentum is the speed of price movement, and the stochastic reads it through where closes land. Lane's reasoning, quoted in a 2007 interview, used a rocket: "before it can turn down, it must slow down. Momentum always changes direction before price."
On a stochastic oscillator, slowing shows up as closes drifting away from the extreme of the range. Price can still be rising while each close lands a little lower inside a widening range. The stochastic line rolls over first, which is the early warning Lane was after.
The 50 line is the stochastic's midpoint and the simplest momentum read on it.
- Above 50, the close sits in the upper half of the lookback range, so buyers have the better of the recent bars.
- Below 50, the close sits in the lower half, so sellers have the better of them.
- A cross through 50 is a change of control inside the range, which is slower than a cross at 20 or 80 but less prone to whipsaw.
The condition matters. "Momentum turns before price" is a tendency, not a rule. A rolling-over stochastic in a strong trend often just marks a pause, and the trend resumes. Treat a momentum turn as a reason to watch price more closely, not as an order ticket.
Related lesson: Momentum trading
Stochastic Oscillator Formula and Calculation
The stochastic oscillator formula has two lines.
- %K = (Current Close − Lowest Low) ÷ (Highest High − Lowest Low) × 100
- %D = the 3-period simple moving average of %K, plotted as the signal or trigger line
The lookback, usually 14 periods, sets which highs and lows count. Those periods can be minutes, days or weeks. The math is the same on any timeframe.
A textbook example makes the mechanics plain. If the 14-bar highest high is 110, the lowest low is 100 and the close is 108, the range is 10 and the close sits 8 above the low. 8 ÷ 10 × 100 gives a %K of 80. If the close were 103, %K would be 30.
A 14 Period Stochastic Worked Bar by Bar
The stochastic oscillator table that follows uses an illustrative series of 5-minute bars on the Micro E-mini S&P 500 (MES), where one index point is worth $5 and the minimum tick is 0.25 points, or $1.25. These prices are hypothetical, built to show the arithmetic. The series tops at 7,682, falls to 7,608, bounces, makes a slightly lower low at 7,602 and then recovers to 7,660.
| Bar | Highest high (14 bars) | Lowest low (14 bars) | Range width | Close | Fast %K | %D (also slow %K) | Slow %D |
|---|---|---|---|---|---|---|---|
| 14 | 7,682 | 7,630 | 52 | 7,634 | 7.69 | Not yet defined | Not yet defined |
| 15 | 7,682 | 7,620 | 62 | 7,622 | 3.23 | Not yet defined | Not yet defined |
| 16 | 7,676 | 7,608 | 68 | 7,610 | 2.94 | 4.62 | Not yet defined |
| 17 | 7,672 | 7,608 | 64 | 7,618 | 15.63 | 7.26 | Not yet defined |
| 18 | 7,672 | 7,608 | 64 | 7,624 | 25.00 | 14.52 | 8.80 |
| 19 | 7,666 | 7,608 | 58 | 7,622 | 24.14 | 21.59 | 14.46 |
| 20 | 7,660 | 7,608 | 52 | 7,614 | 11.54 | 20.23 | 18.78 |
| 21 | 7,658 | 7,602 | 56 | 7,612 | 17.86 | 17.84 | 19.89 |
| 22 | 7,658 | 7,602 | 56 | 7,618 | 28.57 | 19.32 | 19.13 |
| 23 | 7,656 | 7,602 | 54 | 7,626 | 44.44 | 30.29 | 22.49 |
| 24 | 7,648 | 7,602 | 46 | 7,634 | 69.57 | 47.53 | 32.38 |
| 25 | 7,644 | 7,602 | 42 | 7,642 | 95.24 | 69.75 | 49.19 |
| 26 | 7,650 | 7,602 | 48 | 7,648 | 95.83 | 86.88 | 68.05 |
| 27 | 7,656 | 7,602 | 54 | 7,654 | 96.30 | 95.79 | 84.14 |
| 28 | 7,662 | 7,602 | 60 | 7,660 | 96.67 | 96.27 | 92.98 |
What the Worked Stochastic Table Shows
Three details in the 14-period stochastic calculation on the illustrative MES bars are worth slowing down for.
First, the range width keeps changing. It runs from 68 points on bar 16 down to 42 on bar 25. Every %K is divided by its own width, so a reading of 25 today and 25 last week can describe very different distances in points.
Second, old bars rolling out of the window move the reading. On bar 25 the highest high drops from 7,648 to 7,644 as an older high leaves the 14-bar window. That smaller ceiling helps push %K from 69.57 to 95.24 in a single bar.
Third, the %D column is identical to slow %K by construction. Slow %K is fast %K smoothed over 3 bars, and fast %D is a 3-bar average of fast %K, so they are the same number.
Stochastic Settings for Fast, Slow and Full Versions
Stochastic settings are written as numbers in a fixed order. In 14-3-3, the 14 is the lookback, the first 3 smooths %K, and the second 3 is the %D average. Charting packages ship three versions.
| Stochastic version | Usual notation | %K line | %D line | Signal character |
|---|---|---|---|---|
| Fast | 14,3 | Raw range position, unsmoothed | 3-period average of fast %K | Earliest turns, most whipsaw |
| Slow | 14,3 | Fast %K smoothed over 3 periods (equal to fast %D) | 3-period average of slow %K | Fewer crosses, later turns |
| Full | 14,3,3 | Lookback and %K smoothing both adjustable | Adjustable average of full %K | Fully configurable version of the slow line |
Lane's original formulas are the fast version. The slow version was introduced because Lane leaned on %D for his signals, and smoothing %K by 3 bars bakes that emphasis in. The full version is the slow version with every number exposed.
Why Each Stochastic Line Turns Later
Smoothing buys calm and costs time. On the second dip in the illustrative MES series, fast %K bottoms on bar 20 at 11.54. %D bottoms one bar later on bar 21 at 17.84. Slow %D bottoms on bar 22 at 19.13.
That one-bar delay per layer shows up in signals too. The fast stochastic cross on bar 21 comes at a close of 7,612. The slow version's cross, slow %K over slow %D, arrives on bar 22 at 7,618, one bar and 6 points later. You get a quieter line and a worse price, and no setting removes that trade.
Each line also needs warm-up bars before it exists at all.
| Lookback | First fast %K | First %D | First slow %D | Time to first slow %D on 5-minute bars |
|---|---|---|---|---|
| 5 | Bar 5 | Bar 7 | Bar 9 | 45 minutes |
| 9 | Bar 9 | Bar 11 | Bar 13 | 65 minutes |
| 14 | Bar 14 | Bar 16 | Bar 18 | 90 minutes |
| 21 | Bar 21 | Bar 23 | Bar 25 | 125 minutes |
Choosing a Stochastic Lookback by Timeframe
There is no best stochastic setting, only a tradeoff. A shorter lookback gives a choppy line with many overbought and oversold readings. A longer lookback gives a smoother line with fewer of both.
StockCharts' examples show the range people use. A full stochastic of 20,5,5 is the slower, less sensitive variant, while 10,3,3 is used when the default does not produce enough signals in a trend. The 14-3-3 default sits between them.
A practical way to choose is to start from your holding period, not the indicator. If your trades last a few bars on a 5-minute chart, a 21-period lookback covers almost two hours of history and may be slower than the decision you are making. If you trade off a daily chart, a 5-period lookback reacts to one wide day. Pick a setting, hold it fixed while you measure it, and change it only on evidence from a decent sample.
How to Add the Stochastic Oscillator to a Chart
Most platforms list the stochastic oscillator as "Stochastic," "Stoch" or "Stochastics" in the indicator menu. It plots in its own panel, usually under the price chart, with two lines and a 0 to 100 scale.
A clean stochastic oscillator layout usually includes the following.
- %K and %D in clearly different colours, so a cross is obvious at a glance.
- Horizontal lines at 80 and 20, plus a lighter line at 50.
- The same setting on every chart you compare, since a 14-bar line on a 1-minute chart and on a daily chart describe very different spans of time.
StockCharts notes the indicator can also sit behind the price plot, which makes it easier to line up stochastic swings with price swings.
Input names differ by platform, so check what each box controls. TradingView's Stochastic exposes %K length (default 14), %K smoothing (default 3) and %D smoothing (default 3), and setting %K smoothing to 1 turns off the extra smoothing, which gives you the fast version. Overbought and oversold lines and the shaded band between them can be toggled on and off.
Stochastic Inputs in Code
For automated rules, the stochastic oscillator is a built-in function on most platforms. NinjaTrader's NinjaScript, for example, exposes it as Stochastics(periodD, periodK, smooth), returning separate K and D series. Watch the argument order, since it lists %D before %K, and a swapped pair silently gives you a different indicator. Before trusting any coded rule, check a few bars of its output against a hand calculation like the 14-period table for MES.
Overbought and Oversold Readings at 80 and 20
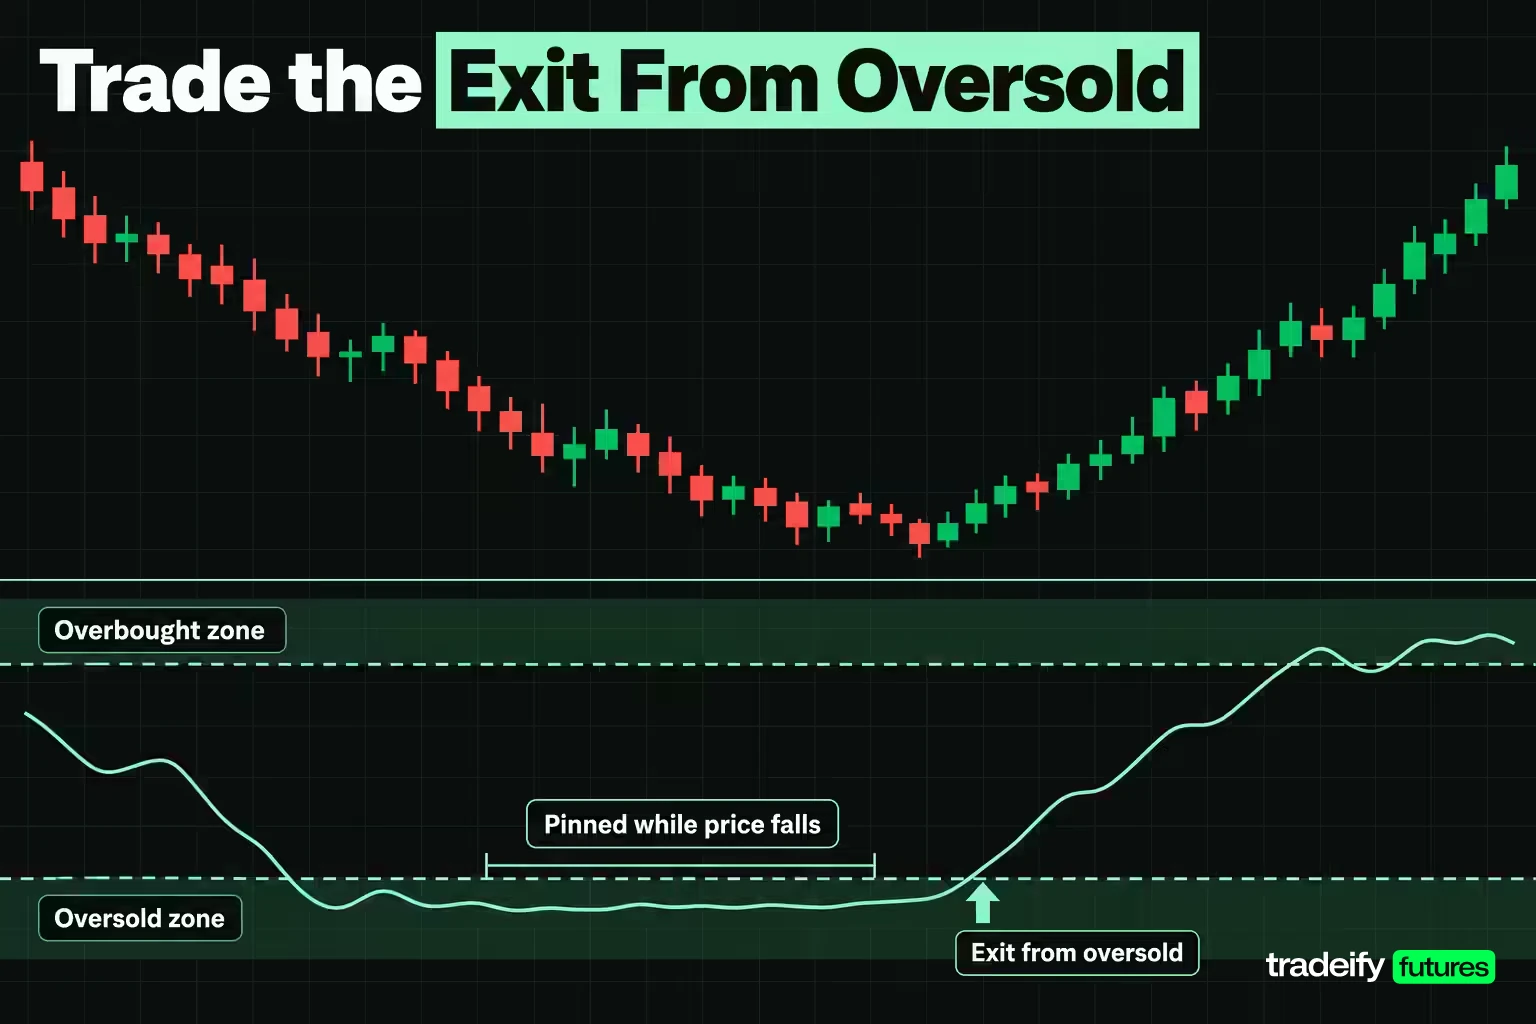
Traditional stochastic thresholds are 80 for overbought and 20 for oversold. Above 80, the close sits in the top fifth of its lookback range. Below 20, it sits in the bottom fifth. The levels can be moved to suit an instrument, for example 85 and 15 on a market that spends a lot of time near its extremes.
The trap is the word itself. "Overbought" sounds like a sell signal, but overbought readings aren't necessarily bearish. A market can become overbought and stay there through a strong uptrend, because closes keep landing near the top of the range. Oversold works the same way in a downtrend.
That is why the actionable stochastic signal is the exit from the zone, not the zone.
- After an overbought reading, a move back below 80 shows the closes have started landing lower in the range.
- After an oversold reading, a move back above 20 shows the closes have started landing higher.
On the illustrative MES series, fast %K sits under 20 from bar 14 through bar 17 while price falls from 7,634 to 7,610 and then starts to bounce. Buying the first reading under 20, at bar 14, would have meant sitting through another 24 points of decline to the bar 16 close. Waiting for the line to come back above 20 gave up part of the bounce and skipped that slide.
Related lesson: Mean reversion trading
Stochastic Crossover Signals and the Confirmation Ladder
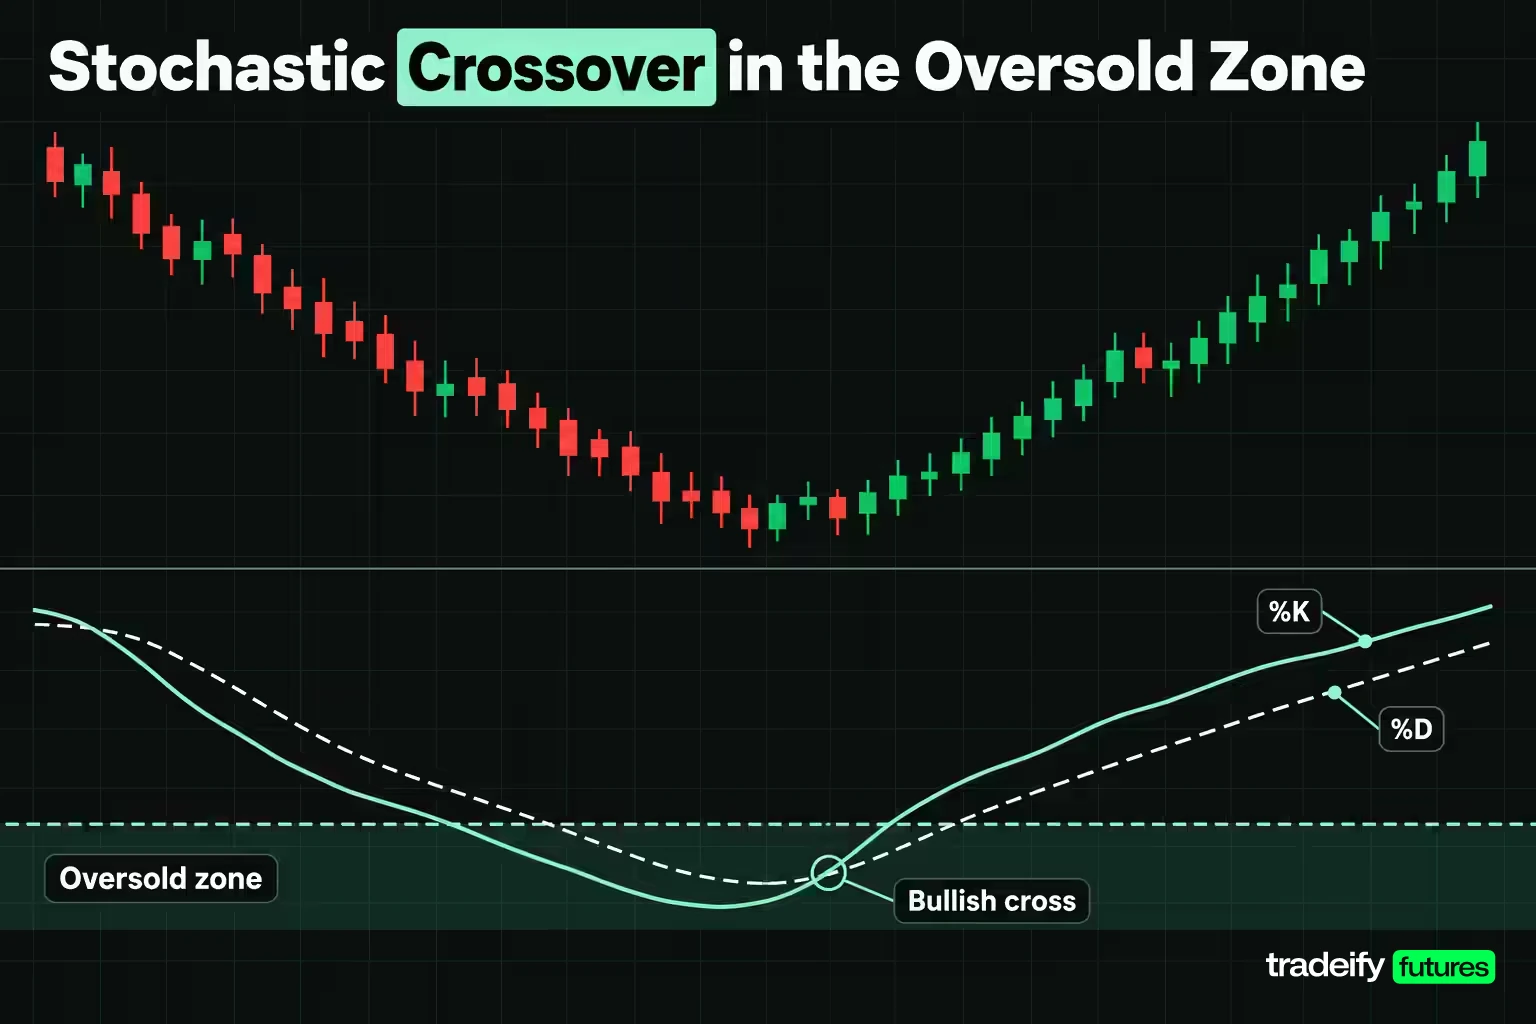
A stochastic crossover happens when %K crosses %D. %K crossing above %D is read as bullish and %K crossing below %D as bearish. The cross carries the most weight when it happens with both lines in an extreme zone, under 20 for a long or over 80 for a short.
The illustrative MES series shows both sides of the cross.
- Bar 17 is a failed cross. %K jumps to 15.63 over a %D of 7.26, both under 20, at a close of 7,618. A stop one tick under the bar 16 low sits at 7,607.75, a risk of 10.25 points, 41 ticks or $51.25 on one MES. Price makes a lower low at 7,602 on bar 21 and takes the stop, a loss of $54.95 once slippage and an illustrative commission are added.
- Bar 21 is the cross that works. %K at 17.86 edges over %D at 17.84, both under 20, at a close of 7,612. Price then climbs to 7,660 by bar 28.
Same indicator, same zone, opposite results. Nothing on the bar 17 cross warned you in advance. That is the honest cost of the earliest stochastic signal: it fires before the evidence is in.
The Three Step Stochastic Confirmation Ladder
StockCharts lays out a three-step sequence for confirming a stochastic upturn. Each step adds evidence and costs entry price.
- A signal line cross and/or a move back above 20. This is the earliest entry and the most prone to whipsaw.
- A move above 50, which puts the close in the upper half of the range.
- A breakout through resistance on the price chart.
On the bar 21 signal, the ladder plays out over three bars.
| Confirmation step | Bar | Close | Points given up versus the bar 21 close | Dollars per MES contract |
|---|---|---|---|---|
| %K crosses %D under 20 | 21 | 7,612 | 0 | $0 |
| %D climbs back above 20 | 23 | 7,626 | 14 | $70 |
| %K above 50 and price breaks the 7,630 bounce high | 24 | 7,634 | 22 | $110 |
Neither end of the ladder is right in general. The earliest step gives the best price and the most failures, which is exactly what bar 17 delivered. The last step gives the most evidence and the least room left in the move. Pick the step your stop and target can afford, and stick with it long enough to measure it.
Stochastic Divergence and Lane's Set-Ups
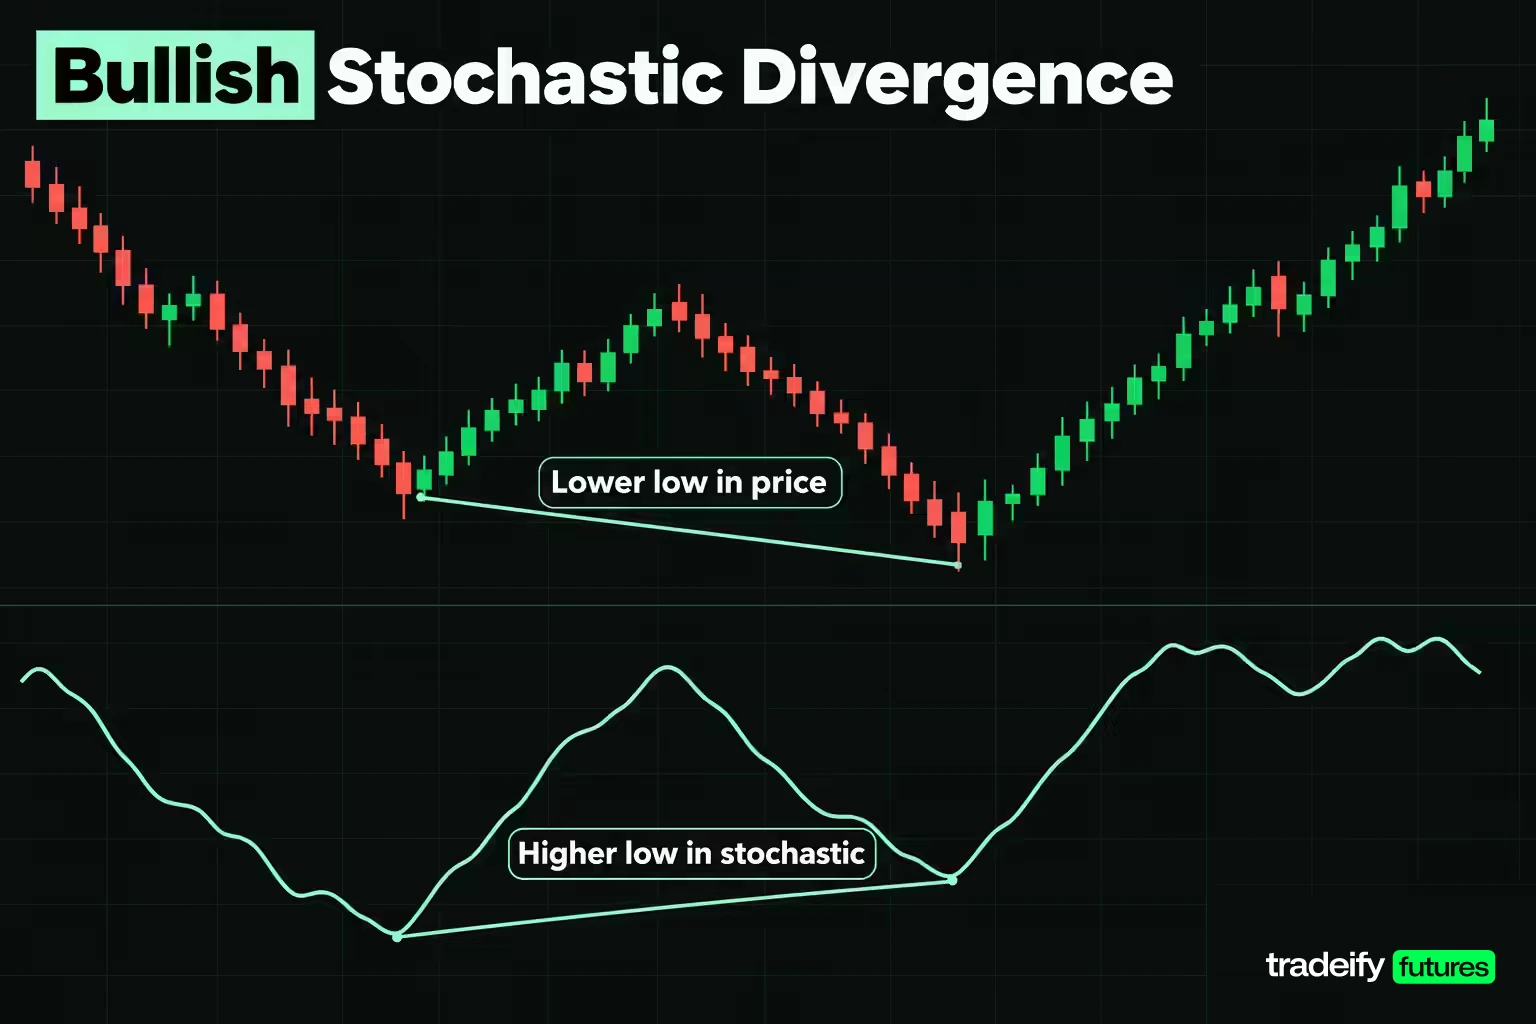
Divergence was the first and most important stochastic signal Lane identified. It forms when price makes a new extreme that the oscillator does not confirm.
- Bullish divergence: price makes a lower low, while the stochastic makes a higher low. Downside momentum is fading even though price printed a new low.
- Bearish divergence: price makes a higher high, while the stochastic makes a lower high. Upside momentum is fading even though price printed a new high.
The illustrative MES series contains a bullish stochastic divergence. Price's first trough is 7,608 on bar 16 with fast %K at 2.94. The second trough is lower, 7,602 on bar 21, but %K's low on that dip is 11.54 on bar 20. Closes were landing higher in their range on the second push down. The higher %K low was a warning, and the bar 21 cross was the trigger.
A divergence is a condition, not an entry. Confirm a bullish divergence with a resistance break or a stochastic move above 50, and a bearish one with a support break or a move below 50. A divergence can also persist across several swings before price turns, which is why acting on the first one without confirmation gets expensive.
Bull and Bear Set-Ups
Lane also described set-ups, which invert the divergence pattern. In a bull set-up, price makes a lower high while the stochastic makes a higher high, showing upside momentum strengthening even though price could not exceed its prior high. The next decline is then expected to produce a tradable low.
A bear set-up is the mirror. Price makes a higher low while the stochastic makes a lower low, showing downside momentum building. Both are set-ups, not signals, so you still wait for the cross, the move through 20 or 80, or the price break before acting.
Using the Stochastic Oscillator in Trending Markets
The stochastic oscillator works best in trading ranges, and it causes the most damage when it is read the same way in a trend. In a strong trend, closes land near the extreme of the range bar after bar, so the line pins above 80 or below 20 and stays there.
The end of the illustrative MES series shows it. From bar 25 to bar 28, fast %K reads 95.24, 95.83, 96.30 and 96.67 while price climbs from 7,642 to 7,660. A trader who sold the "overbought" bar 25 reading was 18 points, $90 per MES, offside three bars later, with the indicator still pinned.
The fix is to decide the trend first and let the stochastic time entries inside it.
- In an uptrend, look for the occasional oversold reading and ignore the frequent overbought ones.
- In a downtrend, look for the occasional overbought reading and ignore the frequent oversold ones.
- Trends that zigzag, with clear pullbacks and bounces, suit this best. A pullback in an uptrend pushes the stochastic low, and the turn back up marks the end of the pullback.
A stochastic that refuses to leave the extreme is itself information. It tells you the trend has enough pressure that fading it is a low-odds trade until the line breaks back through 80 or 20.
Related lesson: Trend following
Stochastic Strategies for Bull and Bear Markets
The trend filter turns into two different stochastic playbooks. The common thread is that you only take signals in the direction of the bigger move.
| Market condition | Trend filter example | Stochastic signal to take | Signals to ignore | Confirmation |
|---|---|---|---|---|
| Bull market or uptrend | Price above its 200-day moving average | Oversold reading, then a turn back above 20 | Overbought readings | Cross above 50 or a price break of the pullback high |
| Bear market or downtrend | Price below its 200-day moving average | Overbought reading, then a turn back below 80 | Oversold readings | Cross below 50 or a price break of the bounce low |
| Range with no clear trend | Price oscillating between support and resistance | Both extremes, near the range edges | Signals in the middle of the range | Rejection at support or resistance |
StockCharts builds its own stochastic scans this way, starting with stocks above their 200-day moving average before looking for an oversold upturn, and stocks below it before looking for an overbought downturn.
Adjusting Stochastic Sensitivity to the Trend
A strong trend can stop producing signals altogether on a slow setting. StockCharts shows a downtrend where a 20,5,5 stochastic never reached overbought for three months, while a 10,3,3 version did. In a trend, a faster setting can help you find pullback entries; in a range, a slower setting cuts the number of false extremes.
The rule is simple to state and harder to follow. Choose the trend filter before the session, write it down, and don't switch to the counter-trend playbook because one oversold reading looks tempting after a red morning.
Related lesson: Multiple timeframe analysis
A Priced Stochastic Trade on the Micro E-mini S&P 500
A stochastic signal only becomes a trade once it has an entry, a stop, a target and a size. Here is the bar 21 crossover from the illustrative MES 5-minute series, priced end to end. All prices are hypothetical.
The setup: price has made a lower low at 7,602 while %K made a higher low (bullish divergence), and %K crosses %D under 20 on bar 21, closing at 7,612. The range over the 14-bar lookback is 56 points.
Two stop choices and two targets:
- Stop A sits one tick under the signal bar low at 7,601.75. Risk is 10.25 points, 41 ticks, $51.25 per MES, or 18.30% of the 56-point range.
- Stop B is a fixed 20-point stop at 7,592. Risk is 80 ticks, $100 per MES, or 35.71% of the range.
- Target 1 is the bar 19 bounce high at 7,630, 18 points or $90.
- Target 2 is the 14-bar window high at 7,658, 46 points or $230.
| Stop and target | Risk per MES | Reward per MES | Gross reward to risk | Gross break-even win rate |
|---|---|---|---|---|
| Stop A to 7,630 | $51.25 | $90 | 1.76 | 36.28% |
| Stop A to 7,658 | $51.25 | $230 | 4.49 | 18.22% |
| Stop B to 7,630 | $100 | $90 | 0.90 | 52.63% |
| Stop B to 7,658 | $100 | $230 | 2.30 | 30.30% |
The break-even win rate is risk ÷ (risk + reward). It is the share of trades this exact setup has to win just to stand still, and it is the number your trade journal has to beat.
What Costs Do to a Stochastic Signal
Charts show trades before costs. Real fills add one tick of slippage on the entry and on the stop ($1.25 each) and a round-turn commission, here an illustrative $1.20. That is $3.70 of friction per trade.
| Stop and target | Net risk | Net reward | Net reward to risk | Net break-even win rate |
|---|---|---|---|---|
| Stop A to 7,630 | $53.75 | $88.80 | 1.65 | 37.71% |
| Stop A to 7,658 | $53.75 | $228.80 | 4.26 | 19.02% |
| Stop B to 7,630 | $102.50 | $88.80 | 0.87 | 53.58% |
| Stop B to 7,658 | $102.50 | $228.80 | 2.23 | 30.94% |
The friction is fixed, so it bites harder on the tighter stop. $3.70 is 7.22% of Stop A's risk and 3.70% of Stop B's. Fast stochastic settings tend to push traders toward tight stops and frequent trades, which is exactly where fixed costs take the biggest share.
Managing and Sizing the Stochastic Trade
Managing a stochastic trade uses the same indicator that triggered it. In the illustrative MES long from 7,612, a reasonable plan takes part of the position off at the 7,630 bounce high, where the stochastic will usually be climbing through 50, and gives the rest room toward the 7,658 window high. If %K falls back under %D before reaching 50, the momentum read that justified the trade has weakened, and a smaller position or a tighter stop is the honest response.
Position size comes from the stop distance, not from how strong the stochastic signal looks. With an illustrative $250 risk budget, the 10.25-point stop at 7,601.75 ($51.25 per MES) allows 4 MES, or $205.00 at risk. The fixed 20-point stop at 7,592 ($100 per MES) allows 2 MES, or $200. The tighter stop lets you trade more contracts, but it sits closer to ordinary noise inside a 56-point range and gets hit more often, as an earlier stochastic cross on the same series showed when a 10.25-point stop was taken out by a lower low at 7,602.
Related lesson: Position sizing
Combining the Stochastic With Other Indicators
The stochastic oscillator measures one thing, so it pairs best with tools that measure something else.
- Moving averages set direction. A 50 or 200-period moving average decides whether you take oversold or overbought signals.
- Support and resistance set location. An oversold upturn at a tested support level carries more weight than one in the middle of nowhere.
- Fibonacci retracements give pullback zones. A stochastic turn up from under 20 at a common retracement level in an uptrend lines up two independent reasons.
- Candlestick patterns give the trigger bar. A bullish engulfing bar or a hammer at the moment %K crosses %D adds price evidence to the momentum read.
- Volume confirms or refutes. A breakout that confirms a stochastic signal on rising volume is stronger than one on thin trade.
Why Williams %R Does Not Confirm the Stochastic
One popular pairing adds nothing. Williams %R, developed by Larry Williams, is the inverse of the fast stochastic. Its formula is (Highest High − Close) ÷ (Highest High − Lowest Low) × −100, and the algebra works out to %R = fast %K − 100.
On the illustrative MES series, bar 21's fast %K of 17.86 gives a %R of −82.14, and bar 25's %K of 95.24 gives −4.76. Same lines, different scale. If both indicators agree, you have counted one number twice. Pair the stochastic with a tool built from different inputs instead.
Related lesson: Williams %r
Stochastic vs RSI and Other Momentum Indicators
The stochastic oscillator and the Relative Strength Index (RSI) are both bounded momentum oscillators on a 0 to 100 scale, and they are often treated as interchangeable. They are built from different inputs, which is why they disagree at useful moments.
| Feature | Stochastic oscillator | RSI | MACD |
|---|---|---|---|
| What it measures | Close position inside the high-low range | Average gains versus average losses of closes | Distance between two exponential moving averages |
| Inputs | High, low and close | Close only | Close only |
| Scale | 0 to 100 | 0 to 100 | Unbounded, around zero |
| Common extremes | 80 and 20 | 70 and 30 | None fixed |
| Default | 14,3,3 | 14 | 12,26,9 |
| Behaviour | Fast, reacts to one wide bar | Smoother, slower to reach extremes | Trend-following, lags most |
| Best fit | Ranges and pullbacks in zigzag trends | Ranges and trend strength | Trend direction and shifts |
Wilder introduced the RSI in his 1978 book New Concepts in Technical Trading Systems with 70 and 30 as the extremes. Because the stochastic uses the high and low, a single wide bar can swing it hard, while the RSI barely notices. That makes the stochastic quicker to flag a turn and quicker to fake one.
So which is better? Neither, in the abstract. Use the stochastic when the decision depends on where price closes inside a range, and the RSI when it depends on the balance of up and down closes. Running both as confirmation mostly doubles up on the same momentum read.
The Top Momentum Indicators Compared
Ask for the top three momentum indicators and most lists name the stochastic oscillator, the RSI and the MACD. Academic tests use a similar shortlist: Coe and Laosethakul tested a moving-average rule, the RSI and the stochastic oscillator as "widely used technical trading strategies" in their 2021 study.
The three cover different jobs. The stochastic times turns inside a range, the RSI gauges the balance of up and down closes, and the MACD tracks trend direction. If you use more than one, give each a separate role, for example MACD for direction and the stochastic for the pullback entry, rather than waiting for all three to agree.
Related lesson: MACD indicator
Stochastic Oscillator Limitations and Failure Modes
The stochastic oscillator is quick, which is its strength and its main weakness. Most losses with it come from a small set of repeat mistakes.
| Stochastic failure mode | How it shows up | The correction |
|---|---|---|
| Treating an extreme as a signal | Selling an 85 reading in an uptrend and getting carried out | Trade the exit from the zone, in the direction of the bigger trend |
| Ignoring the smoothing lag | Waiting for slow %D and entering after the move has run | Measure the bar gap between fast %K and slow %D turns on your own chart |
| Reading a stale window | %K jumps because an old high rolled out, not because price moved | Check range width beside the reading, especially when it changes sharply |
| Stops inside range noise | A stop that is a tiny share of the lookback range gets hit by ordinary movement | Express the stop as a share of the range width and skip setups where it is too small |
| Fast settings on fixed costs | Many crosses a session while fees and slippage eat each small stop | Compare signal count and cost per trade before shortening the lookback |
| Acting on an unclosed bar | A cross that looks clean live disappears once the bar closes | Judge signals on closed bars only |
| Stacking clones | Treating Williams %R agreement as confirmation | Pair with an indicator from different inputs |
What Research Says About Stochastic Signals
Evidence that stochastic signals pay on their own is mixed. Coe and Laosethakul tested moving-average, RSI and stochastic rules against buy-and-hold across 4,822 stocks in 39 Asian countries. The rules outperformed buy-and-hold for 66% of stocks on average, but only after adding a filter of selling a position solely when the trade was profitable.
That filter is a behavioural rule, not the indicator. Read the result as "an indicator plus a disciplined exit can help," not "the stochastic oscillator beats the market." Stock-market results also do not transfer automatically to futures, where costs, sessions and leverage differ.
Testing a Stochastic Rule Before Trading It
A stochastic rule is only useful once it is written down tightly enough to test. Here is one version built from the pieces in this guide.
- Set the trend filter first. Take long signals only when price is above its chosen moving average, short signals only when below.
- Wait for %K to cross %D with both under 20 in an uptrend, or both over 80 in a downtrend.
- Require %D to clear 20, or fall back under 80, before entering.
- Place the stop past the swing that produced the extreme reading, and check its size as a share of the lookback range.
- Record the range width, the stop share, the net break-even win rate and the result for every trade.
Then judge it over a sample of trades, not a session. Three losers in a row says very little; fifty trades that never clear the net break-even rate says a lot. The question is whether your realised win rate beats the break-even rate the trade needed after costs.
On our accounts, the stochastic oscillator is available on the charting platforms we support, including Tradovate, TradingView through the Tradovate connection, NinjaTrader, WealthCharts, Quantower and Sierra Chart. WealthCharts also has a Chart Replay feature for practising stochastic reads on historical bars. All positions on our accounts must be closed by 4:45 PM ET, with no overnight holds, so a daily-chart stochastic setup that needs several sessions cannot be held there; it works as context for intraday entries instead. Our evaluation and funded accounts are simulated.
Related lesson: How to keep a trading journal
Stochastic Oscillator FAQ
What does a stochastic indicator tell you?
A stochastic indicator tells you where the latest close sits inside the high-low range of a set number of bars, from 0 at the bottom to 100 at the top. Readings near the top show buying pressure and readings near the bottom show selling pressure. It does not predict the next bar on its own.
What is a slow stochastic oscillator?
A slow stochastic oscillator smooths the raw %K line with a 3-period average, so slow %K equals fast %D. Its %D is then a 3-period average of slow %K. It produces fewer crosses than the fast version and turns about a bar later.
Is RSI or stochastic better?
Neither is better in general. The stochastic uses the high, low and close and reacts quickly to wide bars, while the RSI uses closes only and moves more smoothly. Pick the one whose input fits your decision, and avoid using both as confirmation.
What are the top 3 momentum indicators?
The stochastic oscillator, the RSI and the MACD are the momentum tools most traders meet first. Academic tests of momentum rules often pair the stochastic and RSI with a moving-average rule.
What does 14-3-3 mean on the stochastic oscillator?
The 14 is the lookback in bars. The first 3 smooths %K over three bars, and the second 3 averages that line into %D, the signal line. It is the default full stochastic setting.
What is the best setting for the stochastic oscillator?
No setting is best in general, because each one trades signal count against noise. Shorter lookbacks give more signals and more false ones, and settings like 20,5,5 give fewer of both. Choose one that fits your holding period and keep it fixed while you measure results.
Can the stochastic oscillator stay overbought for weeks?
Yes, in strong trends it can. An overbought reading only means closes keep finishing near the top of the range, which is normal in a sustained advance. Wait for a move back below 80, and favour signals that agree with the bigger trend.
Stochastic Oscillator Trading Risk
This stochastic oscillator guide is for education only and is not investment advice or a recommendation to trade any instrument. All prices, trades and costs in the worked examples are illustrative and are not market data or a prediction. Futures trading uses leverage, and losses can exceed what you expect from a single trade. Evaluation and funded prop accounts are simulated, and results there may differ from live markets.


